Article Text

Abstract
Background Immunotherapy is revolutionizing cancer treatment from conventional radiotherapies and chemotherapies to immune checkpoint inhibitors which use patients’ immune system to recognize and attack cancer cells. Despite the huge clinical success and vigorous development of immunotherapies, there is a significant unmet need for a robust tool to identify responders to specific immunotherapy. Early and accurate monitoring of immunotherapy response is indispensable for personalized treatment and effective drug development.
Methods We established a label-free metabolic intravital imaging (LMII) technique to detect two-photon excited autofluorescence signals from two coenzymes, NAD(P)H (reduced nicotinamide adenine dinucleotide (phosphate) hydrogen) and FAD (flavin adenine dinucleotide) as robust imaging markers to monitor metabolic responses to immunotherapy. Murine models of triple-negative breast cancer (TNBC) were established and tested with different therapeutic regimens including anti-cluster of differentiation 47 (CD47) immunotherapy to monitor time-course treatment responses using the developed metabolic imaging technique.
Results We first imaged the mechanisms of the CD47-signal regulatory protein alpha pathway in vivo, which unravels macrophage-mediated antibody-dependent cellular phagocytosis and illustrates the metabolism of TNBC cells and macrophages. We further visualized the autofluorescence of NAD(P)H and FAD and found a significant increase during tumor growth. Following anti-CD47 immunotherapy, the imaging signal was dramatically decreased demonstrating the sensitive monitoring capability of NAD(P)H and FAD imaging for therapeutic response. NAD(P)H and FAD intravital imaging also showed a marked decrease after chemotherapy and radiotherapy. A comparative study with conventional whole-body bioluminescence and fluorescent glucose imaging demonstrated superior sensitivity of metabolic imaging. Flow cytometry validated metabolic imaging results. In vivo immunofluorescent staining revealed the targeting ability of NAD(P)H imaging mainly for tumor cells and a small portion of immune-active cells and that of FAD imaging mainly for immunosuppressive cells such as M2-like tumor-associated macrophages.
Conclusions Collectively, this study showcases the potential of the LMII technique as a powerful tool to visualize dynamic changes of heterogeneous cell metabolism of cancer cells and immune infiltrates in response to immunotherapy thus providing sensitive and complete monitoring. Leveraged on ability to differentiate cancer cells and immunosuppressive macrophages, the presented imaging approach provides particularly useful imaging biomarkers for emerged innate immune checkpoint inhibitors such as anti-CD47 therapy.
- Immunotherapy
- Biomarkers, Tumor
- Immunity, Cellular
- Metabolic Networks and Pathways
- Immunity, Innate
Data availability statement
Data are available upon reasonable request.
This is an open access article distributed in accordance with the Creative Commons Attribution Non Commercial (CC BY-NC 4.0) license, which permits others to distribute, remix, adapt, build upon this work non-commercially, and license their derivative works on different terms, provided the original work is properly cited, appropriate credit is given, any changes made indicated, and the use is non-commercial. See http://creativecommons.org/licenses/by-nc/4.0/.
Statistics from Altmetric.com
WHAT IS ALREADY KNOWN ON THIS TOPIC
Although immunotherapies dramatically improved patients’ survival, the response rate remained low (~20%). Therefore, developing predictive biomarkers and sensitive drug response monitoring tools is highly desirable to properly select responding patients to immunotherapy.
WHAT THIS STUDY ADDS
Our work provides the first in vivo evidence indicating that the optical metabolic markers of reduced nicotinamide adenine dinucleotide (phosphate) hydrogen and flavin adenine dinucleotide, two important coenzymes, have predictive potential in response of anti-CD47 (cluster of differentiation 47) immunotherapy as well as chemotherapy and radiotherapy.
HOW THIS STUDY MIGHT AFFECT RESEARCH, PRACTICE OR POLICY
The proposed and well-validated predictive imaging biomarkers targeting cellular metabolism of cancer and immune cells will greatly contribute to improve patients’ survival by providing a means to select patients who might benefit from anti-CD47 immunotherapy.
Background
Anticancer immunotherapy is a paradigm shift to raise the prospect for cancers to be managed as a chronic disease rather than a terminal illness.1 The nearly neglected old idea of activating patients’ immune system to fight tumors has now resulted in an explosion of successful immunotherapies particularly in the form of immune checkpoint inhibition.2 Antibodies targeting programmed cell death protein 1 (PD-1)/programmed death-ligand 1 (PD-L1) or cytotoxic T-lymphocyte antigen 4 to unleash T cells have shown durable regression of tumors and improved survival outcomes in melanoma, non-small cell lung cancer, and many others as a new pillar of oncologic therapy in the past decade.3 ,4 Cluster of differentiation 47 (CD47)-targeted innate immune checkpoint inhibitors have recently emerged as next-generation therapy with promising initial clinical data and a unique mechanism for reprogramming tumor-associated macrophages (TAMs).5 CD47 is an antigen known as the ‘don’t eat me’ signal that tumor cells put up against macrophages to disrupt phagocytic clearance.6 Blockades targeting CD47 on cancer cells or its corresponding receptor, signal regulatory protein alpha (SIRPα), on macrophages enable TAMs to attack and kill cancer cells via reactivation of phagocytosis and innate immune sensing.7–9
Despite the revolutionary clinical success and active new developments, the overall response rate of immunotherapy is generally less than 20% for the most common tumors. Especially, triple-negative breast cancer (TNBC) has recorded a very low objective response rate of around 5% to PD-1/PD-L1 blockade, although the recent TONIC trial improved the objective response rate slightly higher than 20% with induction of low-dose chemotherapy.10 Development of robust predictive biomarkers and sensitive drug response monitoring tools is a major unmet need in immuno-oncology to identify early responders and non-responders.11
Immunohistochemistry (IHC) is the gold standard for companion tests of biomarker analysis such as the PD-L1 expression measurement IHC test approved by the US Food and Drug Administration (FDA).12 However, IHC, flow cytometry, or other in vitro cell lysate-based destructive tests via invasive biopsy are inadequate surrogates for dynamic and global assessment of metabolic heterogeneity of immune cells, thus providing low sensitivity and limited or wrong ‘snapshot’ information for therapeutic response. To address this limitation, in vivo, in situ metabolic imaging is presented in this study to play a pivotal role in observation of metabolic processes through a course of immunotherapy.13 Fluorine-18 fluorodeoxyglucose positron emission tomography (18F-FDG PET) has been extensively used for glucose metabolism imaging in clinical oncology enabling earlier assessment of the response than the relatively delayed morphological change-based radiological imaging modalities. However, nuclear imaging methods are mainly limited by using ionizing radiation, low spatial resolution, and sensing of a single marker at a time.14 Hyperpolarized MRI using 13C-lactate or 13C-pyruvate is gaining significant attention for monitoring cancer progression and treatment response with enhanced sensitivity and multiplexing capability but is still hindered by the difficulty of single-cell tracking due to limited spatial resolution.15
Recently, two-photon excited fluorescence imaging (TPFI) has been highlighted as a high-resolution, non-ionizing, non-destructive, and multiparametric imaging technique to capture endogenous metabolic contrasts.16 Cellular metabolism is a key factor to determine tumor progression and overall antitumor immunity. Aerobic glycolysis is a hallmark of cancer cells and malignancy. Immune active cells also have high metabolic demands for glucose uptake, whereas immunosuppressive cells preferentially rely on oxidative phosphorylation (OXPHOS).17 In vivo TPFI of specific endogenous autofluorescence signals from two important metabolic coenzymes, NAD(P)H (reduced nicotinamide adenine dinucleotide (phosphate) hydrogen) and FAD (flavin adenine dinucleotide), provides a sensitive and quantitative approach to detect cellular metabolism heterogeneity with single-cell resolution.18–20 NAD(P)H is generally produced in the metabolic glycolysis pathway including the pentose phosphate pathway (PPP) and consumed in the oxidative pathway, OXPHOS. FAD is largely associated with mitochondria and is generated in the pathway of OXPHOS.18 21 The optical redox ratio, defined as the division between NAD(P)H and FAD autofluorescence, enables dynamic measurements of cellular metabolism. Therefore, in vivo monitoring of the changes in the cellular concentration of NAD(P)H and FAD and measurement of optical redox ratio without any injection of exogenous agents have a high potential to provide a sensitive differentiation tool for function of cancer and immune cells thus capturing the immunotherapy action at early time points with no toxicity.
Here, we provide and evaluate a label-free metabolic intravital imaging (LMII) technique as a potential imaging biomarker of anti-CD47 immunotherapy by in vivo spatiotemporal monitoring of metabolic heterogeneity for cancer and immune cells based on two-photon excited autofluorescence intensities of NAD(P)H and FAD. Focus was given to TNBC model due to its well-known high content of TAMs, high expression of CD47, and poor prognosis associated with CD47 expression.22
Methods
Mice and cell line
To implant a dorsal skinfold window chamber in female BALB/c mice (aged 8–10 weeks), we first anesthetized the mice using a mixture of ketamine (100 mg/kg) and xylazine (10 mg/kg) and removed the dorsal fur of each animal using hair removal cream. Then, we stretched the skin from the back of each mouse and used two custom-made titanium frames to bracket the fold of the skin. After holding the skin in place with sutures, we used two lower screws to penetrate the skinfold through small incisions. Next, we used a scalpel to cut a circle (15 mm in diameter) in one layer of skin which includes the striated muscle, epidermis, and subcutaneous tissue. Finally, we covered the remaining layer with a glass coverslip laid in one of the titanium frames; this was held in place with a retaining ring. During this procedure, approximately 1×10⁶ 4T1_PB3R-RFP-luc cancer cells in 20 µL of Rosewell Park Memorial Institute (RPMI) 1640 medium were injected under the fascia and allowed to grow for 9 days until visible tumors had formed. Tumor growth was monitored by intravital microscopy of 4T1_PB3R-RFP fluorescence, color anatomy of the vasculature, and in vivo bioluminescence imaging. After imaging, mice were humanely euthanized under anesthesia.
The 4T1 cells represent murine TNBC cell line which successfully mimic tumor growth and characteristics of human TNBC. The 4T1 reporter cell line (4T1_PB3R) was gifted by Dr Liang-Ting Lin and had been stably transduced with a monomeric red fluorescent protein (RFP) gene and a firefly luciferase (luc) gene for fluorescence intravital microscopy and in vivo bioluminescence imaging. Skinfold murine TNBC models using 4T1_PB3R-RFP-luc cells were mainly used throughout the study to evaluate our metabolic imaging technique as a sensitive monitoring tool for early responses to immunotherapy, chemotherapy, and radiotherapy.
Label-free metabolic intravital imaging
LMII was performed based on TPFI of metabolic coenzymes NAD(P)H and FAD using a customized multiphoton confocal microscope (A1RMP+, Nikon, Japan) equipped with a tunable Ti:S laser (Chameleon vision II, Coherent, USA). A 40× water-immersion objective (CFI Apo 40× W NIR NA 0.80, WD 3.5 mm, Nikon, Japan) was used for data collection with zooming to assess 30–200 cells per imaging at single-cell resolution. Multichannel ultra-deep imaging using high-sensitivity GaAsP non-descanned detectors was performed by the laser tuning to 820 nm for NAD(P)H excitation with a short-pass filter of 492 nm for NAD(P)H emission detection and 910 nm for FAD excitation with a filter of 629/56 nm for FAD emission detection based on the reported spectral characteristics.19 The autofluorescence spectrum of NADH, a metabolite of glycolysis, and NADPH (NADH phosphate), a metabolite of PPP, is very similar; hence, NAD(P)H is used to demonstrate the fluorescent signals of NADH and NADPH. For each field of view (FoV), an NAD(P)H image was acquired first followed immediately by a FAD image. The mean laser power was adjusted to 15 mW for both NAD(P)H and FAD regardless of static or time-series imaging. Settings for the offset, pinhole, and gain were also kept consistent across all imaging sessions. Time-lapse sequences were typically scanned at an interval of 1 s with duration of 1–2 min for each FoV. The 512×512-pixel images were acquired using a pixel dwell time of 2.2 µs and a fast frame rate of 0.938 fps. All imaging conditions were determined by optimization experiment to ensure that no photobleaching or phototoxicity occurred. Each skinfold window was imaged at various non-overlapping areas according to the anatomic monitoring results to visualize tumor growth or detect metabolic changes in response to various therapies.
Treatment with anti-CD47 therapy, chemotherapy and radiotherapy
To test sensitive therapeutic monitoring capability of the LMII technique, we first monitored NAD(P)H and FAD signals over time and selected the best time point (day 10) for treatment. Then, systemic intravenous (IV) injections of anti-mouse CD47 monoclonal antibodies (anti-CD47 mAbs, clone MIAP301, Rat IgG2a, κ, BioXcell, USA) and rat IgG2a mAbs isotype control (clone 2A3, Rat IgG2a, κ, BioXcell, USA) were performed with 10 mg/kg daily for 5 days. For chemotherapy, mice were treated with paclitaxel (PTX) (SelleckChem, USA) at a total concentration of 10 mg/kg by bolus intraperitoneal (IP) injection to induce tumor regression. In addition, zoledronic acid (ZA) (SelleckChem, USA) was used in tumor mice for the further validation of chemotherapeutic response (150 µg/kg IP injection daily for 5 days). For local radiotherapy of the skinfold tumor area, a daily dose of 2 Gy was given for 4 days (at a rate of 1.8 Gy/min) using Faxitron Bioptics MultiRad 255 Compact Cabinet X-ray System (RPS service, UK). In vivo monitoring of therapeutic efficacy was performed until day 16 to test early and sensitive monitoring potential of the LMII.
Quantification of NAD(P)H, FAD, and optical redox ratio
Two-photon excited autofluorescence signals from NAD(P)H and FAD were monitored before and after immunotherapy, chemotherapy, and radiotherapy. Each pixel intensity within the cells was calculated on each day to determine the change in intensity over time. Later, the calculated NAD(P)H or FAD pixel intensities of the cells on each day were randomly selected from different mice (n=5~8 mice) by a computer to create heatmaps (MATLAB, Mathworks). In addition, we checked every image manually to make sure that the cells identified by MATLAB were real cells instead of noise or debris. The kinetics of NAD(P)H and FAD fluorescence in tumor cells after treatment with different therapeutic modalities were also visualized by heatmaps. Each colored small square in the heatmap represents the visible NAD(P)H or FAD pixel intensity of the cells and the selected 10,000 NAD(P)H or FAD pixel intensities of the cells from various mice were measured every day for 16 days. Finally, the Pearson correlation coefficient (PCC) by correlation measurement and the Manders’ coefficients (Manders’ tM1 and tM2) by co-occurrence measurement were used to quantify the degree of co-localization between two different fluorescence signals using Image J (NIH; http://rsbweb.nih.gov/ij/). For the in vivo fluorescent immunostaining images, a set threshold was applied to remove the background signal consistently using Nikon NIS-Elements software.
There are two ways to calculate the redox ratio (NAD(P)H/FAD) of each cell: at the cell level and at the pixel level. For the pixel-level calculation, the redox ratio (NAD(P)H/FAD) was analyzed on a pixel basis from the FAD and the NAD(P)H fluorescence intensity images. Later, all pixels of each cell were averaged for a single redox ratio value for the cell. On the other hand, for the cell average method, the redox ratio was analyzed on a cell basis: the pixel intensities of NAD(P)H and FAD autofluorescence in each cell were summed in a separate manner and then the ratio of the summed intensities was obtained as the redox ratio of the cell. In this study, we created the heatmap of NAD(P)H and FAD using pixel-level calculation, whereas cell average method was mainly used for the calculation of redox ratio. More specifically, the cumulative total pixel intensities were divided by the total number of pixels in the cells of each image to calculate a mean pixel intensity of NAD(P)H or FAD. Then, the mean pixel intensity of NAD(P)H in each image was divided by the corresponding mean pixel intensity of FAD to calculate a redox ratio.
Flow cytometry validation
The 4T1_PB3R-RFP cells (106) in 100 µL of RPMI 1640 medium were injected into the inguinal mammary fat pads of female BALB/c mice. Tumors were allowed to grow to approximately 150 mm3. After systemic treatments, we isolated the tumors from the mice; these tumors were enzymatically digested (Collagenase D, Sigma, USA) into single-cell suspensions and then passed through a 70 µm nylon strainer (BD Biosciences, USA). To analyze the population shift of NAD(P)Hhi (cells high in NAD(P)H intensity), FADhi (cells high in FAD intensity), and RFP+ cells before and after treatment of different therapeutic modalities, we excited endogenous NAD(P)H and FAD signals by applying an ultraviolet laser (375 nm) and a blue laser (488 nm), respectively.23 The NAD(P)H signals were detected using a 450/20 bandpass filter, while the FAD signals were detected using a 530/30 bandpass filter (NAD(P)H emission max=450 nm and FAD emission max=530 nm). To detect RFP signals, we used a red laser (561 nm) with a 585/15 bandpass filter. Flow cytometry standard (FCS) data files were saved and analyzed using FlowJo software V.10.6.2 (BD Biosciences, USA).
In vivo bioluminescence imaging and near-infrared fluorescence imaging with 2-DeoxyGlucosone 750 of tumor mice
In vivo bioluminescence imaging was performed on a dorsal skinfold chamber tumor in female BALB/c mice. Tumor growth and therapeutic efficiency were monitored over time by recording the whole-body bioluminescence signals emitted from skinfold windows. For this imaging, 150 mg/kg of filter-sterilized D-luciferins (Promega, USA) were intraperitoneally injected. All mice were subsequently anesthetized in an oxygen-rich induction chamber with 2% isoflurane. Then, bioluminescence imaging acquisition was performed 10 min after the injection of D-luciferin by IVIS Spectrum CT (PerkinElmer, USA).
IVISense 2-DeoxyGlucosone (DG) 750 probe (excitation 745 nm and emission 820 nm, PerkinElmer, USA), a near-infrared fluorescence probe, enables in vivo targeting of tumors that typically exhibit elevated glucose uptake rate in comparison with surrounding tissues. To achieve maximum glucose targeting and enhance tumor uptake, these probes have been designed to contain four 2-DG molecules per dye molecule. In this study, 2-DG 750 was applied for monitoring of glucose uptake in skinfold tumor models before (day 9) and after anti-CD47 mAb treatment (day 14) to validate the LMII data and compare the imaging response sensitivity with the LMII. IV injection of 7.5 nmol 2-DG 750 was performed for each tumor-bearing mouse which was subsequently imaged at 1 hour post-probe administration via near-infrared detection channel using IVIS Spectrum CT.
To measure photon radiance, we defined the regions of interest encompassing the window area and quantitatively measured bioluminescence or near-infrared fluorescence as the total flux (photons/second from the surface) in each pixel using PerkinElmer Living Image software.
Synthesis and preparation of specific macrophage-targeting fluorescent probes
We selected several specific molecules or peptides tagged with fluorophore capable of targeting M1 and M2 TAMs, including (1) M1-like cell targeting, monocyte chemoattractant protein 1 (MCP1) targeting probe24; (2) M1-like cell targeting, C-C chemokine receptor 2 (CCR2) targeting tailor-made peptide (QRLASYRRI); (3) M2-like cell targeting, M2pep probe25; and (4) M2-like cell targeting, dextran.26 Different fluorophores including fluorescein isothiocyanate (FITC), tetramethylrhodamine (TRITC), and Alexa Fluor (AF) 680 were applied to label each targeting moiety for intravital imaging.
In vivo fluorescence immunostaining
Female BALB/c mice were injected with 1×10⁶ of 4T1_PB3R-RFP cancer cells after implantation of dorsal window chambers and subjected to intravital imaging 1 week after tumor inoculation following the growth of tumors. Pan macrophages and immune-active phagocytotic M1 macrophages were visualized in vivo by injecting anti-F4/80-phycoerythrin (PE) mAb (F4/80-PE, Abcam, USA, 1:3 dilution) and anti-CD86-FITC mAb (CD86-FITC, BD Biosciences, USA, 1:3 dilution), respectively. Immunosuppressive M2 macrophages were targeted in vivo by injecting anti-CD206-AF 647 mAb (CD206-AF647, BD Biosciences, USA, 1:3 dilution), anti-CD301b-AF 647 (CD301b-AF647, BioLegend, USA, 1:3 dilution), or anti-CD11b-FITC mAb (CD11b-FITC, BD Biosciences, USA, 1:3 dilution). Double labeling was performed by injecting a mixture of anti-CD4-FITC mAb (CD4-FITC, BD Biosciences, USA, 1:3 dilution) and anti-CD25-PE mAb (CD25-PE, BD Biosciences, USA, 1:3 dilution) to visualize the regulatory T cells (Treg). A single CD4-FITC (BD Biosciences, USA, 1:3 dilution) was injected to visualize helper T cells (Th). Anti-CD11c-FITC mAb (CD11c-FITC, BD Biosciences, USA, 1:3 dilution) was used to label dendritic cells (DCs). All fluorescent antibodies were injected into tumor under the imaging window using 29 G insulin needle. M1-like cell targeting probes, such as MCP1-FITC (150 µg/mouse diluted in 100 µL of 1% bovine serum albumin-phosphate buffered saline (BSA-PBS)) and CCR2-FITC (30 µg/mouse diluted in 100 µL of 1% BSA-PBS), were intravenously injected to allow the imaging of M1 macrophages. M2-like cell targeting probes, such as dextran-AF 680 (dextran-AF680) (450 µg/mouse diluted in 100 µL of 1% BSA-PBS) and M2pep-TRITC (150 µg/mouse diluted in 100 µL of 1% BSA-PBS) were intravenously injected to allow the imaging of M2 macrophages.
Statistical analysis
All data are expressed as mean±standard deviation (SD). The Student’s t-test and Mann-Whitney test were carried out using GraphPad Prism V.8 software for the data related to immunotherapy, chemotherapy, and radiotherapy. Differences between the control and experimental groups were determined using two-sided, unpaired, or paired Student’s t-tests. α levels of 0.05 were applied to define statistical significance and error bars represent SD unless otherwise noted.
Results
LMII of NAD(P)H and FAD sensitively delineated tumor growth in skinfold mouse models of TNBC
As the first step towards the establishment of an LMII technique, female BALB/c mice (aged 8–10 weeks) were implanted with a dorsal skinfold window chamber and injected with 4T1_PB3R-RFP TNBC cells27 (figure 1A and online supplemental video 1); this created a suitable foundation for intravital imaging. Angiogenesis and tumor formation are dynamic and active process. One of the main strengths of a skinfold chamber is superior performance to monitor angiogenesis and tumor generation in vivo longitudinally for up to several weeks with high spatial and temporal resolution.28 Based on this strength, we were able to demonstrate the fine details of angiogenesis and generation of tumor nodules in the skinfold TNBC models compared with control mice (figure 1B and online supplemental figure 1). Using established skinfold models and optimization of intravital imaging technologies, high-resolution cellular in vivo images of NAD(P)H and FAD were obtained in murine models of 4T1 cancer based on TPFI as shown in figures 1C and 2A. Quantitative and comprehensive cell metabolism analysis was also performed using heatmap representation. Each colored small square represents the visible pixel intensity of NAD(P)H in each cancer cell. The 10,000-pixel intensities were randomly measured from the cells in different mice every day for 16 days after tumor inoculation (n=7 mice) (figures 1D and 2B). Tumor progression was well defined as determined by detection of significant increase in NAD(P)H and FAD signals from both cancer cells and immune cells (p=0.0002 for mean pixel intensity of NAD(P)H on day 2 and day 16) (figures 1E and 2C). A significant net gain of NAD(P)H relative to FAD (the optical redox ratio) was observed in terms of tumor growth due to the relative increase of glycolysis (p=0.0002 for optical redox ratio on day 2 and day 16) (figure 2D). In the stroma, we found that tumor cells exhibited a high auto-fluorescent NAD(P)H signal intensity and were surrounded by stromal collagen, which was imaged by second harmonic generation, consistent with a previous ex vivo observation29 (PCC=0.69, tM1=0.559, and tM2=0.538 between 4T1_PB3R-RFP cells and NAD(P)Hhi cells) (figure 1F). Of note, the FADhi cells that reside inside tumors are often observed along collagen fibers, consistent with findings that stromal or immune cells track along collagen to engage tumor cells30 31 (figure 2F). Overall, we showcased metabolic imaging performance with the single-cell resolution based on TPFI of NAD(P)H and FAD.
Supplementary video
Supplemental material

Metabolic profiling by intravital NAD(P)H autofluorescence imaging reveals tumor growth in skinfold models of triple-negative breast cancer. (A) Experimental set-up. Skinfold murine cancer models by transplantation of 1×10⁶ 4T1_PB3R-RFP cells in BALB/c female mice were established and subjected to label-free metabolic intravital imaging (LMII). (B) Representative time-lapse anatomical imaging of tumor growth. Color anatomy shows formation of tumor nodules and angiogenesis in a skinfold window chamber of a tumor model over a control mouse. Tumor formation was clearly confirmed after removing the skinfold chamber (arrows). (C) In vivo LMII shows a complete overview of tumor growth with increasing trend of NAD(P)H signal. (D) Kinetics of single-cell metabolism with NAD(P)H signal. Each colored small square represents the visible pixel intensity of NAD(P)H in each cancer cell. The 10,000-pixel intensities were randomly measured from the cells in different mice every day for 16 days (n=7 mice). Cellular NAD(P)H signals on day 2 and day 16 show significant difference as highlighted by big red rectangles. (E) Quantification of NAD(P)H signal changes with tumor growth (n=9 images, p=0.0002 for mean pixel intensity of NAD(P)H on day 2 and day 16). (F) Representative LMII data show high overlap between 4T1_PB3R-RFP cells and NAD(P)H expressing cells. Fibrillar structures indicate collagen visualized by second harmonic generation (SHG). Scales, 20 µm. The rightmost graph represents a scatter plot of the intensities registered in NAD(P)H and RFP channels. Pearson’s R coefficient for correlation measurement and Manders’ coefficients for co-occurrence measurement are indicated in the top left corner of the plot. (G,H) Flow cytometry data and a bar graph show that NAD(P)H+ cells, RFP+ cells, and NAD(P)H+RFP+ cells are significantly increased from day 10 to day 18 (n=15 mice, p=0.0007 for the number of NAD(P)H+RFP+ cells on day 10 and day 18). NAD(P)H, reduced nicotinamide adenine dinucleotide (phosphate) hydrogen; NAD(P)Hhi, cells high in NAD(P)H intensity; RFP, red fluorescent protein.

Metabolic profiling by intravital FAD autofluorescence imaging reveals tumor growth in skinfold models of triple-negative breast cancer. (A) Label-free metabolic intravital imaging (LMII) shows increasing trend of FAD signal with tumor growth. (B) Kinetics of single-cell metabolism with FAD signal. Each colored small square represents the visible pixel intensity of FAD in each cancer cell. The 10,000-pixel intensities were randomly measured from the cells in different mice every day for 16 days (n=7 mice). Cellular FAD signals on day 2 and day 16 show significant difference as highlighted by big red rectangles. (C) Quantification of FAD signal changes with tumor growth (n=8 images, p=0.0002 for mean pixel intensity of NAD(P)H on day 2 and day 16). (D) Increased redox ratio was observed with tumor growth from day 2 to day 16 (p=0.0002 for optical redox ratio on day 2 and day 16). (E) Flow cytometry data show increased population of FAD+ cells with tumor growth from day 10 to day 18. (F) In vivo LMII of NAD(P)H and FAD in tumor environment provides endogenous stromal and tumor cell contrast. Fibrillar structures indicate collagen visualized by second harmonic generation (SHG). Scales, 20 µm. FAD, flavin adenine dinucleotide; FADhi, cells high in FAD intensity; NAD(P)H, reduced nicotinamide adenine dinucleotide (phosphate) hydrogen; NAD(P)Hhi, cells high in NAD(P)H intensity.
To further validate the in vivo metabolic profile of tumor growth by flow cytometry, we established murine models of 4T1 breast cancer by orthotropic injection of 4T1_PB3R-RFP cells. We proved that there were significant population shifts of NAD(P)H+, FAD+, and RFP+ cells with tumor growth by flow cytometric analysis as shown in figures 1G and 2E. In addition, the proportion of NAD(P)H+ RFP+ cells increased significantly with tumor growth (p=0.0007 between day 10 and day 18); this was consistent with the NAD(P)H and FAD trend determined by the LMII technique (figure 1H). Taken together, the findings implied that NAD(P)H and FAD metabolic imaging markers have significant potential to predict tumor growth in a consistent manner.
In vivo visualization of the mechanism of the CD47-SIRPα pathway after anti-CD47 antibody treatment and metabolic profiling of CD47 expressing cells
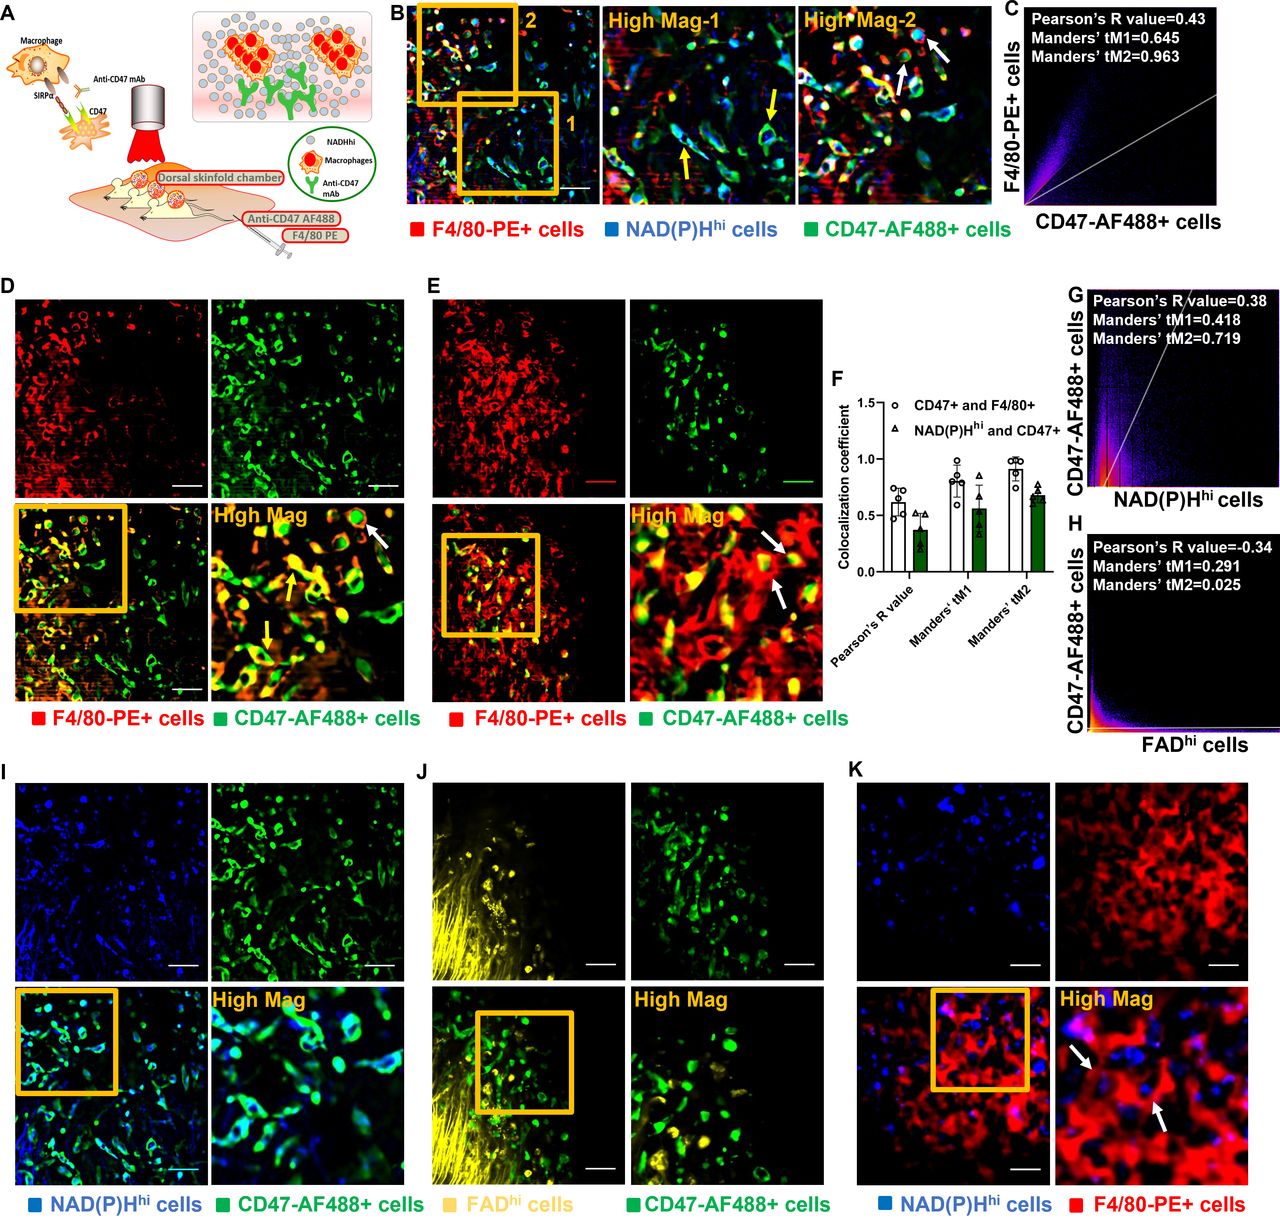
CD47, an antigen known as the ‘don’t eat me’ signal, has received significant attention in preclinical studies and clinical trials,32 thus paving the way for treatment of various tumors with its unique mechanism. The CD47-SIRPα blockade enables TAMs to attack and kill cancer cells via the reactivation of phagocytosis and innate immune sensing (figure 3A). Here, we established an experimental system based on combination of intravital microscopy using dorsal skinfold chambers and in vivo immunostaining with various fluorescent antibodies to characterize the mechanisms of the CD47 pathway and to investigate the relationship between CD47 mAb response and optical metabolic imaging markers with NAD(P)H and FAD. To expand our ability to measure the metabolism of cancer and immune cells and to differentiate cell subtypes with characteristic metabolic profiles, we developed a powerful in vivo imaging technique harnessing well-optimized intravital imaging tools and procedures including a ported skin chamber. This was created by inserting an insulin needle through a hole bored into the skinfold frame to inject fluorescent antibodies within the tumor and imaging range of the microscope. The developed experimental system allowed simultaneous tracking of three components: anti-CD47-AF488 mAb, anti-F4/80-PE mAb, and NAD(P)Hhi cells (figure 3B). Specifically, the system enabled us to examine the tropism and distribution of the anti-CD47-AF488 mAb at subcellular resolution within the tumor stroma in a longitudinal manner after administration (figure 3B and online supplemental video 2). Upon the administration of anti-CD47-AF488 mAb and F4/80-PE mAb, antibodies rapidly perfused the tumor vessels and gradually disseminated out of the vasculature and into the tumor interstitium. Then, anti-CD47-AF488 mAbs rapidly targeted NAD(P)Hhi cells indicated by yellow arrows in figure 3B. Antibody-dependent cellular phagocytosis (ADCP) events occurred as rapid but short waves between F4/80-PE-labeled macrophages and anti-CD47-AF488 mAb-targeted cells (figure 3B–E and online supplemental video 3). CD47 inhibitor-treated cancer cells were first overlapped with F4/80+ macrophages as indicated by yellow arrows in figure 3D and then soon engulfed by the macrophages extensively indicated by white arrows in figure 3D,E. Two-dimensional (2D) histogram with a positive PCC and Manders’ coefficients (PCC=0.43, tM1=0.645, and tM2=0.963) revealed a high co-localization between F4/80-PE-targeted macrophages and anti-CD47-AF488 mAb-targeted cells (figure 3C).
Supplementary video
Supplementary video

Imaging of the mechanisms of the CD47-SIRPα pathway in vivo unravels antibody-dependent cellular phagocytosis (ADCP). (A) Schematic diagram of intravital imaging procedure for imaging the mechanisms of the CD47-SIRPα pathway in vivo using triple-negative breast cancer models. (B) Representative images for illustration of the CD47-SIRPα pathway. After injection of anti-CD47-AF488 and F4/80-PE, anti-CD47-AF488 mAb (green) rapidly targeted NAD(P)Hhi cancer cells (blue) indicated by yellow arrows. Engulfment of NAD(P)Hhi and CD47-AF488+ cancer cells by F4/80-PE+ macrophages (red) was well observed (white arrows) presenting ADCP events. (C) Quantitative co-localization analysis using Pearson’s coefficient and Manders’ coefficients further elaborated imaging observation. (D,E) ADCP events occurred as rapid but short wave between F4/80-PE-labeled macrophages (red) and CD47-AF488 mAb-targeted cells (green). CD47 inhibitor-treated cancer cells were first overlapped (yellow arrows) with F4/80+ macrophages and then soon engulfed (white arrows) by the macrophages extensively. (F–J) CD47-AF488 mAb-targeted cells (green) depict metabolic phenotype of strong NAD(P)H expression (blue), (I) whereas no meaningful co-localization with FADhi cells (yellow) (J). Analyses with Peason’s coefficient and Manders’ coefficients corroborated imaging results (F–H). (K) Real-time visualization of phagocytosis events (white arrows) with treatment of CD47 blockade was also achieved using NAD(P)H imaging. Scales, 20 µm. AF, Alexa Flour; CD47, cluster of differentiation 47; FAD, flavin adenine dinucleotide; FADhi, cells high in FAD intensity; mAb, monoclonal antibody; NAD(P)H, reduced nicotinamide adenine dinucleotide (phosphate) hydrogen; NAD(P)Hhi, cells high in NAD(P)H intensity; PE, phycoerythrin; SIRPα, signal regulatory protein α.
Of note, in vivo imaging study (figure 3I) and 2D intensity histogram analysis (PCC=0.38, tM1=0.418, tM2=0.719, figure 3G) demonstrated a high degree of overlap between NAD(P)Hhi cells and CD47-AF488+ cells, thus indicating that the NAD(P)Hhi signature might predominantly identify tumor cells with high expression of CD47 molecules in the tumor microenvironment (TME). However, there was no co-localization between the FADhi cells and CD47-AF488+ cells (PCC=−0.34, tM1=0.291, tM2=0.025, figure 3H,I). The potential reason is that the FADhi signature mainly represents immunosuppressive cells, whereas the targeting ability of NAD(P)H imaging is mainly for tumor cells. Leveraging specific targeting of NAD(P)H metabolism for TNBC cells having high expression of CD47, a dominant and representative role of ADCP also recorded between F4/80-PE-labeled macrophages and NAD(P)Hhi cells (figure 3K and online supplemental video 4). Quantitative analysis corroborated in vivo observations (figure 3F). These results provide the first in vivo illustration of the mechanism of anti-CD47 immunotherapy via the CD47-SIRPα pathway-mediated ADCP harnessing the power of our developed LMII technique.
Supplementary video
Evaluation of the efficacy of LMII to gauge differential responses to anti-CD47 immunotherapy
To test the efficacy of the developed LMII technique for therapeutic monitoring tool, we first optimized the NAD(P)H and FAD signals and selected the best time point (day 10) to begin anti-CD47 mAb (MIAP301 mAb) treatment in mice. Figures 4 and 5 and online supplemental figures 2 and 3 demonstrate that there was a dramatic decrease of metabolic NAD(P)H and FAD signals observed by the LMII technique after anti-CD47 mAb treatment (10 mg/kg IV injection for 5 days, p<0.0001 for average intensity before and after treatment, n=16 images) when compared with isotype control injected group (10 mg/kg IV injection for 5 days, p=0.0008 for average intensity before and after treatment, n=14 images). Comprehensive cell metabolism quantification using heatmap from six mice for anti-CD47 mAb treatment (figures 4D and 5E) and five mice for isotype control treatment (online supplemental figures 2B and 3B) elucidated consistent trend of significant intensity increase for NAD(P)H and FAD prior to day 9 and then sensitive intensity decrease after day 10 with CD47 therapy treatment over continuous signal increase with isotype treatment. Moreover, the optical redox ratio was also decreased significantly following 5 days of CD47 therapy treatment and continuously increased after isotype control treatment (p=0.0426 for anti-CD47 mAb treatment and p=0.0042 for isotype treatment between day 9 and day 16, figure 5D and online supplemental figure 3D). To further verify the local antitumor activity mediated by anti-CD47 mAb and validate sensitive treatment monitoring potential of the LMII technique, we, therefore, performed conventional whole-body bioluminescence imaging and fluorescent glucose imaging with 2-DG 750 in the same skinfold mice right after intravital imaging. The bioluminescence imaging data of 4T1_PB3R-RFP-luc tumor mice by IVIS and its quantification shown in figure 4E,F demonstrate that the bioluminescence signal in each skinfold mouse was significantly reduced after anti-CD47 mAb treatment (n=6 mice, p=0.0122) when compared with isotype control group (n=5 mice, p=0.0342) proving the observed LMII data. Conventional whole-body fluorescent glucose imaging mimicking clinical 18F-FDG PET was also performed via tail vein injection of 2-DG 750 probes before and after anti-CD47 mAb treatment using IVIS. Representative 2-DG 750-based near-infrared fluorescent images displayed the location of 4T1 tumors compared with surrounding tissues (figure 5F). Similar to bioluminescence imaging, 2-DG 750 uptake was decreased (n=5 mice, p=0.035) after anti-CD47 mAb administration for the skinfold models (figure 5G). It is worth noting that the developed LMII technique showed superior sensitivity to detect CD47 immunotherapy response (p<0.0001, figures 4C and 5C) over bioluminescence imaging (p=0.0122, figure 4F) or fluorescent glucose imaging (p=0.035, figure 5G). We next removed the cover glass from the window and observed the phenomenon of serious necrosis in the skinfold model without anti-CD47 mAb treatment, whereas no necrosis and reduced number and size of tumor nodules were found in the treated mice confirming CD47 therapy treatment effect (figure 5H). Figure 4G,H and figure 5I show flow cytometry data for validation of the LMII, that is, decreased number of NAD(P)H+ cells, FAD+ cells, and 4T1-RFP+ cells with anti-CD47 mAb treatment compared with isotype control antibody treatment. We also analyzed NAD(P)H+ RFP+ cells and showed that the proportion of NAD(P)H+ RFP+ cells was significantly reduced after anti-CD47 mAb (MIAP301) treatment when compared with isotype control (figure 4H) (n=11 mice, p=0.0043). Collectively, these data suggest that NAD(P)H and FAD are promising imaging biomarkers that can predict or evaluate the therapeutic response to anti-CD47 immunotherapy. Our results not only confirmed our existing knowledge about the inhibition of CD47 but also revealed the therapeutic implications of NAD(P)H and FAD to further improve immunotherapy.
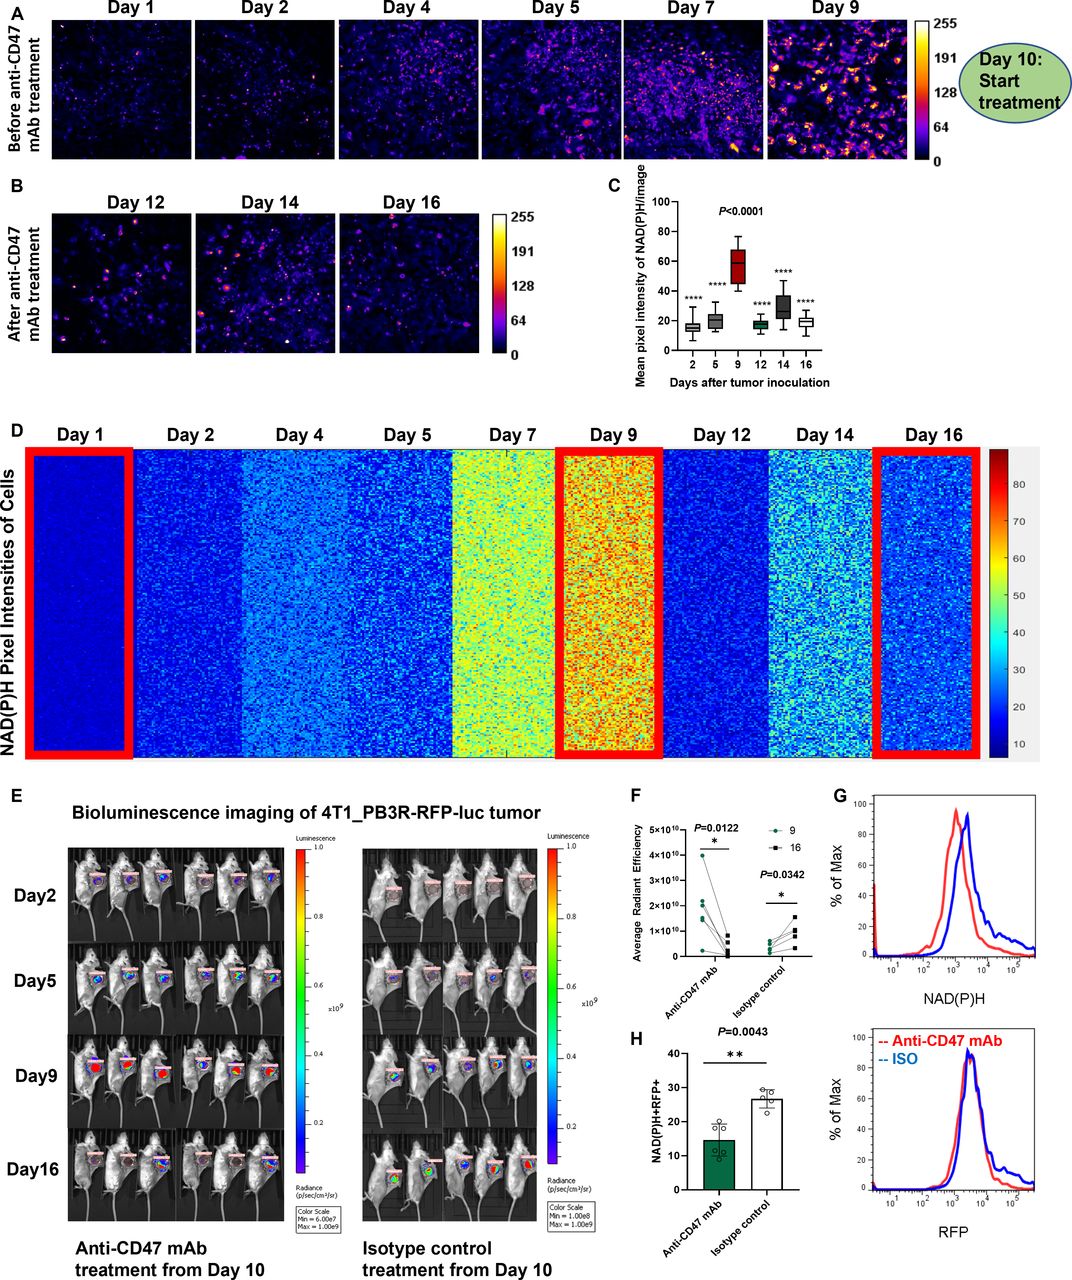
Sensitive monitoring of anti-CD47 therapy response by dynamic metabolic imaging of NAD(P)H. (A,B) Label-free metabolic intravital imaging (LMII) of NAD(P)H demonstrates sensitive early response at single-cell level after anti-CD47 mAb (MIAP301) treatment of a triple-negative breast cancer model (10 mg/kg intravenous injection daily for 5 days). (C) Quantification of average intensity shows statistically significant difference in NAD(P)H signals before and after MIAP301 treatment (n=16 images, p<0.0001). (D) Kinetics of single-cell metabolism with NAD(P)H signal. Each colored small square represents the visible pixel intensity of NAD(P)H in each cancer cell. The 10,000-pixel intensities were randomly measured from the cells in different mice every day for 16 days (n=6 mice). Metabolic signal of NAD(P)H has been increased with tumor growth from day 1 to day 9 and dramatically decreased with start of anti-CD47 mAb treatment from day 10. (E,F) Conventional whole-body bioluminescence imaging of 4T1_PB3R-RFP-luc tumor mice verified cancer treatment with increased signal before anti-CD47 therapy and decreased signal after the therapy compared with isotype control treatment (n=6 mice). LMII shows superior sensitivity to detect immunotherapy response (p<0.0001 in C) over bioluminescence imaging (p=0.0122 in F). (G) Flow cytometric analysis shows decrease of NAD(P)H and RFP signals with CD47 inhibitor treatment over isotype control treatment. (H) The signal from NAD(P)H+RFP+ cells was significantly decreased after MIAP301 treatment when compared with isotype control as determined by flow cytometry (n=11 mice, p=0.0043). CD47, cluster of differentiation 47; mAb, monoclonal antibody; NAD(P)H, reduced nicotinamide adenine dinucleotide (phosphate) hydrogen; RFP, red fluorescent protein.
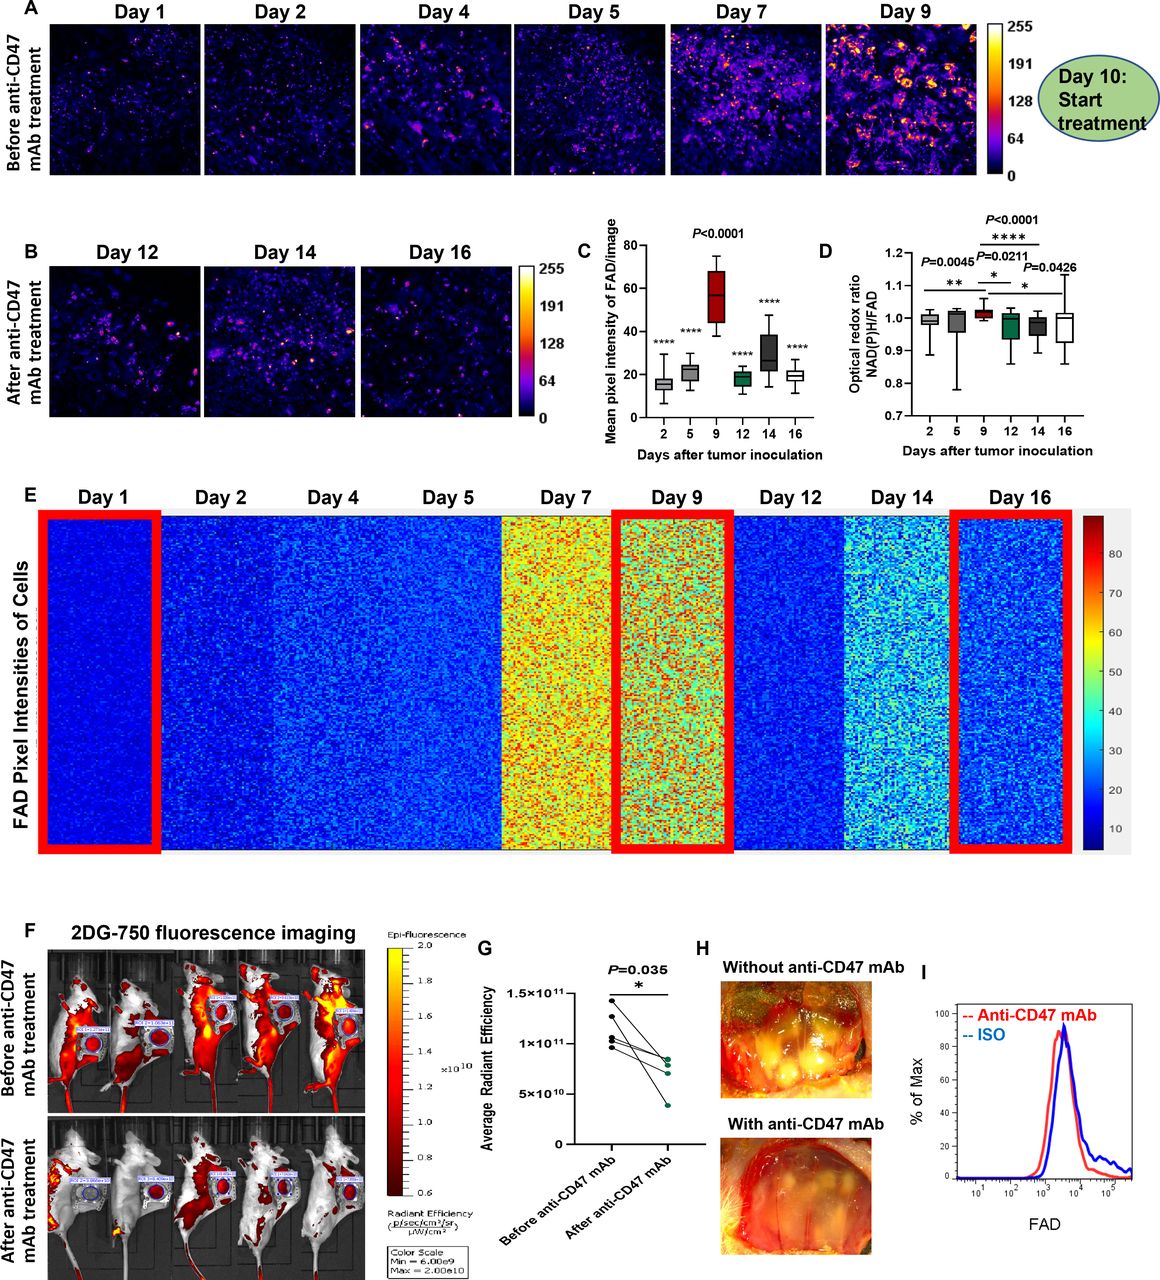
Sensitive monitoring of anti-CD47 therapy response by dynamic metabolic imaging of FAD. (A,B) Label-free metabolic intravital imaging (LMII) of FAD demonstrates similar sensitive early response with NAD(P)H imaging after anti-CD47 mAb (MIAP301) treatment of a triple-negative breast cancer model (10 mg/kg intravenous injection daily for 5 days). (C) Quantification of average intensity shows statistically significant difference in FAD signals before and after MIAP301 treatment (n=16 images, p<0.0001). (D) Optical redox ratio was increased with tumor growth and decreased with anti-CD47 mAb treatment. (E) Kinetics of single-cell metabolism with FAD signal. Each colored small square represents the visible pixel intensity of FAD in each cancer cell. The 10,000-pixel intensities were randomly measured from the cells in different mice every day for 16 days (n=6 mice). Metabolic signal of FAD has been increased with tumor growth from day 1 to day 9 and dramatically decreased with start of anti-CD47 mAb treatment from day 10. (F,G) Conventional whole-body fluorescent glucose imaging with 2-DG 750 verified cancer treatment with significant decrease of glucose uptake after anti-CD47 mAb treatment (n=5 mice). LMII shows superior sensitivity to detect immunotherapy response (p<0.0001 in C) over fluorescent glucose imaging (p=0.035 in G). (H) Visual inspection of treatment effect by color anatomy images. (I) The signal from FAD+ cells was significantly decreased after MIAP301 treatment when compared with isotype control as determined by flow cytometry. 2-DG, 2-DeoxyGlucosone; CD47, cluster of differentiation 47; FAD, flavin adenine dinucleotide; mAb, monoclonal antibody; NAD(P)H, reduced nicotinamide adenine dinucleotide (phosphate) hydrogen.
Evaluation of the efficacy of LMII to gauge differential responses to chemotherapy
Analyses related to anti-CD47 immunotherapy provided a sufficient basis to determine whether NAD(P)H and FAD can be also used as robust metabolic imaging markers for prediction of differential therapeutic responses to chemotherapy and radiotherapy, which remain as primary treatment options for TNBC. Empowered by findings from anti-CD47 immunotherapy study, we further evaluated the response to chemotherapy using our LMII in skinfold models. As expected, the results shown in online supplemental figures 2–7, the LMII data demonstrated that the metabolic signals of NAD(P)H and FAD had increased significantly with time; however, these signals decreased sharply after chemotherapies of PTX (primary treatment option for TNBC in the clinics) and ZA (known as TAM polarization modulating drug) (n=10 images each, p=0.0089 and p=0.0232 for NAD(P)H and FAD average intensity before and after 10 mg/kg bolus IP injection of PTX in the online supplemental figures 4C and 5C, n=11 images each, p<0.0001 for NAD(P)H and FAD average intensity before and after 150 µg/kg IP injection of ZA daily for 5 days in the online supplemental figures 6C and 7C). Similarly, the redox ratio was elevated continuously before day 9 but decreased significantly after chemotherapies (n=10 images, p=0.0371 for day 9 and day 14 for PTX treatment in the online supplemental figure 5D, n=11 images, p=0.0001 for day 9 and day 14 for ZA treatment in the online supplemental figure 7E). The heatmap was used to reveal the single-cell kinetics of NAD(P)H and FAD signals in each cell of skinfold models (n=8 mice for PTX treatment and n=6 mice for ZA treatment, online supplemental figures 4D, 5E, 6D and 7D). To further validate the LMII signals of NAD(P)H and FAD before and after chemotherapy, we additionally performed whole-body bioluminescence imaging of each mouse with tumor growth and PTX treatment. As shown in online supplemental figures 5F,G, we detected a significant signal enhancement from day 2 to day 9 (n=8 mice, p=0.0078); however, the signal decreased significantly after one dose of PTX treatment beginning from day 10 (n=8 mice, p=0.0391). This finding implied that the LMII of NAD(P)H and FAD signals was consistent with the bioluminescence signal in skinfold models before and after chemotherapy. To substantiate these findings, we performed flow cytometry experiments to validate in vivo metabolic imaging data (n=15 mice each, p=0.0007 for NAD(P)H+ RFP+ cells before and after treatment of PTX or ZA, online supplemental figures 4E,F, 5H, 6E–G and 7F). This implies that NAD(P)H and FAD are robust imaging markers that can be used to predict the response to chemotherapy. This finding is considered to corroborate an earlier study33 that used optical metabolic imaging to evaluate the response to chemotherapy in organoids.
Evaluation of the efficacy of LMII to gauge differential responses to radiotherapy
Next, we tested sensitive therapeutic response monitoring capacity of the LMII of NAD(P)H and FAD for radiotherapy. Following local radiotherapy of the skinfold area at a dose of 2 Gy daily for 4 days starting from day 10 after tumor inoculation using MultiRad 255 irradiation equipment, we found that the imaging signal had decreased significantly (online supplemental figures 8A–D and 9A–D), thus demonstrating the monitoring potential of NAD(P)H and FAD imaging to evaluate the response to radiotherapy (n=18 images, p<0.0001 between day 9 and day 16). Subsequently, we showed that the optical redox ratio (NAD(P)H/FAD) increased significantly with tumor growth (p=0.0169 between day 2 and day 9) and decreased significantly after radiotherapy (p=0.0424 between day 9 and day 16) (online supplemental figure 9E). Flow data also validated these in vivo metabolic imaging results (online supplemental figures 8E–G and 9H). A comparative study with conventional whole-body bioluminescence imaging also demonstrated the superior sensitivity of the newly developed LMII technique (p<0.0001 vs p=0.0313 between signals of day 9 and day 16) (online supplemental figure 9G). Collectively, these data indicated NAD(P)H and FAD as promising metabolic markers for response prediction for immunotherapy, chemotherapy, and radiotherapy.
In vivo metabolism of immune-active cells in TME
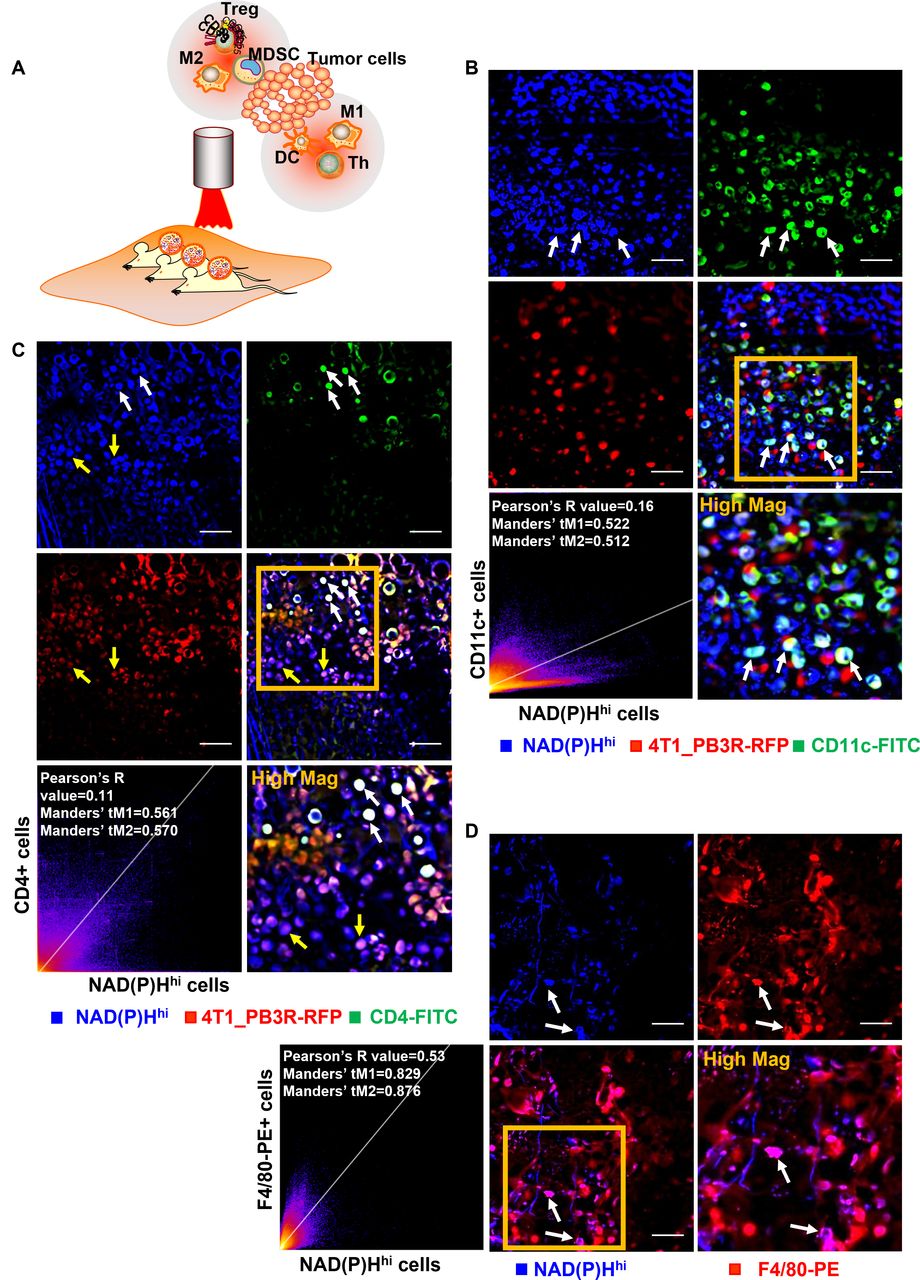
The well-established in vivo metabolic imaging system at single-cell resolution spurred us to explore metabolic signatures of various immune cells particularly between immune-active cells and immunosuppressive cells because identification of such immune environment is essential for success and effective monitoring of innate immunotherapy. Besides confirmed targeting ability of NAD(P)H imaging for majority of cancer cells, we focused on the factor that active glycolysis is also a hallmark of immune active cells. To verify this, the real-time tracking system of five components was prepared using the LMII incorporated by in vivo immunostaining with in situ tumorous injection of fluorescent antibodies: NAD(P)Hhi cells, 4T1_PB3R-RFP+ cells, DCs, Th cells, and macrophages (figure 6A). To identify whether the NAD(P)Hhi population had a phenotype consistent with infiltrating DCs, we used a DC-specific primary FITC-conjugated CD11c antibody and imaged that several cells were both CD11c+ and NAD(P)Hhi (figure 6B and online supplemental video 5). A positive PCC (PCC=0.16) and a high Manders’ coefficient (tM1=0.522 and tM2=0.512) between CD11c and NAD(P)Hhi cells were observed (figure 6B). To further validate the co-localization between NAD(P)Hhi signature and Th cells, we used CD4, an antibody that marks most of the Th cells. We observed that NAD(P)Hhi cells could represent a small portion of Th cells (PCC=0.11, tM1=0.561, and tM2=0.570, white arrows in figure 6C), while a considerable number of NAD(P)Hhi cells are 4T1_PB3R+ RFP+ cells (yellow arrows in figure 6C). We also used the macrophage markers, F4/80 and CD86 and found that many NAD(P)Hhi cells are F4/80 positive (figure 6D, PCC=0.53, tM1=0.829, and tM2=0.876) and CD86 positive (online supplemental figure 10A, PCC=0.24, tM1=0.401, and tM2=0.53). To supplement these findings by systemic labeling, we prepared a panel of fluorescent probes targeted to M1 macrophages using imaging markers of CCR2-FITC34 and MCP1-FITC35 and injected them via bolus tail vein injection. Multiple features are consistent with identifying the NAD(P)Hhi signature as M1 macrophages. NAD(P)Hhi cells were highly phagocytic, consuming FITC-labeled MCP1 or CCR2 injected into the vasculature and are targeted by these two imaging probes for macrophages (online supplemental figures 10B,C and online supplemental videos 6 and 7). Collectively, the 2D histogram analysis (PCC=0.12, tM1=0.545, and tM2=0.548, online supplemental figure 10E) and in vivo images generated using the LMII technique revealed the targeting ability of NAD(P)H imaging predominantly in a small portion of immune-active cells including CD11c-FITC+ DCs, F4/80-AF488+, MCP1-FITC+, CCR2-FITC+ M1 macrophages, and CD4-FITC+ Th cells.
Supplementary video
Supplementary video
Supplementary video

Intravital imaging reveals co-localization of NAD(P)Hhi and immune-active cells in tumor microenvironment. (A) Diagram depicting intravital imaging set-up for visualization of immune-active and immunosuppressive cells in a tumor mouse skinfold chamber. (B) Representative intravital images of NAD(P)Hhi cells (blue), 4T1_PB3R-RFP+ cells (red), and CD11c-FITC+ cells (green). Arrows indicate in vivo co-localization of NAD(P)Hhi cells and CD11c-FITC+ cells. (C) Representative intravital images of NAD(P)Hhi cells (blue), 4T1_PB3R-RFP+ cells (red), and CD4-FITC+ cells (green). White arrows indicate in vivo co-localization of NAD(P)Hhi cells and CD4-FITC+ cells and yellow arrows indicate NAD(P)Hhi RFP+ cells. (D) Representative intravital images of NAD(P)Hhi cells (blue) and F4/80-PE+ cells (red). Arrows indicate in vivo co-localization of NAD(P)Hhi cells and F4/80-PE+ cells. Scales, 20 µm. Quantitative co-localization analysis using Pearson’s coefficient and Manders’ coefficients revealed that a small portion of NAD(P)Hhi cells are targeting various types of immune-active cells including CD11c+ dendritic cells (DCs), CD4+ helper T (Th) cells, and F4/80+ macrophages in triple-negative breast cancer models (scatter plots in B–D). CD4, cluster of differentiation 4; FITC, fluorescein isothiocyanate; NAD(P)H, reduced nicotinamide adenine dinucleotide (phosphate) hydrogen; NAD(P)Hhi, cells high in NAD(P)H intensity; PE, phycoerythrin; RFP, red fluorescent protein; Treg, regulatory T cells; MDSC, myeloid-derived suppressor cells.
In vivo metabolism of immunosuppressive cells in TME
To uncover the metabolic phenotype of immunosuppressive cells, we next investigated the in vivo co-localization of FADhi and immunosuppressive cells using the LMII technique and in vivo immunostaining to track another four components: FADhi cells, 4T1_PB3R-RFP+ cells, Treg cells, and M2 macrophages. As previous studies have shown, the FADhi cells have a phenotype which is consistent with infiltrating macrophages.30 We first used PE-labeled CD206, an antibody that marks most of the M2 macrophages. Notably, there is a high co-localization between FADhi cells and CD206-PE+ M2 macrophages (PCC=0.55, tM1=0.720, and tM2=0.648, figure 7A). We also applied other M2 macrophages’ selective markers, CD301b and CD11b, and observed that some FADhi cells are also CD301b positive (PCC=0.38, tM1=0.566, and tM2=0.517, figure 7B) and CD11b positive (PCC=0.28, tM1=0.468 and tM2=0.359, online supplemental figure 11). We next exploited the use of a mixture with CD4-FITC and CD25-PE antibodies to target Treg cells and found that Treg cells (CD4+ CD25+ cells) were readily distinguishable by their high FAD signature (figure 7C). To further confirm these findings by systemic labeling, we also prepared a panel of fluorescent probes targeted to M2 macrophages using M2 imaging markers (M2pep-TRITC and dextran-AF680).25 It has been reported that M2pep could be used as a promising molecular-targeting probe for M2 TAMs.25 Thus, we made use of TRITC-labeled M2pep and AF680-labeled dextran to further determine whether the FADhi cells are having characteristics of M2 macrophages. Many of the FADhi cells depicted high uptake of dextran-AF680 by tail vein injection (PCC=0.55, tM1=0.369, and tM2=0.478, online supplemental figure 12A). M2pep-TRITC+ cells showed highly specific expression of FAD metabolism (online supplemental figure 12B) and CD206 (online supplemental figure 12D). Meanwhile, the high overlap between F4/80 and CD206 (PCC=0.41, tM1=0.633, and tM2=0.596) as well as F4/80 and dextran (PCC=0.57, tM1=0.657, and tM2=0.596) further validated that CD206-PE and dextran-AF680 could be used for TAMs targeting (online supplemental figure 12E,F). Overall, the 2D histograms and in vivo images generated by the LMII technique and in vivo immunostaining revealed the targeting ability of FAD imaging mainly in a small portion of immunosuppressive cells including CD206-PE+, CD11b-FITC+, CD301b-AF647+ M2 macrophages and CD4-FITC+ CD25-PE+ Treg cells. After IV administration of dextran-AF680 or M2pep-TRITC, the findings further confirmed that the FADhi population represents a portion of M2 macrophages.

Intravital imaging reveals co-localization of FADhi and immunosuppressive cells in tumor microenvironment. (A) Representative intravital images of FADhi cells (blue) and CD206-PE+ cells (red). (B) Representative intravital images of FADhi cells (green) and CD301b-AF647+ cells (red). Scatter plots depicted quantitative co-localization analysis using Pearson’s coefficient and Manders’ coefficients. (C) Representative intravital images of FADhi cells (blue), CD4-FITC+ cells (green), and CD25-PE+ cells (red). Scales, 20 µm. In vivo co-localization analysis shows specific targeting ability of metabolic FAD imaging for various types of immunosuppressive cells including CD206+ or CD301b+ M2 macrophages and CD4+ CD25+ regulatory T cells in triple-negative breast cancer models. AF, Alexa Flour; CD, cluster of differentiation; FAD, flavin adenine dinucleotide; FADhi, cells high in FAD intensity; FITC, fluorescein isothiocyanate; PE, phycoerythrin.
To clarify the impact of identifying tumor-hindering immune effector cells versus tumor-aiding immune suppresser by the aid of the LMII with NAD(P)H and FAD, histological examination was performed using M1 TAM-specific anti-CD86 antibody and M2 TAM-specific anti-CD206 antibody in 4T1 tumor-bearing mice with various treatment regimens (online supplemental figures 13–15). CD47 mAb treatment (online supplemental figure 13) as well as ZA chemotherapy (online supplemental figure 14) and radiotherapy (online supplemental figure 15) modulated TAMs’ polarization showing inhibition of CD206+ immunosuppressive M2 macrophages and elevation of CD86+ immune-active phagocytotic M1 macrophages. Of particular, anti-CD47 therapy data revealed a strong clear separation for immune characteristics between CD47 blockade-treated and isotype control-treated tumors (online supplemental figure 13F) showcasing significant immune modulation by innate immunotherapy thus proving the feasibility of the LMII for sensitive and meaningful monitoring of immunotherapy effect.
Discussion
Breast cancer is the most frequent malignancy in women, affecting 1 in 20 worldwide and maximum 1 in 8 in high-income countries. TNBC especially has the poorest prognosis among breast cancer subtypes with an overall survival of as little as 12–18 months from diagnosis. The poor prognosis and the lack of effective therapies have fostered intensive efforts for investigating potential of immunotherapies particularly because it is known that TNBC outcome is strongly affected by the immune microenvironment. As a result, FDA approved the use of atezolizumab (anti-PD-L1 antibody) in combination with nab-PTX chemotherapy for treatment of TNBC and metastatic breast cancer in March 2019. Significant efficacy of CD47 blockade with combination approach has been also demonstrated in several preclinical studies,36 37 in conjunction with upregulation of CD47 on TNBC cells and enriched TAMs in TNBC together with the need for additional effective treatment options due to low response rate of TNBC with PD-L1 therapy. Although CD47 myeloid checkpoint inhibitor therapy holds great promise to end the ‘dark age’ of TNBC, there is an urgent need to develop potential biomarkers of treatment response in identifying, stratifying, and monitoring patients with TNBC and designing robust clinical trials.
Here, intrigued by the dynamic and sensitive changes of metabolism in cancer and immune cells during tumor progression and treatment, we presented and explored full potential of a novel LMII technique to accurately monitor the response to immunotherapy as a basis for a bedside platform to identify early responders and non-responders for tailored treatment and an industrial platform to provide insight into the robust design of new immunotherapy regimens. We first optimized intravital microscopy techniques using dorsal skinfold chambers to perform longitudinal imaging of the immunotherapeutic response based on two-photon excited autofluorescence signals of NAD(P)H (a metabolite of glycolytic pathway) and FAD (a metabolite of oxidative pathway). In vivo LMII showed a complete overview of tumor growth in murine skinfold models of TNBC with increasing trend of NAD(P)H and FAD signals and optical redox ratio demonstrating highly sensitive single-cell resolution monitoring. By incorporation of in vivo immunostaining into the LMII, we next revealed in vivo action of innate immune checkpoint inhibitor, that is, how anti-CD47 mAb physically interacts with the TME and metabolic components. In vivo accumulation of anti-CD47-AF488 in the NAD(P)Hhi cancer cells and subsequent engulfment of NAD(P)Hhi CD47-AF488+ cancer cells by F4/80-PE macrophages were observed as a rapid but short wave. Such observation not only provides the first in vivo evidence of CD47 blockade-mediated ADCP proving the CD47-SIRPα pathway but also establishes a robust platform for mechanistic studies of drug efficacy and resistance. The feasibility of the developed LMII technique for reliable therapeutic monitoring was well verified with decreasing trend of NAD(P)H and FAD signals and optical redox ratio in the treatment of anti-CD47 mAb of skinfold TNBC models as well as in chemotherapies of PTX and ZA and radiotherapy. Most notably, the LMII showed higher sensitivity (p<0.0001 for NAD(P)H and FAD change) than conventional bioluminescence (p=0.0122) or fluorescent glucose imaging (p=0.035). Together, the first demonstration of early, sensitive, and systemic capture of metabolic contrast changes in response to anti-CD47 immunotherapy was achieved in TNBC by the developed LMII technique. In vivo characterization of metabolic signatures of NAD(P)H and FAD was also thoroughly performed by comprehensive in vivo immunostaining with tumorous injection of various fluorescent antibodies and single-cell resolution LMII. Elevated NAD(P)H metabolism highlighted TNBC cells predominantly and some activated effector immune cells such as phagocytotic M1 TAMs, DCs, and effector T cells revealing high metabolic demands for glycolysis. On the other hand, marked FAD signature pinpointed immunosuppressive pro-tumorigenic cells preferentially relying on OXPHOS such as M2 TAMs and Treg cells. This finding elaborates underlying mechanism of sensitivity and robustness of the LMII with autofluorescence of NAD(P)H and FAD for response monitoring of immunotherapy as well as immune-modulating drugs.
Since the pioneering work of Chance and colleagues,38 there have been intense studies to use naturally fluorescent NAD(P)H and FAD for metabolic biomarkers of different diseases including neurodegenerative diseases, diabetes, cancers, etc.18 However, none of the works investigated full potential for immunotherapy efficacy monitoring particularly in the field of emerging innate immunotherapy. Conversely, the development of fluorescent biosensors targeting NAD(P)H and FAD has attracted a great deal of interest in the recent years using genetically encoded fluorescent sensors or fluorescence resonance energy transfer-based sensors.39 40 Such strategy is limited to preclinical use with no potential for clinical translation due to the need for genetic modification or injection of protein tags. The developed LMII technique and its vigorous validation in the presented study provide, for the first time, a clinical potential for new imaging biomarkers for refining patient selection for innate immunotherapy and monitoring time-course responses continuously in each patient based on sensitive and accurate measurement of metabolic processes without any toxicity. This enables global and dynamic imaging-based assessment of cellular metabolism for therapeutic response compared with invasive and destructive current gold-standard techniques of IHC, flow cytometry, or other in vitro cell lysate assays. The developed technique can also greatly contribute rational design of clinical trials with reliable predictive value as currently numerous clinical trials are underway with focus on combinational approach.
Much work is still ahead to incorporate the developed LMII technique into clinical practice to identify the patients who might benefit most from immunotherapy at early time points. Of importance, developing clinically applicable two-photon metabolic imaging system is in high priority. Although the LMII showcased translational potential for surface weighted tumor imaging such as TNBC, broad clinical application for various tumors could be achieved by development of a large FoV and relatively small-sized two-photon microscope41 or endoscopic system.42 Moreover, more accurate and subtle differentiation of distinct cell populations with diverse metabolic states would be beneficial especially between similarly glycolytic cancer cells and immune-active cells to empower measurement ability of immunity modulation after treatment, providing a highly reliable predictive parameter. For this purpose, novel application of deep learning models will be powerful and it is currently underway in our group to classify immune activation and immunosuppression by deep learning techniques.
Taken together, our study demonstrated the significant clinical potential of the LMII technique based on key cellular metabolism measurement as sensitive monitoring tool of therapeutic response with predictive and prognostic values to select the patients who are most likely to benefit from immunotherapy. The early identification of responders and robust outcome prediction in clinical trials and the clinical management of patients will maximize immunotherapy efficacy, minimize toxicities from ineffective treatment, and reduce the healthcare costs associated with expensive immunotherapy. Ultimately, it may benefit our society by reducing the economic and clinical burden of cancer.
Supplemental material
Data availability statement
Data are available upon reasonable request.
Ethics statements
Patient consent for publication
Ethics approval
This study was approved by the Department of Health of Hong Kong and the Animal Subjects Ethics Sub-committee of the Hong Kong Polytechnic University (ASESC: 20-21/132-HTI-R-GRF) and met the guidelines for animal welfare.
Acknowledgments
We thank Dr Liang-Ting Lin for his generous gift of 4T1_PB3R-RFP-luc cell line and helpful discussions. We thank Dr Kenneth King-yip Cheng and Professor Xiang Zou for helpful discussions. The management of tumor mice with skinfold chambers was provided by the Centralised Animal Facilities of the Hong Kong Polytechnic University (CAF, PolyU). Confocal fluorescent microscopic imaging and flow cytometry were supported by the University Research Facility in Life Sciences of the Hong Kong Polytechnic University (ULS, PolyU).
References
Supplementary materials
Supplementary Data
This web only file has been produced by the BMJ Publishing Group from an electronic file supplied by the author(s) and has not been edited for content.
Footnotes
Twitter @arpan_mahanty
Contributors All authors have made substantial contributions to the completion of this project. Conception and design—JSY. Development of methodology—JSY, MY, AM and CJ. Data acquisition—MY. Data analysis and interpretation—MY, JSY, CJ, ANNW and AM. Writing (original draft preparation)—MY and JSY. Writing (review and editing)—MY, JSY, ANNW, AM and CJ. Study supervision—JSY. Funding acquisition—JSY. All authors have read and agreed to the published version of the manuscript. JSY is responsible for the overall contents as guarantor.
Funding The work described in this paper was fully supported by grants, the Early Career Scheme (Project No. PolyU 25104017) and the General Research Fund (Project No. PolyU 15107118) from the Research Grants Council of the Hong Kong Special Administrative Region, People's Republic of China.
Competing interests None declared.
Provenance and peer review Not commissioned; externally peer reviewed.
Supplemental material This content has been supplied by the author(s). It has not been vetted by BMJ Publishing Group Limited (BMJ) and may not have been peer-reviewed. Any opinions or recommendations discussed are solely those of the author(s) and are not endorsed by BMJ. BMJ disclaims all liability and responsibility arising from any reliance placed on the content. Where the content includes any translated material, BMJ does not warrant the accuracy and reliability of the translations (including but not limited to local regulations, clinical guidelines, terminology, drug names and drug dosages), and is not responsible for any error and/or omissions arising from translation and adaptation or otherwise.