Article Text

Abstract
Background Neoadjuvant chemoimmunotherapy for non-small cell lung cancer (NSCLC) has improved pathological responses and survival rates compared with chemotherapy alone, leading to Food and Drug Administration (FDA) approval of nivolumab plus chemotherapy for resectable stage IB-IIIA NSCLC (AJCC 7th edition) without ALK or EGFR alterations. Unfortunately, a considerable percentage of tumors do not completely respond to therapy, which has been associated with early disease progression. So far, it is impossible to predict these events due to lack of knowledge. In this study, we characterized the gene expression profile of tumor samples to identify new biomarkers and mechanisms behind tumor responses to neoadjuvant chemoimmunotherapy and disease recurrence after surgery.
Methods Tumor bulk RNA sequencing was performed in 16 pretreatment and 36 post-treatment tissue samples from 41 patients with resectable stage IIIA NSCLC treated with neoadjuvant chemoimmunotherapy from NADIM trial. A panel targeting 395 genes related to immunological processes was used. Tumors were classified as complete pathological response (CPR) and non-CPR, based on the total absence of viable tumor cells in tumor bed and lymph nodes tested at surgery. Differential-expressed genes between groups and pathway enrichment analysis were assessed using DESeq2 and gene set enrichment analysis. CIBERSORTx was used to estimate the proportions of immune cell subtypes.
Results CPR tumors had a stronger pre-established immune infiltrate at baseline than non-CPR, characterized by higher levels of IFNG, GZMB, NKG7, and M1 macrophages, all with a significant area under the receiver operating characteristic curve (ROC) >0.9 for CPR prediction. A greater effect of neoadjuvant therapy was also seen in CPR tumors with a reduction of tumor markers and IFNγ signaling after treatment. Additionally, the higher expression of several genes, including AKT1, BST2, OAS3, or CD8B; or higher dendritic cells and neutrophils proportions in post-treatment non-CPR samples, were associated with relapse after surgery. Also, high pretreatment PD-L1 and tumor mutational burden levels influenced the post-treatment immune landscape with the downregulation of proliferation markers and type I interferon signaling molecules in surgery samples.
Conclusions Our results reinforce the differences between CPR and non-CPR responses, describing possible response and relapse immune mechanisms, opening the possibility of therapy personalization of immunotherapy-based regimens in the neoadjuvant setting of NSCLC.
- immunotherapy
- lung neoplasms
- tumor biomarkers
- gene expression profiling
- drug therapy, combination
Data availability statement
Data are available on reasonable request. The datasets supporting this study are available from the corresponding author upon justified demand.
This is an open access article distributed in accordance with the Creative Commons Attribution Non Commercial (CC BY-NC 4.0) license, which permits others to distribute, remix, adapt, build upon this work non-commercially, and license their derivative works on different terms, provided the original work is properly cited, appropriate credit is given, any changes made indicated, and the use is non-commercial. See http://creativecommons.org/licenses/by-nc/4.0/.
Statistics from Altmetric.com
Key messages
Neoadjuvant chemoimmunotherapy for non-small cell lung cancer (NSCLC) has improved clinical outcomes. However, in the context of the recent FDA approval of nivolumab plus chemotherapy combination in this setting, there is a lack of knowledge and biomarkers to identify patients who achieve complete pathologic responses, or to determine patients who are at higher risk of disease recurrence after surgery.
Our study supports that tumors achieving CPR constitute a distinct biological entity, with a different baseline profile and undergoing greater therapy-induced changes than non-CPRs. Our results identify possible key players and mechanisms to achieve complete responses, and reinforce the use of CPR as an endpoint in neoadjuvant clinical trials.
In addition, these differences in gene expression profile could be used as a source for CPR predictive biomarkers, with greater ability to describe the immune landscape and better performance than PD-L1 and TMB, as well as for the identification of patients without CPR at high risk of disease recurrence, which would allow personalization of follow-up and adjuvant treatment in these patients.
Background
Neoadjuvant chemoimmunotherapy introduction in resectable stages of lung cancer has led to improved patient outcomes in terms of pathological responses and showed promising survival rates,1–3 which has led to the recent FDA approval of nivolumab in combination with chemotherapy for resectable stage IB-IIIA non-small cell lung cancer (NSCLC) (American Joint Committee on Cancer, AJCC 7th edition) without ALK or EGFR alterations.4 However, a considerable percentage of tumors do not completely respond to chemoimmunotherapy, which has been associated with early disease progression. Thus, the identification of responder patients, as well as those non-responders at higher risk of disease recurrence, is crucial.
In this sense, several biomarkers related to the tumor immunity cycle have been proposed, ranging from the presence of neoantigens (measured indirectly through tumor mutational burden (TMB)),5 the expression levels of PD-L1 (measured by immunohistochemistry in tumor sections),6 7 to the direct characterization and quantification of immune cells in tissue or blood through: flow cytometry,8 multiple immunofluorescence panels,1 or T cell repertoire analysis (by sequencing of the TCR receptor).9 Additionally, ctDNA levels, as a reflection of the patient’s tumor burden, have been shown to be useful in this context.3 10 11 There are considerable data for metastatic NSCLC and immune monotherapy,12 being data in locally advanced stages more limited, showing contradictory results for the main biomarkers PD-L1 and TMB.11 In this sense, gene expression profiles, considering hundreds of genes, can give a more comprehensive view of the antitumor immune response, overcoming some limitations of established biomarkers.13
In this study, we characterize the gene expression profile of tumor samples from locally advanced resectable NSCLC patients before and after neoadjuvant treatment by bulk RNA-seq, for the discovery of biomarkers associated with complete pathological responses and the identification of patients with non-complete pathological response at high risk of disease progression.
Methods
Study design and patient samples
All patients with available primary tumor tissue sample for molecular determinations from NADIM clinical trial (NCT03081689) were included in this study. In the NADIM trial, patients with resectable stage IIIA NSCLC were treated with three cycles of nivolumab (360 mg) plus chemotherapy, consisting of paclitaxel (200 mg/m2) and carboplatin (area under the curve (AUC) 6; 6 mg/mL per min), before surgical resection. Patients received adjuvant treatment with 240 mg of nivolumab every 2 weeks for 4 months, followed by 480 mg of nivolumab every 4 weeks during the next 8 months. The objective pathological response was assessed by blinded pathology central review which determined the percentage of residual viable tumor in resected primary tumors. Tumors were subsequently classified into two categories according to their pathological response: complete pathological response (CPR) and non-CPR tumors. CPR tumors were those with no viable tumor cells in the resected tumor bed and lymph nodes analyzed, and non-CPR tumors, those who have any percentage of viable tumor cells in the resection specimens.
Fifty-three tumor tissue samples of patients enrolled in NADIM clinical trial were collected and subjected to RNA extraction and sequencing. Fifty-two of 53 samples had a good sequencing quality and were analyzed: 16 of them were obtained at diagnosis and 36 after tumor resection (online supplemental table 1). Eleven of them were paired samples (pretreatment and post-treatment) in which RNA sequencing was done at both timepoints.
Supplemental material
The median follow-up time of the entire cohort at data cut-off was 38.0 months (95% CI 36.7 to 40.7), with a 94% maturity at 36 months. The disease progression status of the patients was determined at 34.2 months, that is, the follow-up time of the patient without disease progression with the shortest follow-up available. Regarding this, patients with tumors with non-complete pathological response (post-treatment non-CPR tumors, n=14) were categorized as patients with disease progression (n=5) or patients with non-disease progression (n=9). Two patients (32 and 35) were excluded from survival analyses and analyses based on progression status since they died from COVID-19 (and both presented no evidence of disease status at the time of death), compromising the identification of disease progression biomarkers. However, they were included in all the other analyses involving the pathological response status, the effect of therapy, and the relevance of PD-L1 and TMB. Details of clinicopathological characteristics of all patients, pathological responses, survival outcomes, sequencing quality parameters, samples and techniques used are summarized in online supplemental table S1.
PD-L1 tumor proportion score and TMB assessment
As previously reported, formalin-fixed paraffin-embedded (FFPE) tumor diagnostic samples were used to assess the tumor mutational burden (TMB) with the Oncomine Tumor Mutation Load Assay (Thermo Fisher Scientific) using an Ion S5 Sequencer (Thermo Fisher Scientific, Palo Alto, California, USA) according to the manufacturer’s instructions. The commercially available PD-L1 immunohistochemistry assay PD-L1 IHC 22C3 pharmDx (Dako, Glostrup, Denmark) was used to assess PD-L1 tumor proportion score (TPS) in FFPE tumor diagnostic samples.1
A cut-off of ≥25% for PD-L1 TPS was used to classify pretreatment tumors into PD-L1-high and PD-L1-low expression, as it showed the best performance to identify complete pathological responses. The median TMB of the entire cohort (5.89 Mut/Mb) was used to classify tumors with TMB-high and TMB-low.1
RNA extraction
Bulk RNA derived from biopsy FFPE samples at diagnosis and surgery specimens were extracted with truXTRAC FFPE DNA kit (Covaris) as per manufacturer’s instructions. RNA quantification was done using the Qubit RNA BR Assay Kit (Thermo Fisher Scientific Cat. No. Q10210) on a Qubit apparatus.
Library construction and sequencing
Only tissue samples derived from primary tumors were sequenced, not considering lymph node-derived samples. Briefly, 10 ng of input RNA was reverse transcribed into cDNA using the SuperScript IV VILO Master Mix (Cat. No. 11756050), and libraries were prepared using the Ion AmpliSeq Library Kit 2.0 (Life Technologies Cat. No. 4475345) and the Oncomine Immune Response Research Assay (Cat. No. A31930) panel that targets 395 genes related to immunological processes (online supplemental table S2). Equal volumes from eight samples at 50 pM were pooled together for sequencing on an Ion 530 Chip. Template preparation was performed using an Ion Chef System (Thermo Fisher Scientific) and Ion 520 and Ion 530 Kit (Thermo Fisher Scientific). Sequencing was performed on an Ion S5 XL Sequencer (Thermo Fisher Scientific). The ImmuneResponse RNA plugin was used to align the sequences to the reference genome (ImmuneResponse_v3.1) and to count the sequencing reads with the Torrent Suite software.
RNA sequencing data analysis
Differential-expressed genes (DEGs) between groups were assessed using the DESeq2 package in R.14 Raw counts data were used as an input for DESeq2 analysis. The cut-off criteria for assessing the DEGs was |log2FC|>1.5 and adjusted p<0.05.
Pathway enrichment analysis was done using gene set enrichment analysis (GSEA).15 16 The input data for GSEA was the output normalized counts from DESeq2. The gene sets used for GSEA analysis were the 35 Oncomine Immune Response gene function annotation sets, described in online supplemental table S2. The difference between this analysis and the one of differential gene expression performed with DESeq2 is that it does not consider genes individually but as a group. Thus, small differences in the expression of a group of genes can give rise to a significant differential expression of the signaling pathway of which they are part, even if they did not differ in their expression individually.
To estimate the proportions of the immune cell subsets present in samples using RNA-seq data, the analytical tool CIBERSORTx was used.17 This tool can accurately determine the immune infiltration of each sample by using a deconvolution algorithm and a signature reference of immune cells (LM22), which can define 22 subtypes of immune cells based on a gene signature matrix of 547 genes. The signature matrix used was the LM22 with 100 permutations with B mode batch correction and with quantile normalization disabled. The input data for CIBERSORTx analysis was the TPM normalization of the RNA-seq data, done by normalizing each gene length with the total read counts. Samples with a CIBERSORTx p value <0.05 were used for the analysis.
Statistical analysis
Heatmaps and PCA plots were done with ggplot2 R package using as an input the variance stabilizing transformation (vsd) normalization extracted with DESeq2 analysis. Volcano plots were depicted with the web app VolcaNoseR18 using as an input the results of the differential expressed genes extracted from DESeq2 analysis. In the differential expression analysis, a multiple testing correction was performed using the Benjamini-Hochberg procedure to reduce the number of false positives. Regarding the GSEA analysis, a false discovery rate (FDR) <5% was considered to identify the significantly upregulated pathways within each group. Non-parametric Mann-Whitney U test was used to analyze differences between CPR and non-CPR tumors and between patients with or without disease progression. Wilcoxon rank-sum test was used for pairwise analysis between pretreatment and post-treatment timepoints. The AUC ROC analysis was used to determine the capability of DEGs and immune cell subsets as predictive biomarkers. Values with the highest likelihood ratio from the ROC curve analysis were used as thresholds to categorize DEGs or immune cell subsets for each sample into high or low groups in the identification of patients at high risk of relapse after surgery. Analysis of progression-free survival (PFS) and overall survival (OS) was done with the Kaplan-Meier curve analysis, comparing groups with the log-rank test. An adjusted p value of <0.05 was considered statistically significant. IBM SPSS software (V.25.0) and GraphPad Prism (V.8.4) were used in the statistical analysis.
Results
Differential immune landscape in pretreatment samples allows prediction of complete pathological responses at surgery
Gene expression levels, using a panel of 395 immune-related genes, were compared between pretreatment samples of patients with CPR (n=9) and non-CPR (n=5) tumors. The unsupervised heatmap based on all genes does not perfectly classify patients with CPR and non-CPR tumors into two distinct groups. However, six out of nine patients with CPR tumors are clustered together, as also seen in the PCA plot (online supplemental figure 1A,B).
Supplemental material
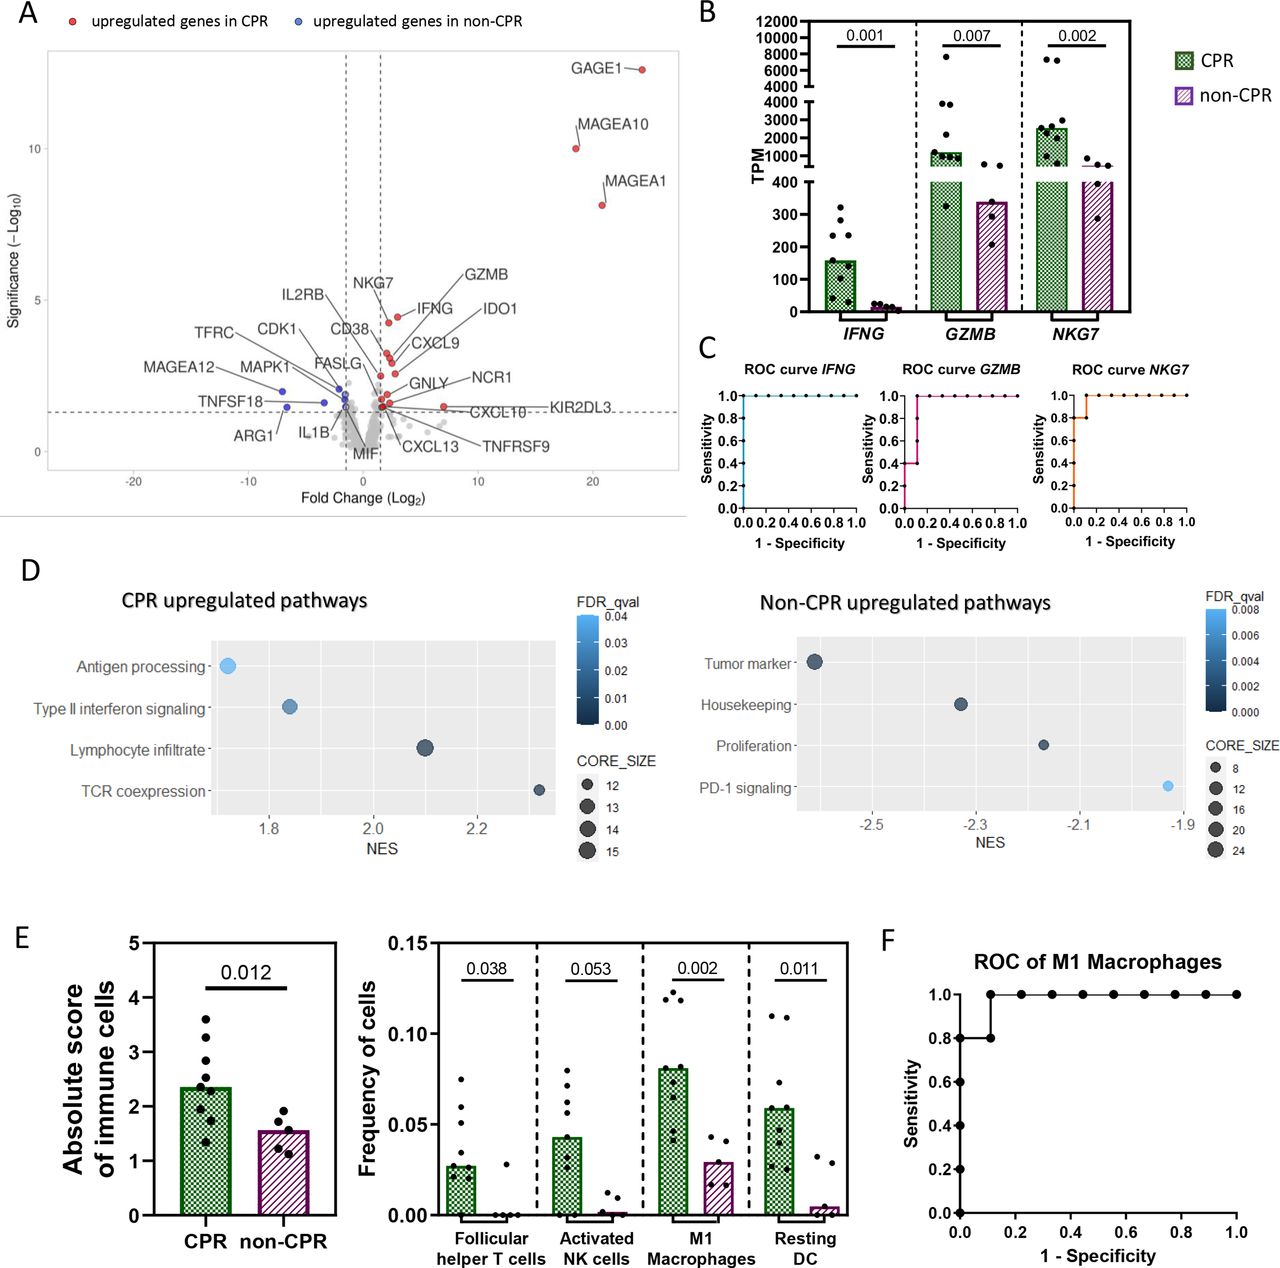
Specifically, 25 DEGs were identified between CPR and non-CPR tumors (online supplemental table S3). Of them, 17 were upregulated and 8 were downregulated in CPR compared with non-CPR tumors (figure 1A). Among the upregulated genes in CPR tumors, some were involved in type II interferon signaling (FASLG, CXCL13, CXCL10, CXCL9 and IFNG); other genes were related to NK cells (NCR1, KIR2DL3 and GNLY); lymphocyte enrichment and activation (NKG7, GZMB, IL2RB, CD38, IDO1 and TNFRSF9 aka 4-1BB); and tumor antigens (MAGEA10, MAGEA1 and GAGE1). Altogether, all these genes depict a proinflammatory phenotype in pretreatment tumor samples of patients with CPR tumors. However, the eight genes upregulated in non-CPR tumors were of diverse functions: the myeloid marker ARG1, the TNF receptor TNFSF18, the housekeeping gene TFRC, the tumor antigen MAGEA12, the proliferation markers MAPK1 and CDK1, and IL1B and MIF involved in type II interferon signaling and innate immune response, respectively (figure 1A).

Differential immune landscape in pretreatment samples. (A) Volcano plot showing DEGs between CPR and non-CPR tumors. Red dots indicate upregulated genes in CPR tumors, while blue dots indicate upregulated genes in non-CPR tumors. (B) Expression levels in TPM of IFNG, GZMB and NKG7. (C) ROC curve for the prediction of complete pathological response using median TPM expression levels of IFNG, GZMB and NKG7, as cut-off. (D) Gene set enrichment analysis for pathological responses. Differentially upregulated pathways in non-CPR (left) and CPR tumors (right). (E) Absolute immune cell score and frequency of each immune cell subtype in CPR and non-CPR tumors determined by CIBERSORTx. P<0.002 was considered statistically significant after Bonferroni’s correction for multiple tests. (F) ROC curve for the prediction of complete pathological response using median proportion of M1 macrophages as cut-off. Each patient is represented by a black symbol. Comparisons were done between CPR (n=9) and non-CPR (n=5) groups. CPR, complete pathological response; DEGs, differential-expressed genes.
Analyzing the individual ability of DEGs at baseline to identify those patients with tumors that achieve CPR at surgery (figure 1B), IFNG stands out, showing an AUC of 1.000 (95% CI 1.000 to 1.000) (p=0.002). An IFNG TPM value higher than 27.08 seems to classify with 100% sensitivity and 100% specificity tumors that will achieve CPR (figure 1C). In addition, GZMB and NKG7, related to cytotoxic activity of T and NK cells, showed an AUC ROC of 0.933 (95% CI 0.793 to 1.000) (p=0.009) and 0.977 (95% CI 0.910 to 1.000) (p=0.004), respectively, when classifying CPR and non-CPR tumors (figure 1C). The complete list of AUC ROC for the remaining genes, including CD38, CXCL9 and IL2RB, which are also implicated in T cell-mediated immune responses, are shown in online supplemental table S4. Among the upregulated genes in non-CPR tumors, CDK1, ARG1 and TNFSF18 showed an AUC of 0.911, 0.888 and 0.866, respectively, when classifying CPR and non-CPR responses (online supplemental table S4).
Functional enrichment analysis with GSEA software was also performed to characterize the upregulated pathways within each pathologic response group, revealing an upregulation of pathways related to TCR coexpression, lymphocyte infiltrate, type II interferon signaling and antigen processing in CPR tumors. In the case of non-CPR tumors, there was an upregulation of tumor markers, housekeeping genes, proliferation and PD-1 signaling pathways (figure 1D).
Finally, the CIBERSORTx algorithm was also used to estimate the relative proportion of immune cell subsets in these tissue samples (online supplemental figure 2A). CPR tumors showed a higher score of total immune cells (p=0.012), as well as a higher proportion of follicular helper CD4+ T cells (p=0.038), activated NK cells (0.053), M1 macrophages (p=0.002) and resting dendritic cells (0.011) than non-CPR patients. However, only the proportion of M1 macrophages was statistically significant after multiple comparisons correction (figure 1E). The AUC ROC for predicting the response in these tumors based on the proportion of M1 macrophages in pretreatment samples was 0.9778 (95% CI 0.910 to 1.045) (p=0.004). A proportion of M1 macrophages higher than 0.04471 showed 100% sensitivity and 88.9% specificity in identifying tumors that will achieve a complete pathological response after immunochemotherapy (figure 1F).
Differential immune landscape between CPR and non-CPR tumors in post-treatment samples
Regarding surgical samples, the unsupervised heatmap considering all genes was unable to classify patients with CPR and non-CPR tumors into two separate groups (online supplemental figure 3A). Similar limitation was found in the PCA (online supplemental figure 3B).
Nevertheless, DEGs between CPR and non-CPR tumors were identified (online supplemental table S5). Twenty-two genes were found to be upregulated in non-CPR tumors, most of them related to proliferation (CDKN3, CCNB2, KIAA0101, MKI67, BUB1, CDK1, TOP2A, FOXM1, MELK, MAD2L1, G6PD and DGAT2) or tumor markers (CDKN2A, KRT5, BRCA1 and TWIST1), among others (MAGEA3, CEACAM1, CXCL8, TNFRSF18, HMBS and ISG15) (figure 2A).

Differential immune landscape in post-treatment samples. (A) Volcano plot showing the DEGs between CPR and non-CPR tumors in post-treatment samples. Red dots indicate upregulated genes in CPR tumors, while blue dots indicate upregulated genes in non-CPR tumors. (B) Expression levels in TPM of CCNB2, CDKN3 and ISG15. (C) ROC curve for the assessment of complete pathological response using the median TPM expression levels of CCNB2, CDKN3 and ISG15 as cut-off. (D) Gene set enrichment analysis for pathological responses. Differentially upregulated pathways in non-CPR and CPR post-treatment tumors. (E) Frequency of follicular helper T cells in tumors determined by CIBERSORTx analysis. P<0.002 was considered statistically significant after Bonferroni’s correction for multiple tests. Each patient is represented by a black symbol. Comparisons were done between CPR (n=22) and non-CPR (n=14) groups. CPR, complete pathological response; DEGs, differential-expressed genes.
Among the DEGs, we performed a comparison of their TPM values between CPR and non-CPR tumors and represented those whose p values were significant after multiple testing correction (p<0.002): the cyclin B2 CCNB2 gene and CDKN3 both involved in the cell cycle, and ISG15 involved in type I interferon signaling (p=0.001, figure 2B). The AUC ROC for distinguishing CPR and non-CPR tumors based on the TPM value of these three genes were 0.821, 0.818 and 0.814, respectively (figure 2C).
Further GSEA analysis in surgical samples from patients with CPR tumors showed an upregulation of pathways related to antigen processing, TCR coexpression and lymphocyte infiltrate, suggesting the presence of a higher immune infiltrate in these tumors. In contrast, non-CPR tumors showed an upregulation of proliferation, tumor marker, interferon signaling, housekeeping and tumor antigen pathways that may be explained by the presence of viable tumor cells in these surgical specimens (figure 2D).
When looking for differences between CPR and non-CPR tumors in the estimated immune cell infiltrate (online supplemental figure 2B), a higher proportion of follicular helper CD4+ T cells in non-CPR tumors was found, though this was not statistically significant after correcting for multiple testing (p=0.025, figure 2E).
Identification of patients at high risk of relapse after surgery
Patients whose tumors do not achieve complete responses are likely at higher risk of relapse. To identify gene expression patterns that may affect long-term outcomes in patients with non-CPR tumors, we have analyzed non-CPR surgery specimens and identified DEGs between tumors of patients with or without disease progression (online supplemental table S6). Ten genes were identified as differentially upregulated in tumors from patients with disease progression: IFI6 and OAS3, both involved in interferon signaling; AKT and KRT7 as tumor markers; BST2, ISG15 and IFI27 involved in type I interferon signaling as well as CD8B, HMBS and OAS1 (figure 3A). Importantly, of these genes associated with disease progression, AKT1, BST2, OAS3, CD8B, IF27 and KRT7, were not associated with the percentage of viable tumor cells in the surgical specimen (online supplemental table S7). Additionally, the expression of these genes, categorized as high and low expression, was further correlated with survival. We have found that higher levels of IFI6 (p=0.010), BST2 (p=0.010), CD8B (p=0.019), OAS3 (p=0.010) and IFI27 (p=0.010) in post-treatment samples of non-CPR tumors were associated with lower progression-free survival (PFS). In addition, higher levels of HMBS (p=0.018) were associated with lower overall survival (OS) (online supplemental figure 4). Of special interest is AKT, in which higher levels in post-treatment samples were associated with both lower PFS and OS (p=0.033 and p=0.003, respectively). The PFS and OS of patients whose tumors expressed low levels of AKT were 80% (95% CI 40.87 to 94.58) and 100% (95% CI not estimable) at 36.0 months, respectively, compared with 25% (95% CI 0.90 to 66.53) in patients with high AKT tumors for both PFS and OS (figure 3B). There were no differentially regulated pathways between patients with or without disease progression.

Immune expression signature associated with disease progression in patients with non-CPR tumors. (A) Volcano plot showing the DEGs between post-treatment tumors from patients with disease progression (n=5) versus no disease progression (n=9). Red dots indicate upregulated genes in tumors from patients with disease progression, while blue dots indicate upregulated genes in tumors from patients with non-disease progression. (B) Kaplan-Meier plots of progression-free survival and overall survival for patients with high (n=4) and low (n=10) expression of AKT (p=0.033 and p=0.003, respectively). (C) Kaplan-Meier plots of progression-free survival and overall survival for patients with high (n=4) and low (n=19) proportion of activated dendritic cells (p=0.019 and p=0.052). (D) Kaplan-Meier plots of progression-free survival and overall survival for patients with high (n=4) and low (n=10) proportion of neutrophils (p=0.033 and p=0.003). CPR, complete pathological response; DEGs, differential-expressed genes.
Regarding the estimated cell proportions, no differences were observed between tumors of patients with or without disease progression (online supplemental figure 2B). However, a higher proportion of activated dendritic cells or neutrophils in non-CPR tumors were associated with lower PFS and OS (figure 3C and D). The PFS and OS at 36.0 months of patients whose tumors had a higher proportion of activated dendritic cells were 25% (95% CI 0.90 to 66.53) and 50% (95% CI 5.79 to 84.48), respectively, compared with 80% (95% CI 40.87 to 94.58) and 85.7% (95% CI 33.40 to 97.84) in those who presented lower levels (p=0.019 for PFS, and p=0.052 for OS). Similarly, PFS and OS at 36.0 months for patients with a higher proportion of estimated neutrophils was 25% (95% CI 0.90 to 66.53) for both parameters; meanwhile, it was 80% (95% CI 40.87 to 94.58) and 100% (95% CI not estimable) for patients with a lower proportion of neutrophils (p=0.033 for PFS and p=0.003 for OS).
Neoadjuvant chemoimmunotherapy induces a stronger immune infiltrate in CPR compared with non-CPR tumors
The unsupervised clustering of all samples (diagnostic samples and resection specimens) seems to clearly group them in two different clusters (online supplemental figure 5A). This can also be seen in the PCA, where two large clusters corresponding to pretreatment and post-treatment samples are easily identified. Interestingly, all the surgery samples that appear in the PCA pretreatment cluster were from non-CPR tumors (online supplemental figure 5B).
Patients with CPR tumors showed differential expression of up to 74 genes between their paired pretreatment and post-treatment tissue samples (online supplemental table S8). Up to 47 genes were found to be downregulated after neoadjuvant chemoimmunotherapy in post-treatment tumor samples of CPR patients: 17 of them were related to proliferation (MAD2L1, CDK1, MKI67, KIAA0101, CDKN3, BUB1, MELK, TOP2A, FOXM1 and CCNB2) and tumor markers (BRCA2, PGF, BRCA1, CDKN2A, TRIM29, KRT5 and TWIST1), while 12 were attributed to the interferon signaling (IFI6, MX1, OAS3, IFIT3, ISG15, TAP1, OAS1, STAT1, CXCL9, IFNG, CXCL10 and CXCL11). Also, IFNG and GZMB were upregulated in pretreatment tumor samples of patients with CPR with respect to their post-treatment counterparts. In addition, the highest reductions belonged to the proinflammatory IL17A (FC=10.58) and IL4 (FC=9.10) genes (figure 4A). Concerning upregulated genes after treatment in CPR tumors, 27 genes were increased with respect to their pretreatment paired samples: some of them reflecting a lymphocyte infiltrate (CCL21, CXCR4, GZMK, CD52, IL7R, LAMP3 and PTPRC), neutrophils (CA4) or macrophages (MRC1, ALOX15B) among others. Of note is the upregulation of genes related to B cells, such as the B cell markers JCHAIN, FCRLA and CD22, and the B cell antigen receptor complex-associated CD79A and CD79B genes (figure 4A).

Changes in the immune landscape during treatment. (A) Volcano plot showing the DEGs between paired post-treatment and pretreatment CPR tumor samples (n=7). Red dots indicate upregulated genes, while blue dots indicate downregulated genes in post-treatment samples. (B) Differentially upregulated (upper panel) and downregulated pathways (lower panel) in post-treatment CPR tumor samples. (C) Frequency of immune cell subtypes obtained with CIBERSORTx analysis in pretreatment and post-treatment timepoints from CPR tumors. (D) Volcano plot showing the DEGs between paired post- and pretreatment non-CPR tumor samples (n=4). Red dots indicate upregulated genes, while blue dots indicate downregulated genes in post-treatment samples. (E) Differentially upregulated pathways in post-treatment non-CPR tumor samples. (F) Frequency of immune cell subtypes in non-CPR tumors and comparison between pretreatment and post-treatment timepoints. CPR, complete pathological response; DEGs, differential-expressed genes.
Further analysis with GSEA software confirmed the downregulation of type I and II interferon signaling, tumor antigen, and proliferation pathways in post-treatment samples of these patients. Moreover, post-treatment samples revealed an upregulation of pathways related to lymphocyte infiltrate, antigen processing and TCR coexpression (figure 4B).
In addition, the CIBERSORTx analysis showed a higher proportion of CD8+ T cells (p=0.018), memory resting CD4+ T cells (p=0.018) and resting dendritic cells (p=0.028); and lower proportions of follicular helper CD4+T cells (p=0.028) and M1 macrophages (p=0.018) in post-treatment samples of CPR patients, showing no differences in the absolute score of immune cells (figure 4C).
Regarding non-CPR tumors, only eight genes were differentially expressed between pretreatment and post-treatment samples (online supplemental table S9). TRIM29, ILI1A, KRT5, MMP9, S100A9 and CD44 were downregulated in post-treatment samples, whereas JCHAIN and DMBT1 were upregulated (figure 4D). GSEA analysis of pathways revealed an upregulation of lymphocyte infiltrate and TCR coexpression pathways in post-treatment samples of non-CPR patients (figure 4E). In contrast with CPR tumors, no differences were seen in the proportions of immune cells subtypes analyzed between pretreatment and post-treatment samples for non-CPR tumors (figure 4F).
Pretreatment PD-L1 and TMB status is not associated with distinct basal immune landscape but impacts it after neoadjuvant treatment
The immune landscape between high and low PD-L1 TPS tumors and between TMB high and low tumors was characterized. Concerning PD-L1 expression, only two differentially expressed genes were found upregulated in PD-L1 high tumors: the tumor antigen GAGE1, and the gene that encodes the PD-L1 protein, CD274 (figure 5A). GSEA analysis showed an upregulation of the TCR coexpression and drug target pathways in high PD-L1 tumors (figure 5B), whereas no differences were seen in the proportions of immune cell subtypes (online supplemental figure 2A). The comparison between TMB high and low tumors revealed an upregulation of the tumor antigens MAGEA1 and MAGEA10 in TMB high tumors (figure 5C), with an upregulation of the lymphocyte infiltrate pathway (figure 5B). The frequency of regulatory T cells seemed to be higher in patients with high TMB, though it was not significant after multiple testing correction (p=0.038, figure 5D).

Immune landscape regarding PD-L1 and TMB status in pretreatment samples. (A) Volcano plot of DEGs in pretreatment samples between PD-L1 high (≥25%, n=9) and PD-L1 low (<25%, n=6) tumors. Red dots indicate upregulated genes, while blue dots indicate downregulated genes in PD-L1 high samples. (B) Differentially upregulated pathways in pretreatment samples of TMB high and PD-L1 high tumors. (C) Volcano plot of DEGs in pretreatment samples between TMB high (≥5.89, n=7) and TMB low (<5.89, n=7) tumors. Red dots indicate upregulated genes, while blue dots indicate downregulated genes in TMB high samples. (D) Frequency of regulatory T cells measured with CIBERSORTx in TMB high compared with TMB low tumors. (E) Volcano plot of DEGs in post-treatment samples whose pretreatment tissue showed PD-L1 high (≥25%, n=11) or PD-L1 low (<25%, n=11) expression. Red dots indicate upregulated genes, while blue dots indicate downregulated genes in PD-L1 high samples. (F) Volcano plot of DEGs in post-treatment samples whose pretreatment tissue had TMB high (≥5.89, n=12) or TMB low (<5.89, n=10). Red dots indicate upregulated genes, while blue dots indicate downregulated genes in TMB high samples. (G) Differentially upregulated pathways in post-treatment samples of pretreatment PD-L1 high tumors. (H) Differentially upregulated pathways in post-treatment samples of pretreatment TMB low tumors. (I) Frequency of follicular helper T cells and M2 macrophages in post-treatment samples of high or low PD-L1 expression at pretreatment. Each patient is represented by a black dot. DEGs, differentially expressed genes; TMB, tumor mutational burden.
We also evaluated how the PD-L1 and TMB status in pretreatment tumor samples influenced the immune landscape during treatment, affecting the gene expression in post-treatment samples. Pretreatment PD-L1 TPS status was associated with the differential expression of 18 genes in post-treatment samples (online supplemental table S10). High pretreatment PD-L1 TPS was associated with downregulation of 17 genes: the proliferation markers CDK1, FOXM1, MKI67, KIAA0101, BUB1, TOP2A, CDKN3, CCNB2 and MELK; the housekeeping genes HMBS and G6PD; the tumor markers CDKN2A, KRT5 and BRCA1; the type I interferon signaling molecules ISG15 and IFI27 and the TNF receptor superfamily member TNFRSF18 (figure 5E). Additionally, GSEA identified the upregulation of the antigen processing pathway and downregulation of proliferation pathways in post-treatment tumor samples with higher PD-L1 status than their pretreatment counterparts (figure 5G). Regarding the estimated cell proportions, post-treatment samples of high PD-L1 expression at pretreatment seem to have lower proportions of follicular helper T cells (p=0.004) and M2 macrophages (p=0.040), though it was not significant after multiple testing correction (figure 5I).
When looking at the influence of baseline TMB status in post-treatment samples, we found that 14 genes were downregulated after chemoimmunotherapy in post-treatment samples whose pretreatment samples had a higher TMB: the proliferation markers FOXM1, TOP2A, BUB1, MKI67 and KIAA0101; the housekeeping genes G6PD and HMBS; the neutrophil marker KREMEN1; the interferon signaling genes OAS3, ISG15 and IFI27; the negative regulator of T cell mediated immune response VTCN1 and the genes involved in the innate immune response LCN2 and S100A8 (figure 5F). Additionally, type I interferon signaling and proliferation pathways were shown to be downregulated in post-treatment samples of high TMB status pretreatment (figure 5H). Finally, no differences were seen in the proportions of immune cell subtypes analyzed (online supplemental figure 2A).
Discussion
Neoadjuvant chemoimmunotherapy has demonstrated safety, antitumor activity, and superiority, in terms of pathological responses and survival, compared with chemotherapy in different phase II and phase III studies.1–3 11 19 These results have defined a new standard of care, leading to a new FDA approval of nivolumab plus chemotherapy for resectable stage IB-IIIA (AJCC 7th edition) without ALK or EGFR alterations. In the new scenario to come, many questions remain to be answered, including: the value of the established biomarkers PD-L1 and TMB, the role of new putative biomarkers, the main mechanisms behind tumor responses, or the personalization of adjuvant therapy based on individual risk of relapse. Specifically, CPRs will be a relevant clinical entity in terms of their number (near 25%–63% with chemoimmunotherapy1 2 19 vs 0%–9.5% with chemotherapy alone20–24) and impact on patient survival.25 However, a considerable percentage of patients (40%–75%) still do not achieve CPR with chemoimmunotherapy, presenting a higher risk of relapse.1–3 Thus, the search for predictive biomarkers of CPR, as well as informed treatment decision for adjuvant therapy are relevant and novel fields in resectable stages of NSCLC.
We herein described that a proinflammatory gene expression profile measured in the pretreatment tissue by RNA sequencing is associated with CPR after neoadjuvant chemoimmunotherapy. Specifically, high levels of IFNG, GZMB, and NKG7 as well as the high estimated frequency of M1 macrophages could potentially outperform PD-L1 or TMB regarding CPR prediction.1 9 Reinforcing these results, we have previously shown that CPR patients exhibited a stronger pre-established immune response before treatment in both tissue and blood. Indeed, a higher TCR repertoire clonality in pretreatment tumor tissue, reflecting higher tumor immunogenicity, was associated with CPR.9 Additionally, this was also mirrored in blood, being CPR patients characterized by a higher baseline cytotoxic profile, with lower levels of inhibitory cytokines and cells.8 The role of IFNγ in antitumoral response has been exhaustively reviewed previously. This cytokine is produced by dendritic cells, helper and cytotoxic T cells and NK cells. Its signaling increases the expression of MHC class molecules, enhancing antigen presentation; activates NK, T, and dendritic cells; and switches tumor-associated macrophages to M1 macrophages, promoting tumor elimination.26 27 A higher IFNγ signature has been shown to be associated with improved best overall response and PFS after immunotherapy in advanced stages of melanoma, head and neck carcinoma and gastric cancer patients,28 29 but it has not been fully demonstrated in NSCLC.30 31 Our results suggest that an IFNγ signature in pretreatment tissue, characterized by higher differential expression of the interferon-responsive genes IFNG, GZMB, NKG7, IDO1, CXCL9, and CXCL10, could distinguish patients whose tumors will achieve CPR after neoadjuvant chemoimmunotherapy. We hypothesize that an immune response was previously orchestrated in pretreatment samples, where high levels of CXCL9 and CXCL10 regulate immune cell infiltration and activation and NKG7 and GZMB induce degranulation and target cell apoptosis in CTL and NK cells.32 Unfortunately, the lower number of events in our cohort of patients limited the survival analysis with the IFNG expression signature.
This established pretreatment immune response, which seems to be associated with pathological responses to neoadjuvant chemoimmunotherapy, was poorly reflected by PD-L1 or TMB levels. In this sense, only CD274 (PD-L1), GAGE1, and MAGEA1 genes were differentially expressed between tumors with high or low PD-L1 or TMB, reinforcing the limitation of these markers in predicting responses. Moreover, CD274 was not differentially expressed between CPR and non-CPR tumors. However, it appears that the pretreatment levels of PD-L1 and TMB influence more the composition of the immune landscape after treatment than before treatment. In this regard, high pretreatment PD-L1 TPS or TMB led to a higher expression of antigen processing genes or type I interferon signaling but lower expression of proliferation markers in post-treatment samples. Pathways probably associated with a better neoadjuvant response, as we have already seen in the CPR versus non-CPR comparison.
Regarding post-treatment tissue samples, we found that non-CPR tumors had upregulation of genes related to proliferation and tumor marker genes in comparison with CPR tumors, which is consistent with the presence of viable tumor cells in these surgical specimens. Conversely, CPR tumors showed upregulation of antigen processing, TCR coexpression and lymphocyte infiltration pathways, supporting that platinum-based chemotherapy allows a proficient antitumoral immune response in combination with anti-PD1 immunotherapy. Similar results were recently published using a smaller subset of 21 cases from NADIM trial through a more comprehensive gene panel, in which tumors achieving major pathological response after chemoimmunotherapy had higher numbers of CD8+ T cells and genes related to innate immune response, as well as an upregulation of genes related to DNA replication and cell cycle in incomplete pathological response tumors.13 Moreover, increased abundance of B and plasma cells, as well as, CD4+ and CD8+ T cells were found in post-treatment chemoimmunotherapy tumors compared with treatment-naïve or neoadjuvant chemotherapy-treated tumors.13 However, opposite results have been described in bladder cancer, with negative chemoimmunotherapy phase III trials, supported by studies in animals models showing that platinum-based chemotherapy diminishes CD8+ T cell tumor infiltration and constrains their antitumoral activity.33
It is important to identify the patients that will benefit the most from chemoimmunotherapy achieving complete pathological responses and patients with non-CPR tumors that present a higher risk of relapse after surgery. In this regard, we found for the first time a relationship between higher levels of AKT1 in post-treatment tumor samples and a higher risk of progression and death. Remarkably, AKT1 levels were not associated with percentage of residual viable tumor cells, reinforcing its role beyond tumor marker gene with implications in resistance to chemoimmunotherapy. This gene functions as a regulator of cell proliferation and survival, and it could be promoting tumor growth regardless of the antitumoral immune response. An alteration in the PI3K-AKT-mTOR pathway was also found in NSCLC patients with disease progression on EGFR-TKI therapy.34 Also, high numbers of neutrophils in post-treatment tumor samples seem to be associated with lower progression-free and overall survival in our cohort of patients. This could be explained by the presence of neutrophil extracellular traps known to be involved in tumor metastasis,35 36 and present in tumor tissue of lung cancer patients.37 38
Importantly, by characterizing the expression levels of the primary tumor, we were able to predict relapses at the systemic level. This supports that the possible ongoing micrometastases, which are frequent at this tumor stage, respond similarly enough to what occurs in the primary tumor, reinforcing the value of the surgical specimens as a valid source for the personalization of adjuvant therapy.
The greatest changes in the immune expression profile during neoadjuvant treatment were observed in CPR tumors reflecting a stronger immune response. Tumor and proliferation markers, as well as genes involved in the IFNγ signaling pathway, appear to be downregulated at post-treatment as compared with their pretreatment counterparts, reflecting tumor resolution in CPR patients. The downregulation of proliferation and tumor markers and IFNγ signaling in post-treatment samples of CPR tumors is contrasted with the upregulation of lymphocyte infiltration, antigen processing, and B cell markers, possibly reflecting a reduction of tumor cells with an evolution to a more mature immune response in which the B cells may acquire a greater role, with a drop in the proportion of M1 macrophages and follicular T cells. This seems to be consistent with previous studies from our group, in which we found lymphoid aggregates, compatible with tertiary lymphoid structures (TLSs), present in post-treatment samples of CPR tumors, though we had no markers to characterize them.1 Additionally, the presence of TLS and B cell infiltration has been associated with immune checkpoint blockade response in different solid tumors.39–41 Moreover, the presence of these TLSs seems to generate a protective immunity in NSCLC patients,42–44 and it is characteristic of the regression tumor bed in resected NSCLC patients treated with neoadjuvant immunotherapy.41 Nonetheless, we did not see a higher estimated relative proportion of B cells in post-treatment samples of CPR patients, but a higher estimated proportion of CD8+ T cells and CD4+ memory resting T cells, suggesting a protective immunity against the tumor. This also matches with the hypothetical role of TLS in sustaining an immune-responsive microenvironment, proposed by other authors, because of their association with CD8+ T cells infiltration.40 Concerning our samples, it would be of interest to study these lymphoid aggregates to determine if they are actually TLS and the role exerted in the response to chemoimmunotherapy. However, there were few differences between paired tumor samples of non-CPR patients that denotes ineffective immune stimulation after treatment. Similarly, no estimated cell changes were observed between pretreatment and post-treatment samples, indicating a calmer scenario in non-CPR tumors.
Conclusions
In this study, we performed RNA sequencing in pretreatment and post-treatment tissue samples of patients with resectable stage IIIA NSCLC treated with neoadjuvant chemoimmunotherapy from the NADIM trial using a panel of 395 genes related to immunological processes.
Limitations of the study include: the reduced number of cases that impedes the analysis of specific mutations; the reduced number of events to study the prognostic value of pretreatment IFNγ signature, and the lack of immunotherapy or chemotherapy cohorts to determine the prognostic or predictive value of described biomarkers. However, to date, this is the largest RNAseq effort in chemoimmunotherapy samples from neoadjuvant NSCLC patients.
We conducted various in-depth analyses, using well-established software packages, revealing key differences in the biology of complete pathological responses, including a pre-established immune infiltrate at baseline (which could be used as a source for response biomarkers) and a reduction of tumor markers and IFNγ signaling after neoadjuvant treatment (showing a greater impact of treatment on gene expression compared with non-CPR). We also identify genes and estimated cell populations associated with increased risk of progression in non-complete pathological responders. Finally, we describe that the pretreatment PD-L1 and TMB levels are poorly associated with distinct basal immune landscape but impact it considerably more after chemoimmunotherapy. Our results confirm mechanistic differences between CPR and non-CPR responses and open the possibility of personalization of immunotherapy-based regimens in the neoadjuvant setting.
Data availability statement
Data are available on reasonable request. The datasets supporting this study are available from the corresponding author upon justified demand.
Ethics statements
Patient consent for publication
Ethics approval
Informed consent for the collection of research samples and study protocol were approved by the clinical research ethics committee of Hospital Puerta de Hierro (ref. 20.16) and the Spanish Lung Cancer Group (SLCG) Board (ref. N/A) in accordance with the International Conference on Harmonization Guidelines on Good Clinical Practice and the Declaration of Helsinki. Participants gave informed consent to participate in the study before taking part.
Acknowledgments
We would like to thank the patients, their families, all the participating clinical teams, and all the Spanish Lung Cancer Group, BMS and ThermoFisher staff, for making this study possible.
References
Supplementary materials
Supplementary Data
This web only file has been produced by the BMJ Publishing Group from an electronic file supplied by the author(s) and has not been edited for content.
Footnotes
Twitter @casarrubiosmc, @mlazqui, @margamajem, @AlxMtzMarti, @LiquidBiopsyLab, @CruzAPhD
Contributors AC-B and MP conceived and design the study. MP, EN, AI, MdRG-C, ML-Q, MD, MM, DR-A, AM-M, JDCC, MCo, GLV, EDB, RB, NV, IBA, BM, and VC recruited and treated patients. MCa, BS-R, CM-T, IF-M, RS-B, and AC-B carried out the experiments and analyzed the data. MCa, MP, BS-R, CM-T, IF-M, RS-B, AR, and AC-B interpreted the data. All the authors have read and contributed to the final version of the manuscript and approve its submission for publication. AC-B is the guarantor of this study.
Funding Work in the authors’ laboratories was supported by '‘Instituto de Salud Carlos III’' (ISCIII) PI19/01652 grant cofunded by European Regional Development Fund (ERDF), Bristol-Myers Squibb (BMS), Ministry of Science and Innovation RTC2017-6502-1 'INmunoSIGHT', RTC2019-007359-1 'BLI-O' and European Union’s Horizon 2020 research and innovation programme, CLARIFY 875160 grant, to MP. ThermoFisher provided reagents for RNA sequencing. AC-B received a Spanish Lung Cancer Group (SLCG) grant and is supported by a ISCIII-“Sara Borrell” contract CD19/00170. MCa is supported by PEJD-2019-PRE/BMD-17006 contract granted to AC-B.
Competing interests MP reports non-financial support (reagents for TCR sequencing) from ThermoFisher; grants, personal fees and non-financial support from BMS; grants, personal fees and non-financial support from ROCHE; grants, personal fees and non-financial support from ASTRAZENECA; personal fees from MSD; personal fees from TAKEDA; outside the submitted work. EN grants or contracts: Roche, Pfizer, Merck-Serono, BMS, and Nanostring. Consulting fees: Roche, BMS, MSD, Merck-Serono, Pfizer, Lilly, Amgen, Boehringer, AstraZeneca, Takeda, Bayer, and Sanofi. Payment honoraria: Roche, BMs, MSD, Merck-Serono, Pfizer, Lilly, Amgen, Boehringer, Astrazeneca, Takeda, Bayer, and Sanofi. Support For attending meetings and travel: MSD, Roche, and BMS. AI consulting fees: Pfizer, Amgen, and AstraZeneca. Payment for expert testimony: Bristol, Pfizer, Takeda, Roche, and AstraZeneca. Support for attending meetings or travels: Roche and Bristol. MRG-C reports personal fees from BMS, personal fees from MSD, personal fees from Roche, personal fees from Pfizer, personal fees from AstraZeneca, outside the submitted work; ML-Q: payment for honoraria: BMS, MSD, Ipsen, Astella, AstraZeneca, and Pfizer. Support for attendings meetings/travels: MSD, Takeda, Janssen, Pfizer, and BMS. MD reports personal fees from Astra-Zeneca, personal fees from BMS, personal fees from Boehringer Ingelheim, personal fees from MSD, personal fees from Pfizer, personal fees from Roche, outside the submitted work; MM reports grants and personal fees from BMS, personal fees and non-financial support from MSD, personal fees and non-financial support from Boehringer Ingelheim; personal fees, non-financial support, and other from AstraZeneca; personal fees, non-financial support, and other from Roche; personal fees from Kyowa Kyrin; personal fees from Pierre Fabre, outside the submitted work; DR-A: consulting fees: Roche, AstraZeneca, BMS, MSD, Lilly, Pfizer, and Novartis. Payment for honoraria: Roche, Astrazeneca, BMS, MSD, Lilly, Pfizer, and Novartis. Support for attending meetings/travels: Roche, MSD, and Novartis; AM-M: advisory board: AstraZeneca, BMS, Roche, MSD, and Pfizer. Speaker's bureau: AstraZeneca, BMS, Roche, MSD, and Pfizer. Support for attending meetings or travel: AstraZeneca, BMS, Roche, MSD, Pfizer, and Lilly. Payment for expert testimony: AstraZeneca. Steering committee member: AstraZeneca. JDCC reports personal fees from Astra Zeneca, personal fees from Boehringer Ingelheim, personal fees from Merck Sharp and Dohme, personal fees from Hoffmann-la Roche, personal fees from Bristol-Myers Squibb, personal fees from Takeda, personal fees from Pfizer, personal fees from Novartis, outside the submitted work; IBA reports consulting or advisory board for Bristol Myers, Takeda, Roche, AstraZeneca, and Behringer Inngelheim; BM reports grants and personal fees from Roche, personal fees and other from BMS, personal fees from Takeda, other from MSD, personal fees from Boehringer, other from Takeda, outside the submitted work; AR: consulting fees: AstraZeneca. Payment or honoraria: Vivo diagnóstico. Advisory board: Takeda. VC: payment or honoraria: Roche, BMS, MSD, AstraZeneca, and Boehringer.
Provenance and peer review Not commissioned; externally peer reviewed.
Supplemental material This content has been supplied by the author(s). It has not been vetted by BMJ Publishing Group Limited (BMJ) and may not have been peer-reviewed. Any opinions or recommendations discussed are solely those of the author(s) and are not endorsed by BMJ. BMJ disclaims all liability and responsibility arising from any reliance placed on the content. Where the content includes any translated material, BMJ does not warrant the accuracy and reliability of the translations (including but not limited to local regulations, clinical guidelines, terminology, drug names and drug dosages), and is not responsible for any error and/or omissions arising from translation and adaptation or otherwise.