Article Text

Abstract
Background Groundbreaking studies have linked the gut microbiome with immune homeostasis and antitumor immune responses. Mounting evidence has also demonstrated an intratumoral microbiome, including in soft tissue sarcomas (STS), although detailed characterization of the STS intratumoral microbiome is limited. We sought to characterize the intratumoral microbiome in patients with STS undergoing preoperative radiotherapy and surgery, hypothesizing the presence of a distinct intratumoral microbiome with potentially clinically significant microbial signatures.
Methods We prospectively obtained tumor and stool samples from adult patients with non-metastatic STS using a strict sterile collection protocol to minimize contamination. Metagenomic classification was used to estimate abundance using genus and species taxonomic levels across all classified organisms, and data were analyzed with respect to clinicopathologic factors.
Results Fifteen patients were enrolled. Most tumors were located at an extremity (67%) and were histologic grade 3 (87%). 40% were well-differentiated/dedifferentiated liposarcoma histology. With a median follow-up of 24 months, 4 (27%) patients developed metastases, and 3 (20%) died. Despite overwhelming human DNA (>99%) intratumorally, we detected a small but consistent proportion of bacterial DNA (0.02–0.03%) in all tumors, including Proteobacteria, Bacteroidetes, and Firmicutes, as well as viral species. In the tumor microenvironment, we observed a strong positive correlation between viral relative abundance and natural killer (NK) infiltration, and higher NK infiltration was associated with superior metastasis-free and overall survival by immunohistochemical, flow cytometry, and multiplex immunofluorescence analyses.
Conclusions We prospectively demonstrate the presence of a distinct and measurable intratumoral microbiome in patients with STS at multiple time points. Our data suggest that the STS tumor microbiome has prognostic significance with viral relative abundance associated with NK infiltration and oncologic outcome. Additional studies are warranted to further assess the clinical impact of these findings.
- sarcoma
- immunomodulation
- immunotherapy
- programmed cell death 1 receptor
- tumor biomarkers
Data availability statement
Data are available upon reasonable request.
This is an open access article distributed in accordance with the Creative Commons Attribution Non Commercial (CC BY-NC 4.0) license, which permits others to distribute, remix, adapt, build upon this work non-commercially, and license their derivative works on different terms, provided the original work is properly cited, appropriate credit is given, any changes made indicated, and the use is non-commercial. See http://creativecommons.org/licenses/by-nc/4.0/.
Statistics from Altmetric.com
WHAT IS ALREADY KNOWN ON THIS TOPIC
Mounting evidence demonstrates the existence of an intratumoral microbiome across several cancer types and has linked the gut and intratumoral microbiomes with cancer progression and immunotherapy responses. However, detailed characterization of the specific links between commensal kingdoms, phyla, and species with immune phenotype and function, such as intratumoral viruses and natural killer (NK) infiltration has not been reported.
WHAT THIS STUDY ADDS
This study characterizes for the first time the intratumoral soft tissue sarcoma (STS) microbiome across a prospective cohort using a strict sterile collection protocol. We identified a distinct and measurable intratumoral microbiome in patients with STS that was reproducible across multiple time points. The intratumoral viral microbiome appears to correlate with higher NK cell infiltration and superior metastasis-free and overall survival.
HOW THIS STUDY MIGHT AFFECT RESEARCH, PRACTICE OR POLICY
These data demonstrate the presence of a measurable intratumoral microbiome in STS with evidence of prognostic significance at the level of the viral-NK axis. These findings suggest novel lines of inquiry in the paradigm-shifting concept that cancer, the microbiome, and the host immune system interact and shape one another.
Background
The notion that cancer, the microbiome, and the host immune system interact and shape one another is a paradigm-shifting concept in oncology, and microbiome-immune system interactions are now appreciated to play a fundamental role in shaping antitumor immune responses.1–6 Recent discoveries have demonstrated that the microbiome plays a role in the development and progression of some cancers and that gut microbiome composition impacts the therapeutic efficacy of immune checkpoint-blockade therapy (eg, anti-programmed cell death protein-1/programmed death ligand-1 (PD-1/PD-L1)).7–9 For example, Routy et al demonstrated that the use of broad-spectrum antibiotics reversed the benefit of immune checkpoint inhibitors (ICIs) in mice with advanced cancers and that fecal microbiota transplantation (FMT) from human ICI responders to germ-free or antibiotic-treated mice improved the antitumor effects of PD-1 blockade in preclinical studies.8 Similarly, recent clinical studies demonstrated remarkable findings among patients with advanced melanoma, where FMT from patients who responded to ICI therapy to non-responders induced rapid changes to the gut microbiome including reversal of resistance to ICI therapy.4 6
Mounting evidence also demonstrates the existence of an intratumoral microbiome across several cancer types including breast, lung, pancreas, and melanoma.10–13 Importantly, these tissues have anatomic connections with the outside world, and the question of whether there exists an intratumoral microbiome in soft tissue sarcomas (STS), a presumed ‘sterile’ tissue, has not yet been explored in depth, despite evidence showing microbial presence in multiple solid cancers with tumor-specific predilections.12
Although studies linking the microbiome with cancer progression and immunotherapy response have been groundbreaking, contamination and false positive results remain an important caveat in the planning and interpretation of microbiome studies, especially in low biomass tissues like the placenta, solid organs, and tumors.14–16 For example, Aagaard et al used 16S ribosomal RNA gene PCR and whole genome shotgun sequencing to characterize a unique placental microbiome composed primarily of non-pathogenic commensal microbiota, concluding that the placental microbiota appeared most similar to the non-pregnant human oral microbiome.17 However, when a similar study was replicated by Kuperman et al using bacterial cultures and 16S ribosomal RNA gene amplification, all samples and controls were negative.18 This key follow-up study concluded that the original findings represented contamination during collection or processing, and challenged the evidence suggesting existence of a distinct placental microbiome. Additionally, Salter et al demonstrated that DNA extraction kit reagents and laboratory equipment may be contaminated with bacterial DNA, especially taxa frequently associated with water and soil environments.19 The authors emphasized that the risk of contamination is ubiquitous in both 16S ribosomal RNA and whole genome shotgun sequencing, and contamination can critically impact results in low biomass samples, underscoring the importance of reporting DNA quantification of samples and the sequencing of negative or ‘kitome’ controls in sequence-based publications.
The interplay of the tumor microenvironment (TME) with the host immune system and intratumoral microbiome is complex and yet to be fully elucidated. However, natural killer (NK) cells, which are critical effectors of the innate immune system, can target both tumorigenic and virally infected cells without prior antigen sensitization, demonstrating an important link given that human NK cells are expanded and stimulated to traffic to tissues in response to viral infections.20 21 Moreover, during the initial stages of viral infection, NK cells are activated by the cytokines type I interferons, interleukin (IL)-12, IL-15 and IL-18.22 NK cell infiltration has been associated with favorable prognosis in multiple solid tumors, although the overall extent NK cell infiltration tends to be low,23 24 but no studies, to our knowledge, have characterized the role of the intratumoral viral microbiome in solid tumors, including STS, nor its association with intratumoral NK cells.
To address these knowledge gaps, we sought to evaluate the intratumoral microbiome in patients with non-metastatic STS undergoing neoadjuvant radiotherapy (RT) and surgery. To perform the highest quality analysis, we performed strict sterile biopsy of all tumor specimens in addition to collecting hard surface and skin controls that could account for possible areas of contamination in our workflow. Herein, we identify a distinct intratumoral microbiome, specifically an intratumoral viral microbiome, which correlates with greater NK cell intratumoral infiltration and better prognosis, highlighting a novel potential area to therapeutically target in typically immunotherapy resistant STS.
Methods
Patient screening and enrollment
Eligible patients were diagnosed with locally advanced, non-metastatic STS for which neoadjuvant RT was recommended prior to surgical resection.25 A separate retrospective STS cohort was analyzed under UC Davis IRB (online supplemental tables and figures). The IRB-approved protocols are included in online supplemental materials.
Supplemental material
Supplemental material
Fecal collection for microbiome analysis
Stool samples were obtained at diagnosis prior to neoadjuvant RT and after RT prior to surgical resection. Participants were instructed in proper collection technique and obtained their own samples using a commercially available fecal collection kit (OMNIgene Gut OMR-200, DNAGenotek, Ontario, Canada).
Tumor collection for microbiome analysis
STS tumor samples were obtained at biopsy and resection using sterile gloves, autoclaved surgical supplies, and an 18-gauge core biopsy instrument. In addition, permission was obtained from the UC Davis Department of Pathology for the study investigators to obtain specimens under sterile conditions prior to transferring the tissue for pathologic evaluation. To ensure adequate sampling for sequencing analysis and evaluation of DNA content, ~100 mg of tissue (four to five core needle biopsy specimens) was standardly collected. Tissue specimens were transferred via sterile forceps to sterilized collection vials, cryopreserved in liquid nitrogen, then stored at −80°C until DNA extraction.
Control specimens
To better understand possible patterns of contamination in our specimens, we sampled surfaces for sequencing analysis that potentially interacted with our specimen acquisition workflow. Additionally, we sampled the skin microbiome of selected patients at three time points: before application of chlorhexidine gluconate surgical prep, after application of surgical prep, and immediately prior to closure of the surgical wound. These controls were collected using commercially available collection kits intended for microbiome profiling from skin or other dry surfaces (OMNIgene SKIN OMR-140, DNAGenotek, Ontario, Canada).
Clinicopathologic data
Standard clinical, pathologic, and treatment data were collected and analyzed with respect to metastasis formation and death as the main outcome variables.26 27 Follow-up was counted from the date of diagnosis until the date of death or date of last follow-up. Freedom from recurrence was counted from the date of resection.
DNA extraction and sequencing
DNA was isolated from all specimens using QIAGEN QIAamp PowerFecal Pro DNA kits. DNA quality and quantity were assessed using NanoDrop spectrophotometry (Thermo Scientific, Wilmington, Delaware, USA). Libraries were sequenced for 300 bp paired-end reads using the Illumina NovaSeq V.274 platform. Image analysis, base calling, and quality checking were performed with the Illumina data analysis pipeline RTA V.3.3.5 and bcl2fastq V.2.20.
Metagenome quality control and preprocessing
The raw read data were filtered using HTStream (V.1.3.3), which included screening for contaminants (such as PhiX), removal of PCR duplicated reads, quality-based trimming, and adapter trimming.28 Metagenomic classification of the processed reads was accomplished using Kraken 2 (V.2.1.1).29 Bracken (V.2.5) was used to estimate abundance using the genus and species taxonomic levels across all classified organisms.30 Detailed reporting of the number read fragments, number of base pairs, and read coverage by sample type are shown in online supplemental table 1. Among all samples, the mean number of read fragments was 28,323,921 (range 79,513,844), the mean number of base pairs was 8,553,824,089 (range 24,013,180,888), and the mean read coverage was 2.61× (range 7.34×).
Flow cytometry
Blood and tumor samples were processed for flow cytometry as described previously.25 31 32 Cells were stained with the following fluorochrome-conjugated monoclonal antibodies: CD3-FITC (clone HIT3a, BioLegend), CD56-PE (clone HCD56, BioLegend), and CD45-BV510 (clone HI30, BioLegend). Live/dead staining was performed using Fixable Viability Dye 780 (eBioscience #65-0865-14). Flow cytometry results were acquired using a BD LSRFortessa flow cytometer (Becton Dickinson, San Jose, California, USA) and analyzed using FlowJo Software (Becton Dickinson, San Jose, California, USA).
Immunohistochemistry and immunofluorescence
Formalin-fixed, paraffin-embedded slides were stained for NKp46 (rabbit anti-human NKp46, Abcam, clone EPR22403-57), CD57 (mouse anti-human CD57, Thermo Scientific, clone NK1), and CD94 (rabbit anti-human CD94, Abcam, clone EPR21003) expression. Immunofluorescence (IF) was evaluated using NKp46 and 4′,6-diamidino-2-phenylindole (DAPI). Immunohistochemical expression was scored by a blinded pathologist (MD) as described previously.25 IF staining was performed using Opal fluorophores and counterstained with Spectral DAPI (Akoya Biosciences). The Ventana Discovery Ultra system was used for image acquisition, and data analysis was performed as described previously.33
Statistical analysis
Filtering and preprocessing of metagenomics data were conducted using the Bioconductor package phyloseq, V.1.34.0.34 Differential abundance analyses were conducted using the Bioconductor package limma (V.3.46.0) on TMM-normalized, log transformed taxon counts with Benjamini-Hochberg adjustment of p values.35 36 Additional details are shown in online supplemental methods.
Results
STS harbors a quantifiable intratumoral microbiome
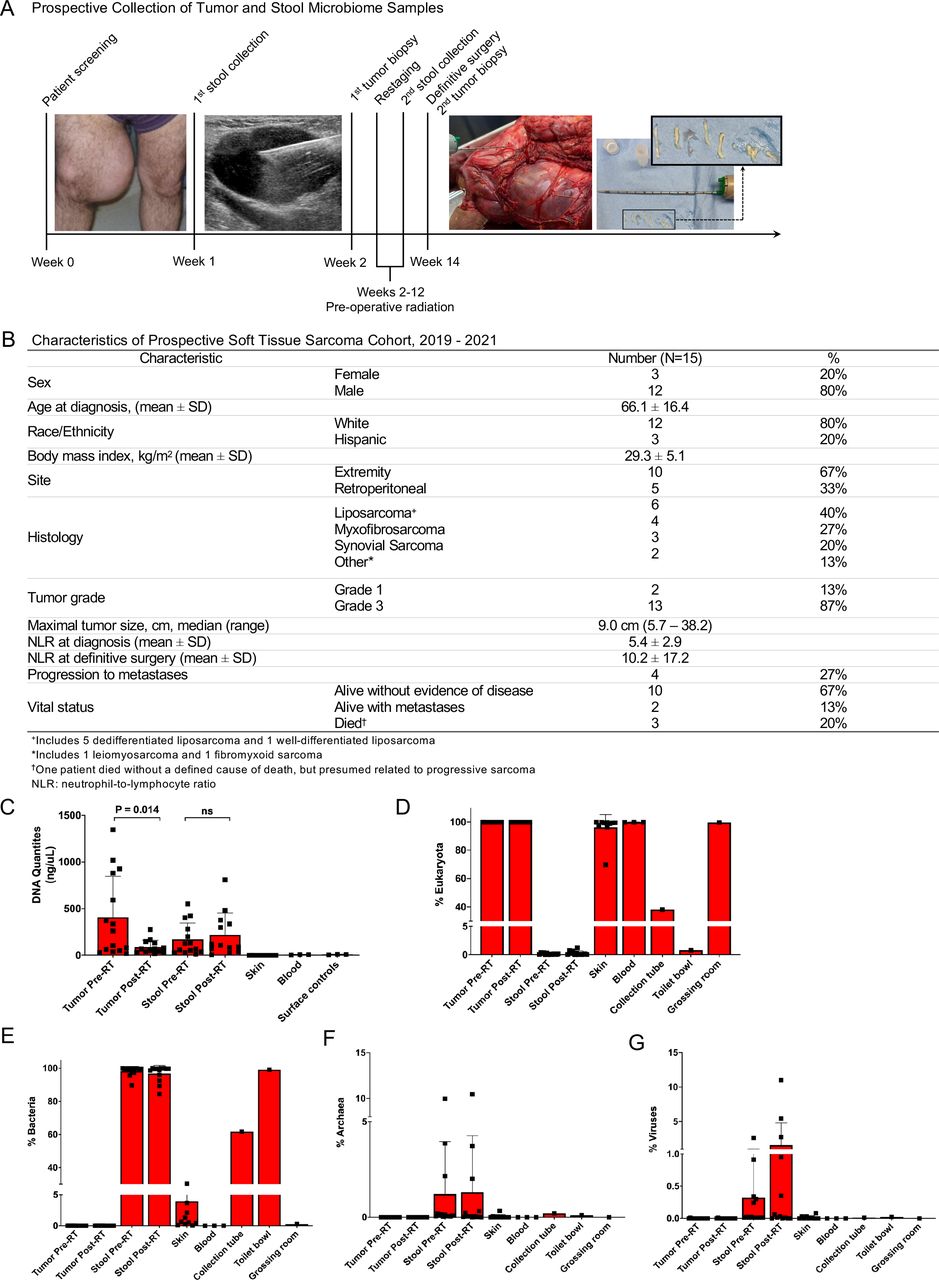
Given the known risks of contamination with microbiome studies, especially in low abundance microbial environments, we adopted a strict sterile tissue collection protocol. Figure 1A depicts the schema of clinical care and specimen collection. Eligible patients presented with findings suspicious for non-metastatic STS and were enrolled prospectively. The pre-RT stool sample was then self-collected. Pre-RT tumor tissue was collected during image-guided core needle biopsy. After completion of neoadjuvant RT, prior to surgery, a second stool sample was collected. The second tumor sample was obtained from the excised specimen at the time of surgery, again using sterile technique to collect core needle biopsies prior to accessioning of the surgical specimen.

Soft tissue sarcomas harbors a quantifiable intratumoral microbiome. (A) Schema illustrating clinical care and prospective collection of tumor and stool microbiome samples at indicated time points. Left shows a large medial thigh soft tissue mass suspicious for soft tissue sarcoma with sonographic image of echogenic core needle biopsy instrument being inserted into tumor for both diagnostic biopsy and collection of tumor sample for microbiome analysis. Subsequent photo of gross tumor specimen at time of surgical resection with insertion of core needle instrument prior to pathologic accessioning and inking of tumor specimen. Inset shows examples of core specimens from tumors obtained sterilely. (B) Demographic and clinicopathologic characteristics for the prospectively analyzed cohort. (C) DNA extraction quantities for tumor, stool, collection surface, and skin surface control specimens. (D–G) Relative abundance of DNA in tumor, stool, and collection surface control specimens by (D) eukaryote/human, (E) bacterial, (F) archaea, and (G) viral origin. Relative abundance describes the per cent composition of a specific organism relative to the total organism number. NLR, neutrophil-lymphocyte ratio; RT, radiotherapy.
Figure 1B depicts the clinicopathologic and treatment characteristics of our patients. Most patients were men, with a mean age of 66.1 years (±16.4). Extremity tumors (67%) and well-differentiated/dedifferentiated liposarcoma histology (40%) were most common. The majority of patients presented with locally advanced disease, although two patients (one well-differentiated liposarcoma and one fibromyxoid sarcoma) demonstrated low-grade histology despite initial findings suspicious for high-grade disease. To date, 4 (27%) patients have developed metastases, and 3 (20%) have died (figure 1B).
The quantity of DNA extracted from tumor, stool, skin, blood, and surface controls is depicted in figure 1C. The mean quantity of DNA extracted from the biopsy samples was significantly greater (407.7±438.0 ng/µL) than that collected at surgical resection (87.1±74.0 ng/µL, p=0.014), suggesting an effect of RT on DNA recovery. In contrast, the mean quantity of DNA extracted from stool samples was similar between the pre-diagnosis specimen (170.7±175.3 ng/µL) and the post-neoadjuvant RT specimen (219.0±234.0 ng/µL, p>0.05). As expected, skin, blood and surface controls demonstrated a smaller average quantity of DNA collected, at 0.07 ng/µL (±0.15), 6.1 ng/µL (±2.05), and 7.8 ng/µL (±2.9), respectively, highlighting the importance of quantification as an endpoint in microbiome studies in addition to relative abundance. As shown in figure 1D,E, tumor specimens exhibited overwhelmingly eukaryotic/human DNA (mean >99%), with a small but consistent proportion of bacterial DNA (mean 0.02%±0.004%) present in all samples. Stool specimens consisted mostly of bacterial DNA (mean 53.2%±11.1%), with a small amount of eukaryotic DNA present (mean 0.08%±0.13%), and the remainder unclassified. Surface control swabs (figure 1C) demonstrated significant variability in relative abundance of eukaryotic/human DNA (sterile vial 24.1% vs pathology workroom 98.7%), likely reflective of the type and amount of potential contamination present, such as the processing of surgical specimens in the pathology workroom. The pathology workroom surface samples demonstrated a small amount of bacterial DNA (0.27%) compared with the sterile vial (39.1%) and the hospital toilet bowl (62.4%), again representative of the potential for exposure to contaminants. As shown in figure 1F,G, the relative abundance of archaea and viral DNA was low for all samples, but relatively more abundant in stool samples compared with tumor samples or collection surface controls.
STS intratumoral microbiome at diagnosis may link with prognosis
We then analyzed the non-eukaryotic organisms within the tumor biopsy specimens to further characterize the communities and evaluate for associations with key clinical and pathological variables. Consistent with typical STS cohorts, there was significant morphological heterogeneity at both the macroscopic and microscopic level in biopsy and tumor specimens (figure 2A). We then analyzed microbial communities across the taxonomic spectrum. Overall, we observed high alpha diversity in the samples at diagnosis as shown in figure 2B, with 14 of 15 tumor biopsies demonstrating a Shannon alpha diversity index score of 4, a quantitative marker of greater taxonomic biodiversity. However, one patient (patient 11, figure 2C) had approximately 90% of the tumor microbiome at diagnosis represented by a single viral species (human herpesvirus 6; HHV-6), resulting in a lower alpha diversity index score compared with all other samples. Figure 2C also shows that all other intratumoral microbiome samples were represented predominantly by bacteria with a modest representation by viruses and archaea. At the bacterial phylum level (figure 2D) the intratumoral microbiome at diagnosis consisted mostly of Proteobacteria, Bacteroidetes, and Firmicutes. At the bacterial family level, over 20 families were identified (figure 2E), with substantial variation observed. In four patients, Pasteurellaceae represented approximately 25% of the relative abundance of the intratumoral microbial DNA (figure 2E), but in the other patients, this family represented ≤5% of bacterial families.
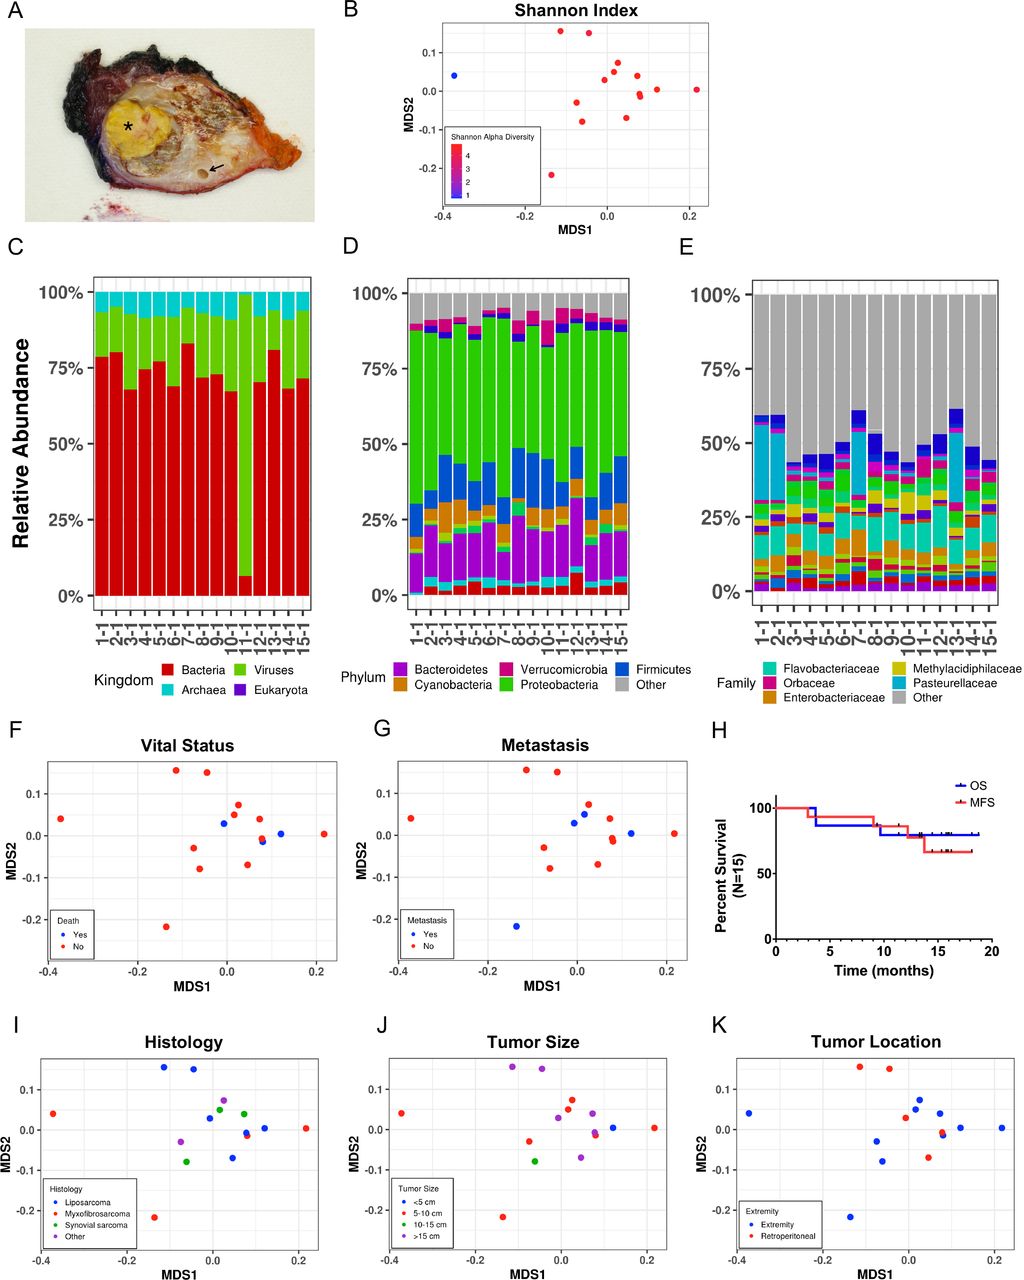
Soft tissue sarcomas intratumoral microbiome at diagnosis may link with prognosis. (A) Representative gross examination of extremity synovial sarcoma specimen; asterisk demonstrates tumor necrosis and arrow identifies an encased major artery. (B) Multidimensional scaling (MDS) plot based on mathematical distance of taxonomic divergence for pre-RT intratumoral microbiome by alpha diversity. MDS plot demonstrates notable biodiversity for all pre-RT tumor samples with the exception of one patient with low intratumoral biodiversity (blue). (C–E) Relative abundances for pre-RT intratumoral microbiome by individual patients at the (C) kingdom, (D) phylum, and (E) family levels. Relative abundance describes the per cent composition of a specific organism relative to the total organism number. (F) MDS plot for pre-RT intratumoral microbiome by patient deaths. (G) MDS plot for pre-RT intratumoral microbiome by progression to metastases. (H) Kaplan-Meier estimates for overall survival (OS) and metastasis-free survival (MFS). (I–J) MDS plots for pre-RT intratumoral microbiome by (I) histology, (J) tumor size, and (K) tumor location. RT, radiotherapy.
We then analyzed the beta diversity in our tumor microbiome samples with respect to key oncologic outcomes, including death (figure 2F) and distant metastases (figure 2G). As shown by multidimensional scaling (MDS) plots, the intratumoral microbiome at initial diagnosis clustered among the patients who died compared with the patients who remain alive. This clustering was stronger among patients who died as compared with patients who developed metastases (figure 2G), reinforcing the complex relationship between metastatic progression and death in STS studies. As depicted in figure 2H, overall survival (OS) and metastasis-free survival (MFS) for our cohort are consistent with those of other high-risk cohorts of patients with STS with locally-advanced disease.37 However, when analyzing the intratumoral microbiome at diagnosis with respect to other established STS prognostic factors (figure 2I–K), we observed no significant clustering of the tumor microbiome profiles when stratified by these variables. Taken together, these data suggest that STS harbor an intratumoral microbiome at presentation, and whether individually or in aggregate, these microbial constituents have correlations for oncologic outcome.
Therapeutic radiation normalizes the STS intratumoral microbiome at the time of surgery
We then analyzed the intratumoral microbiome from the surgical resection specimen. At the kingdom level, we observed no meaningful differences in the relative abundance of bacteria, viruses, and archaea before or after RT (figure 3A). Notably, the intratumoral microbiome in patient 11 (with low alpha diversity and very high HHV-6 viral content) remained remarkably consistent across time points, with approximately 90% of non-eukaryotic DNA comprizing HHV-6 viral DNA. Similarly, although significantly more variable and heterogeneous at the phylum and family levels (figure 3B,C), the microbial composition of post-RT samples mirrored the results of the pre-RT sample within patients despite the time interval between specimen acquisition and the cytotoxic effects of RT. As shown in figure 3D, most STS tumor microbiome samples demonstrated microbial taxonomic biodiversity pre-RT and post-RT, as quantified by Shannon alpha diversity index scores >4. Importantly, however, patient 11 remained an outlier with low alpha diversity in both pre-RT and post-RT tumors due to the markedly high relative abundance of HHV-6 in those samples.
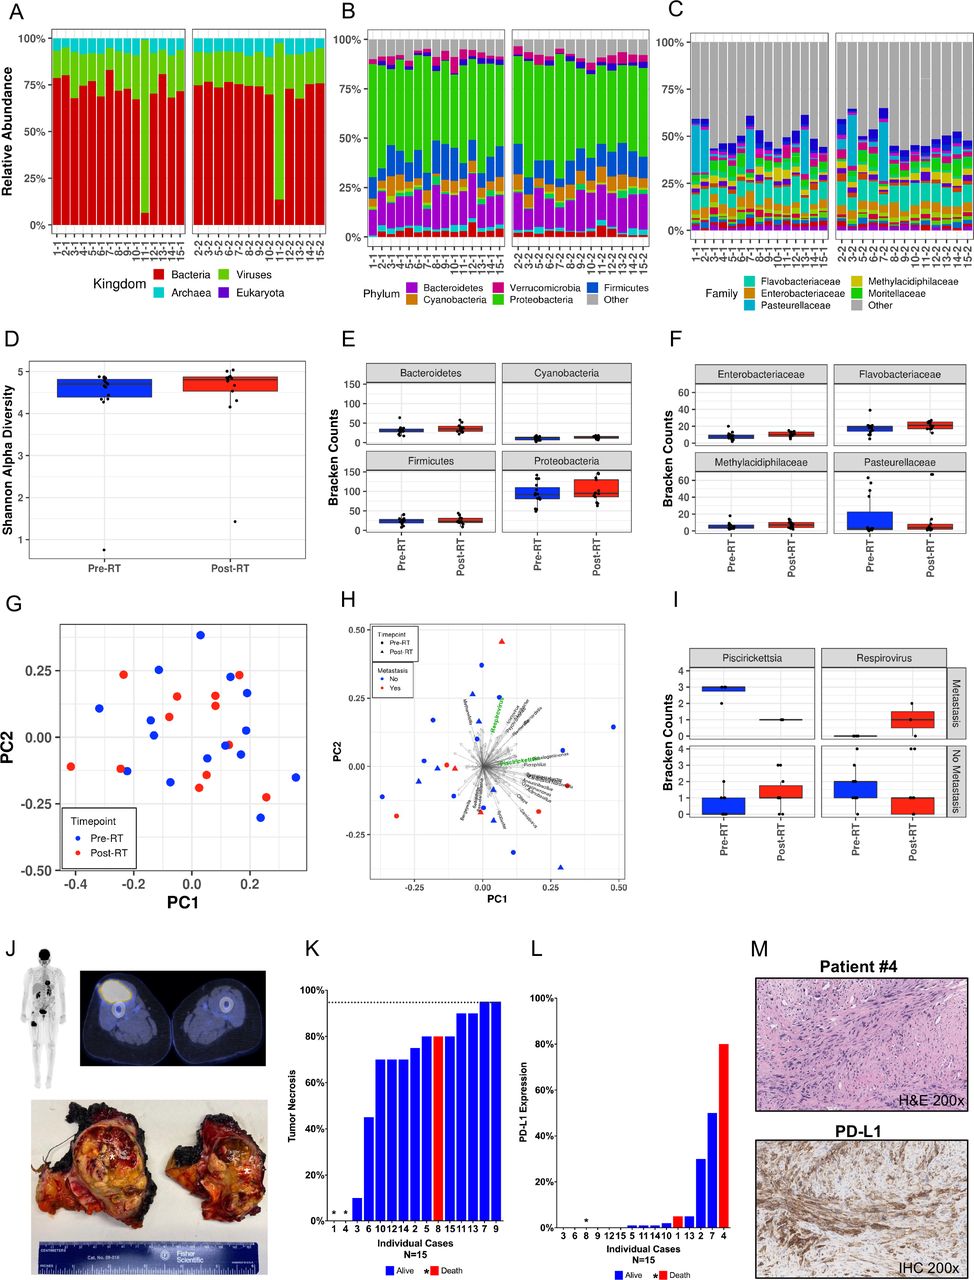
Therapeutic radiation normalizes the STS intratumoral microbiome at the time of surgery. (A–C) Relative abundances for the pre-RT and post-RT intratumoral microbiomes by patient at the (A) kingdom, (B) phylum, and (C) family levels. Relative abundance describes the per cent composition of a specific organism relative to the total organism number. (D) Intratumoral alpha diversity across RT time periods. Most tumor biopsies demonstrated a Shannon alpha diversity index score of 4, a quantitative marker of greater taxonomic biodiversity; however, one patient exhibited low biodiversity at both pre-RT and post-RT periods. (E) Raw Bracken counts for the four most abundant intratumoral bacterial phyla across pre-RT and post-RT periods. There were no significant differences in Bracken counts for Bacteroidetes, Cyanobacteria, or Firmicutes, although intratumoral counts of Proteobacteria did decrease, on average, after RT despite a wide range. (F) Raw Bracken counts for the four most abundant intratumoral bacterial families pre-RT and post-RT periods. There were no abundance differences for Enterobacteriaceae, Flavobacteriaceae, or Methylacidiphilaceae across periods. There was a substantial reduction in Pasteurellaceae abundance in post-RT tumor samples; however, this reduction was not statistically significant (p>0.05). (G) Principal component analysis (PCA) of tumor specimens across RT time periods demonstrating no significant variability in the intratumoral microbiome when comparing pre-RT to post-RT tumor microbiome samples (p=0.167). (H) PCA highlighting two differentially abundant genera (Piscirickettsia (p=0.002), Respirovirus (p=0.041)) in the pre-RT tumor microbiome when stratifying by progression to metastatic disease. (I) Raw Bracken counts for Piscirickettsia and Respirovirus by time period and progression to metastasis. Boxplots demonstrate increased Piscirickettsia abundance and decreased Respirovirus abundance when comparing pre-RT to post-RT tumor microbiome samples in patients who progressed to metastases compared with those who did not. (J) Preoperative PET/CT (top) shows a hypermetabolic mass in the anterior compartment of the thigh; resected surgical specimen (bottom) of the extremity myxofibrosarcoma; asterisks highlight post-RT tumor necrosis. (K) Per cent tumor necrosis by patient at the time of definitive surgery. Alive patients are denoted by blue bars, and deaths are denoted by red bars or asterisks if tumor necrosis was 0% or not available. A threshold of 95% tumor necrosis (considered complete pathologic necrosis) is indicated by the dashed horizontal line. (L) Per cent PD-L1 expression by patient. Alive patients are denoted by blue bars, and deaths are denoted by red bars or asterisks if PD-L1 expression was 0% or not available. Nine patients demonstrated positivity for PD-L1 expression (tumor proportion score >0). (M) Representative H&E photomicrograph of patient #4 with dedifferentiated liposarcoma marked by aggressive clinical course, rapid demise, and high PD-LI staining on immunohistochemistry. IHC, immunohistochemical; PD-1, programmed cell death protein-1; PD-L1, programmed death ligand-1; PET, positron emission tomography; RT, radiotherapy.
Figure 3E shows the raw Bracken counts for the highest in relative abundance intratumoral bacterial phyla pre-RT and post-RT. We observed no significant differences in normalized Bracken counts for Bacteroidetes, Cyanobacteria, or Firmicutes, although intratumoral counts of Proteobacteria did decrease, on average, after RT despite a wide range. Similarly, figure 3F shows the Bracken counts for the most abundant bacterial families across specimens, with no apparent differences in pre-RT and post-RT intratumoral counts for Enterobacteriaceae, Flavobacteriaceae, or Methylacidiphilaceae but a substantial reduction in Pasteurellaceae counts in post-RT tumor samples which was not statistically significant (p>0.05). Figure 3G shows principal component analysis (PCA) of tumor specimens by RT time period and demonstrates no significant variability in the intratumoral microbiome when comparing pre-RT to post-RT tumor microbiome samples (p=0.167). Although we found no significant associations between the intratumoral microbiome either before or after RT and established STS prognostic factors such as age, sex, body mass index (BMI), histology, tumor size, or tumor location, we did observe two genera which were differentially abundant in the pre-RT tumor microbiome when stratifying by progression to metastatic disease: Piscirickettsia (p=0.002) and Respirovirus (figure 3H, p=0.041). Similarly, as depicted in figure 3I, we also observed differences in raw Bracken counts with increased Bracken counts of Piscirickettsia and decreased counts of Respirovirus when comparing pre-RT to post-RT tumor microbiome samples in patients who progressed to metastases. Additionally, despite enrolling a high-risk patient cohort with locally advanced disease (figure 3J), we did not observe pathologic complete response or PD-L1 expression (figure 3K,L) to be associated with the intratumoral microbiome by MDS or clinical outcomes on univariate analysis.38 39 As shown in figures 3L and nine patients demonstrated positivity for PD-L1 expression (tumor proportion score >0). Among three patient deaths, two demonstrated immunohistochemical (IHC) positivity for PD-L1 (figure 3M).38 39 Overall, these data suggest that the STS intratumoral microbiome is largely stable following neoadjuvant RT with fewer implications for oncologic outcome than the intratumoral microbiome at diagnosis.
Gut microbiome in patients with STS does not appear to be associated with clinical outcomes
Given the critical importance of the gut microbiome in modulating host immune response, including response to immunotherapy, we then evaluated the composition of the stool microbiome in our cohort.3 4 7–9 40 At the kingdom level, we observed no significant differences in the relative abundance of bacteria, viruses, and archaea before or after RT among matched specimens (figure 4A). Overall, bacteria represented greater than 90% of relative abundance among all patients. There were selected patients who harbored a small proportion of archaea (patients 10, 13, and 15) in their stool, but the frequencies were relatively stable across time points. Interestingly, patient 8 demonstrated approximately 10% archaea in the post-RT gut microbiome. Although methanogens are generally associated with age in the human gut, this patient harbored <1% archaea in the gut microbiome at presentation approximately 3 months previously, so the acute change is unexplained by age alone.41 Since methanogens have been associated with dysbiosis and immune dysregulation, including myeloid cell accumulation and histopathological inflammation when inhaled, the potential relation of this patient’s change in gut microbiome and rapid progression of disease with metastases and death is intriguing and hypothesis-generating.42

Gut Microbiome in patients with STS does not appear to be associated with clinical outcomes. (A–C) Relative abundances for pre-RT and post-RT gut microbiome per patient by (A) kingdom, (B) phylum, and (C) family level. Relative abundance describes the per cent composition of a specific organism relative to the total organism number. (D) Gut microbiome alpha diversity did not differ across RT time periods (p>0.05). Greater Shannon alpha diversity index scores are a quantitative marker of greater taxonomic biodiversity. (E–F) Raw Bracken counts for the four most abundant gut bacterial (E) phyla and (F) families did not vary substantially by RT time periods. (G) PCA of gut specimens across RT time periods. (H) PCA of gut microbiome samples across RT time periods with overlying species-level differences did not demonstrate significant differences in the gut microbiome with regard to the administration of RT (p=0.078). (I–L) MDS plots demonstrating the gut microbiome across RT time periods with respect to metastasis (I), death (J), age (K), and BMI (L), which do not appear to be associated with the STS gut microbiome. Circles denote pre-RT gut microbiome samples and triangles denote post-RT gut microbiome samples. BMI, body mass index; MDS, multidimensional scaling; PCA, principal component analysis; RT, radiotherapy; STS, soft tissue sarcomas.
We next evaluated the stool microbiome at the phylum level. The highest in terms of relative abundance were Firmicutes, Proteobacteria, Bacteroidetes, and Actinobacteria, which demonstrated minimal variation before and after RT, although there was significant interpatient heterogeneity (figure 4B). However, at the bacterial family level, there was substantial variation within matched patient samples before and after RT (figure 4C). Ultimately, we identified more than 20 distinct bacterial families across patient stool specimens. Figure 4D shows the Shannon alpha diversity index for stool specimens before and after RT. Although the pre-RT specimens showed greater alpha diversity, these differences were not significantly different using a linear mixed effects model (p>0.05). As shown in figure 4E,F, the Bracken counts for the four most abundant bacterial phyla and bacterial families in the gut microbiome did not vary substantially by RT time period. Similarly, PCA of stool specimens by RT time period (figure 4G) did not demonstrate any significant difference in the gut microbiome with regard to the administration of RT, although there was a trend (p=0.078). Figure 4H illustrates the same PCA of the gut microbiome with the addition of overlying species-level differences in an attempt to identify organisms that may be driving gut microbiome differences across RT time periods. In this analysis, no gut microbiome species were found to be differentially abundant (p>0.05). Additionally, using permutational multivariate analysis of variance(PERMANOVA) analysis, we found no significant associations between the gut microbiome and timing of RT and other clinically relevant STS prognostic factors (figure 4I–L, all variables p>0.05). When analyzing the gut microbiome with respect to metastatic progression (figure 4I) or death (figure 4J), we observed no significant clustering of the gut microbiome profiles with respect to outcomes. When considering established factors that impact the gut microbiome such as age (figure 4K) or BMI (figure 4L), we also did not observe any significant clustering on stratification. Altogether, these data suggest that the gut microbiome in STS demonstrates substantial variability across patients and therapeutic time frames and does not appear to be associated with prognosis or oncologic outcomes, unlike the tumor microbiome at diagnosis.
STS intratumoral microbiome is measurably distinct from possible skin contaminants
To better assess potential avenues of contamination during the tumor sample collection process, we also analyzed the microbiome composition across tissues compartments, including skin, blood, tumor, and stool. The quantities of DNA extracted from skin samples before surgical antiseptic application, after surgical prep application, and at time of skin closure during surgery are shown in figure 5A. Overall, the mean quantity of DNA extracted across all samples was very low, at 0.07 ng/µL (±0.15), with significantly more DNA collected at the time of skin closure (p=0.022). At a kingdom level, the skin and blood microbiomes are predominantly eukaryotic/human in origin (figure 5B,C). At the bacterial phylum level, tumor (figure 5D), skin (figure 5E), and blood (figure 5F) samples appear distinct. Shown in figure 5G is an MDS plot depicting microbiome differences by tissue compartment across patients with at least three tissues analyzed, demonstrating that microbiome profiles are substantially different by location, with distinct clustering of the tumor, stool, skin, and blood microbiomes. When isolated within a single patient, this pattern of distinct tissue compartment separation further highlights the taxonomic divergence by tissue type (figure 5H). Taken together, tissue-specific sequencing data sheds light on the microbiome biomass and how commensals in these tissues are distinct from the microbiome recovered from the tumor and less likely to be from contamination.

Soft tissue sarcomas intratumoral microbiome is measurably distinct from possible skin contaminants. (A) DNA extraction quantities from skin control specimens were analyzed at three time points, including before antiseptic prep was applied to the surgical site, immediately after antiseptic prep was applied prior to surgical incision, and at time of surgical wound closure when the procedure was finished. (B) Relative abundances for the skin microbiome by patient and timing of surgical prep application at the kingdom level showing near 100% relative abundance of eukaryotic DNA in the majority of skin samples where quantifiable DNA was recovered. (C) Relative abundances for the blood microbiome by individual patients for a subset of patients where samples were available. (D–F) Relative abundances at the bacterial phylum level for (D) tumor, (E) skin, and (F) blood sample. (G) MDS plots demonstrating microbiome differences by tissue compartment across all newly enrolled patients. (H) MDS plot demonstrating microbiome differences by tissue compartment within a single patient, highlighting taxonomic divergence among tumor and skin despite proximity of overlying skin to tumor soft tissue location. MDS, multidimensional scaling.
Intratumoral viral microbiome is associated with NK cell infiltration and improved clinical outcomes
We then evaluated the immune composition of the TME using multiple immune readouts to evaluate the impact of the intratumoral microbiome. First, we observed that NKp46 staining intensity was higher among patients who lived than died, although this finding was not statistically significant (figure 6A). We then analyzed a larger STS cohort from our institution (N=29, online supplemental table 2) to further evaluate the clinical significance of NK infiltrate in the STS TME. In this cohort, we also observed a trend of improved OS in patients with high intratumoral NKp46 expression (p=0.08), where high versus low expression was determined by the median (figure 6B,C). Given that patient 11 harbored >90% relative abundance of HHV-6 in the tumor microbiome at both time points (figure 6D), confirmed by BLAST analysis on GenBank, we sought to better understand the impact of the intratumoral viral abundance and clinical outcomes. We noted a strong positive correlation (r=0.90, p=0.006) between the relative abundance of intratumoral viruses and NK infiltration as measured by flow cytometry (figure 6E) which was not observed for intratumoral bacteria or eukaryota (figure 6F,G). To investigate the potential link of intratumoral viral abundance with NK infiltrates, we also analyzed viral Bracken counts, which also correlated positively (r=0.75, p=0.05) with NK infiltration by flow cytometry (figure 6H). We then evaluated the impact of higher NK infiltration by flow cytometry and found that patients without metastases showed a trend towards higher NK infiltration compared with those with metastases (p=0.11). Intratumoral viral Bracken counts were also higher among patients who did not develop metastases compared with those who did, but this difference was not significantly different (figure 6I,J). However, when analyzing Respirovirus Bracken counts, we found that intratumoral Respirovirus was significantly more abundant in patients without metastases than those with metastases (figure 6K). In addition to IHC and flow cytometry, we analyzed the TME of our microbiome cohort by IF (figure 6N). As shown in figure 6O,P, we again observed encouraging evidence that NK cell density positively correlates with both MFS (r=0.45, p=0.078) and OS (r=0.46, p=0.073). On balance, these data suggest an intriguing interaction in the sarcoma TME whereby the presence of an intratumoral viral microbiome is linked with higher NK infiltration and improved clinical outcomes.

Intratumoral viral microbiome is associated with NK cell infiltration and improved clinical outcomes. (A) Staining intensity of NKp46 by immunohistochemical (IHC) analysis showing higher intensity in alive patients of microbiome cohort compared with those who died, although not statistically significant. (B) Kaplan-Meier analysis of NKp46 staining intensity from a larger retrospective soft tissue sarcomas cohort from authors’ institution (N=29, online supplemental table 2) shows a trend of improved overall survival in patients with high intratumoral NKp46 expression (p=0.08), where high versus low expression is determined by the median. (C) Representative IHC photomicrographs of high and low staining for NKp46 at 200× magnification. (D) Family level virus relative abundances for pre-RT and post-RT tumor microbiomes by individual patients. Patient 11 notably harbored >90% relative abundance of human herpesvirus 6 in the tumor microbiome both pre-RT and post-RT. (E) Strong positive correlation between the relative abundance of intratumoral viruses and per cent NK cells of live CD45+cells by flow cytometry in microbiome patients (p=0.006, r=0.90). (F) Relative abundance of intratumoral bacteria and (G) eukaryota did not correlate with per cent NK cells of live CD45+ cells (p=0.70, r=−0.18 and p=0.40, r=−0.38, respectively). (H) Intratumoral viral Bracken counts correlated positively with per cent NK cells of live CD45+ cells (p=0.05, r=0.75). (I) Microbiome patients without metastases showed a trend towards higher per cent NK cells of live CD45+ cells (by flow cytometry) compared with those with metastases (p=0.11). (J, K) Overall intratumoral viral Bracken counts did not differ significantly between patients based on metastasis status, but Respirovirus Bracken counts were significantly higher in patients without metastases. (L–M) Representative flow cytometry gating showing intratumoral NK cells (CD56+CD3−) and CD3+ T cells (CD56−CD3+) for two patients with low (patient 8) and high (patient 11) NK infiltrates with percentages derived from the lymphocyte parent gate while quantitation for analyses was based on the higher order gate of live CD45+ cells. (N) Representative Opal photomicrographs showing high and low NKp46 expression (pink) on a background of DAPI stained nuclei (blue). Cell density was determined using QuPath software and stratified into high and low expression based on the median value. (O–P) By immunofluorescence, there was a trend for NK cell density to positively correlate with both (O) metastasis-free survival (p=0.078, r=0.45) and (P) overall survival (p=0.073, r=0.46). DAPI, 4′,6-diamidino-2-phenylindole.NK, natural killer; RT, radiotherapy; SSC-A, side scatter area.
NK cells with an antiviral phenotype are associated with improved survival in STS
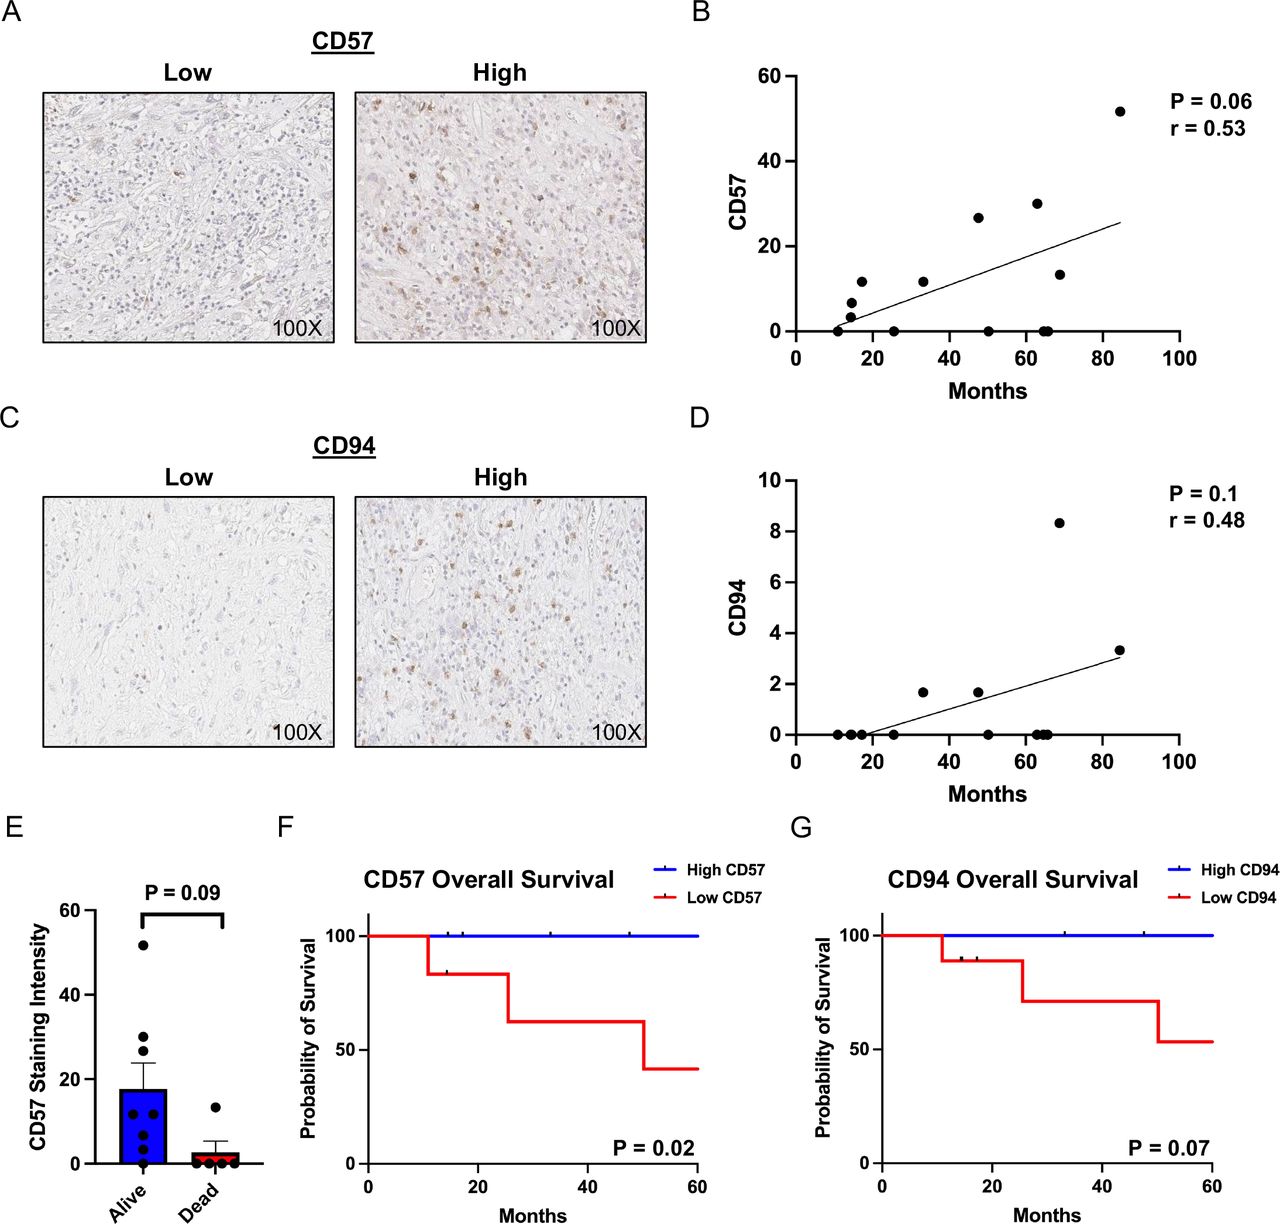
To further assess the impact of intratumoral NK cells and the intratumoral viral microbiome on outcomes, we next examined CD57 and CD94 expression as NK cells expressing these markers are associated with heightened antiviral responses.43–46 We observed a positive correlation between intratumoral CD57 expression (figure 7A) and OS with a Pearson coefficient of 0.53 (figure 7B, p=0.06). We observed a similar trend between intratumoral CD94 expression (figure 7C) and OS with a Pearson coefficient of 0.48, although this was not statistically significant (figure 7D, p=0.1). Similarly, CD57 expression was higher in patients who were alive at the end of the study period compared with those who died, although this did not reach statistical significance (figure 7E, p=0.09). Using median values to stratify patients into high and low expression, we observed that patients with high CD57 had significantly improved OS compared with patients with low expression (figure 7F, p=0.02), and patients with high CD94 expression also had improved OS, although this difference did not reach significance (figure 7G, p=0.07). Overall, these results suggest that NK cells with an antiviral phenotype are associated with a more favorable outcomes in STS, further reinforcing a link between an intratumoral viral microbiome, NK cell infiltration, and favorable clinical outcomes.
Natural killer cells with an antiviral phenotype are associated with improved survival in STS. (A) Representative IHC photomicrographs of low and high staining for CD57 at 100× magnification from a larger retrospective STS cohort from authors’ institution (N=29, online supplemental table 2) (B) Overall survival of patients with STS correlated positively with CD57 expression, with a trend toward statistical significance (p=0.06, r=0.53). (C) Representative IHC photomicrographs of low and high staining for CD94 at 100× magnification. (D) Overall survival of patients with STS showed a positive association with CD94 expression, although not statistically significant (p=0.1, r=0.48). (E) CD57 expression showed a trend to be higher in patients who lived versus those who died (p=0.09). (F–G) Kaplan-Meier analysis of CD57 and CD94 expression, where high versus low expression is stratified by the median level of expression. (F) Patients with high intratumoral expression of CD57 had significantly improved overall survival compared with those with low CD57 expression (p=0.02). (G) Analysis of CD94 shows a trend of improved overall survival in patients with high intratumoral CD94 expression compared with those with low expression (p=0.07). IHC, immunohistochemical; STS, soft tissue sarcomas.
Discussion
In this prospective analysis using sterile precautions and a rigorous collection protocol, we demonstrated the presence of a measurable intratumoral microbiome in patients with STS at diagnosis and after RT using whole genome shotgun sequencing. Our data suggest that the STS intratumoral microbiome at diagnosis may have prognostic significance, especially with exciting data that intratumoral viral relative abundance is linked with intratumoral NK cell infiltration and better survival. Additionally, we prospectively analyzed the gut microbiome of patients with STS undergoing preoperative RT, observing marked variability across patients and therapeutic time frame which did not appear to be associated with oncologic outcomes. We also did not observe an association of the gut microbiome with outcomes, potentially because of the substantial microbial complexity in the gut or because the gut microbiome is more closely linked to systemic therapies like ICI instead of local therapies like surgery and RT.
While we present data establishing the presence of an intratumoral microbiome in STS, it is important to note that the overall relative abundance of non-eukaryotic DNA was low compared with the abundance of eukaryotic or human DNA (>99%). However, this finding is not unexpected given that human genomes are exponentially larger than microbial genomes.12 In light of the low relative abundances of non-eukaryotic DNA in our tumor samples, we acknowledge that the possibility of contamination cannot be completely ruled out despite our sterile collection protocol. Yet, when compared with our surface controls, the relative abundances of eukaryotic and non-eukaryotic DNA in all tumor samples were consistently and reproducibly different, suggesting that our findings are not random or attributable to contamination alone. Furthermore, the intratumoral microbiome sequencing and immune TME data we present for patient 11 demonstrates low alpha diversity with >90% of this patient’s non-eukaryotic DNA attributable to HHV-6 combined with a high NK infiltrate. These findings were reproducible on tumor samples from the same patient collected 3 months apart, which further supports that our findings cannot be attributed solely to contamination as this would be highly unlikely to happen coincidentally.
Our analysis of the intratumoral viral microbiome and its relationship with tumor infiltrating NK cells resulted in convincing associations between relative abundance of intratumoral viruses and NK cells by flow cytometry. Although overall extent of NK cell infiltration was generally low in the STS, higher expression of NKp46 by IHC is associated with improved OS, and similarly, NK cell density by IF is positively correlated with both MFS and OS. Given that viruses can stimulate NK cells directly, through activating receptors, and indirectly, through the release of NK cell activating cytokines, we believe the intratumoral viral microbiome plays an important role in the priming of NK cells to infiltrate the tumors and by extent the prognosis.22 In addition to the association seen with the survival of patients, both the tumor infiltrating NK cells and intratumoral viruses, specifically Respirovirus, were seen at higher levels in patients who did not develop metastases. Analysis of CD57 and CD94 expression, which are NK markers specifically associated with antiviral responses, showed that higher expression in the TME was associated with a better prognosis, also emphasizing this potentially actionable link.
Despite the provocative findings of our work, it is necessary to acknowledge the limitations. Our prospective cohort of 15 patients is small with relatively short follow-up, both of which limit our ability to draw robust conclusions regarding potential associations of the intratumoral microbiome with relapse and survival. Despite careful organization, collection, and analysis, we acknowledge that contamination and false positive results are a major challenge in the planning and interpretation of microbiome studies. While our meticulous study design, strict collection protocol, sampling of controls, and high-quality analyses using whole genome shotgun sequencing are notable strengths of our study, it is still possible that our results may reflect contamination inherent to microbiome analyses. Additionally, our successful enrollment of 15 patients is relatively low. When considering that STS is a rare disease, enrollment of 15 patients meeting all study criteria is a significant threshold, but a definitive study would likely require an enrollment approximately 10-fold higher. However, such a study would not have been feasible in a reasonable period of a time given the fast pace of scientific discoveries in microbiome research.4 5
Ultimately, our data demonstrate the presence of a measurable and clinically relevant intratumoral microbiome in a prospective STS cohort. We demonstrate that among patients with metastatic progression and death, the intratumoral microbiome has prognostic significance and viral relative abundance appears to drive NK infiltration and better prognosis. Our data also suggest a link between the intratumoral microbiome and the STS TME, underscoring the importance of understanding how the STS intratumoral microbiome may be targeted to influence immune infiltration and outcomes for patients with STS.
Data availability statement
Data are available upon reasonable request.
Ethics statements
Patient consent for publication
Ethics approval
Ethical approval for the study was obtained by the University of California Davis Institutional Review Board, protocols #939793-5 and #484670-5. Participants gave informed consent to participate in the study before taking part.
Acknowledgments
Special thanks Abimbola Olusanya for assistance in ensuring patient confidentiality and record keeping, and the Department of Pathology technicians Doug Peabody, Jesse Low, and Lesha Salto for their assistance with sample preparation and specimen acquisition.
References
Supplementary materials
Supplementary Data
This web only file has been produced by the BMJ Publishing Group from an electronic file supplied by the author(s) and has not been edited for content.
Footnotes
LMP and SMC contributed equally.
Contributors LMP, LBJ, UNB, JAE, and RJC designed the study. LMP, SMC, MAD, SJJ, JAE, and RJC conducted the experiments and collected the data. LMP, SMC, KTK, MAD, BPD-J, AAG, SJJ, JAE, and RJC analyzed the data. LMP, SMC, and RJC wrote the manuscript. All authors, including AMM, JC-A, SWT, and WJM provided critical reviews of the manuscript. RJC accepts full responsibility for the finished work and/or the conduct of the study, had access to the data, and controlled the decision to publish.
Funding This work was also supported in part by funds from the UC Davis Comprehensive Cancer Center and the University of California Davis Flow Cytometry Shared Resource Laboratory with funding from the NCI P30 CA093373 (Cancer Center), and S10 OD018223 (Astrios Cell Sorter), and S10 RR 026825 (Fortessa Cytometer) grants, with technical assistance from Ms Bridget McLaughlin and Mr Jonathan Van Dyke. Specimens were provided by the UC Davis Pathology Biorepository which is jointly funded by the UC Davis Comprehensive Cancer Support Grant (CCSG) awarded by the National Cancer Institute (NCI P30 CA093373) and the UC Davis Department of Pathology and Laboratory Medicine. The sequencing was carried out at the DNA Technologies and Expression Analysis Cores at the UC Davis Genome Center, supported by NIH Shared Instrumentation Grant 1S10OD010786-01, with technical assistance from Ms Emily Kumimoto, Ms Claire Barron Goldman, and Dr Lutz Froenicke. Research support was also provided through a generous grant by the UC Comprehensive Cancer Center. This work was also in part supported by NCI-funded predoctoral fellowships awarded to LMP (T32 CA251007) and KTK (T32 CA251007).
Competing interests None declared.
Provenance and peer review Not commissioned; externally peer reviewed.
Supplemental material This content has been supplied by the author(s). It has not been vetted by BMJ Publishing Group Limited (BMJ) and may not have been peer-reviewed. Any opinions or recommendations discussed are solely those of the author(s) and are not endorsed by BMJ. BMJ disclaims all liability and responsibility arising from any reliance placed on the content. Where the content includes any translated material, BMJ does not warrant the accuracy and reliability of the translations (including but not limited to local regulations, clinical guidelines, terminology, drug names and drug dosages), and is not responsible for any error and/or omissions arising from translation and adaptation or otherwise.