Article Text

Abstract
Background Immunotherapy emerged as a promising treatment option for multiple myeloma (MM) patients. However, therapeutic efficacy can be hampered by the presence of an immunosuppressive bone marrow microenvironment including myeloid cells. S100A9 was previously identified as a key regulator of myeloid cell accumulation and suppressive activity. Tasquinimod, a small molecule inhibitor of S100A9, is currently in a phase Ib/IIa clinical trial in MM patients (NCT04405167). We aimed to gain more insights into its mechanisms of action both on the myeloma cells and the immune microenvironment.
Methods We analyzed the effects of tasquinimod on MM cell viability, cell proliferation and downstream signaling pathways in vitro using RNA sequencing, real-time PCR, western blot analysis and multiparameter flow cytometry. Myeloid cells and T cells were cocultured at different ratios to assess tasquinimod-mediated immunomodulatory effects. The in vivo impact on immune cells (myeloid cell subsets, macrophages, dendritic cells), tumor load, survival and bone disease were elucidated using immunocompetent 5TMM models.
Results Tasquinimod treatment significantly decreased myeloma cell proliferation and colony formation in vitro, associated with an inhibition of c-MYC and increased p27 expression. Tasquinimod-mediated targeting of the myeloid cell population resulted in increased T cell proliferation and functionality in vitro. Notably, short-term tasquinimod therapy of 5TMM mice significantly increased the total CD11b+ cells and shifted this population toward a more immunostimulatory state, which resulted in less myeloid-mediated immunosuppression and increased T cell activation ex vivo. Tasquinimod significantly reduced the tumor load and increased the trabecular bone volume, which resulted in prolonged overall survival of MM-bearing mice in vivo.
Conclusion Our study provides novel insights in the dual therapeutic effects of the immunomodulator tasquinimod and fosters its evaluation in combination therapy trials for MM patients.
- Immunotherapy
- Hematologic Neoplasms
- Myeloid-Derived Suppressor Cells
- Immunomodulation
Data availability statement
All data relevant to the study are included in the article or uploaded as online supplemental information.
This is an open access article distributed in accordance with the Creative Commons Attribution Non Commercial (CC BY-NC 4.0) license, which permits others to distribute, remix, adapt, build upon this work non-commercially, and license their derivative works on different terms, provided the original work is properly cited, appropriate credit is given, any changes made indicated, and the use is non-commercial. See http://creativecommons.org/licenses/by-nc/4.0/.
Statistics from Altmetric.com
WHAT IS ALREADY KNOWN ON THIS TOPIC
Tasquinimod is a new immunomodulatory treatment for multiple myeloma (MM) that is in phase I/II clinical evaluation in patients with relapsed/refractory MM.
WHAT THIS STUDY ADDS
Our study provides novel insights in the dual therapeutic effects of the immunomodulator tasquinimod, targeting both the tumor cells and its suppressive microenvironment to hamper MM progression.
HOW THIS STUDY MIGHT AFFECT RESEARCH, PRACTICE OR POLICY
This study elucidates the mechanism of action of tasquinimod and fosters its evaluation in combination therapy trials for MM patients.
Introduction
Multiple myeloma (MM) is a rare B cell malignancy, characterized by the uncontrolled growth of malignant plasma cells in the bone marrow.1 The complex crosstalk between plasma cells and immune cell populations makes the MM bone marrow niche an immunosuppressive environment favoring MM cell growth, survival, and drug resistance.2–4 Several immunotherapeutic approaches including monoclonal antibodies, antibody-drug conjugates, bispecific antibodies, and chimeric antigen receptor T cell therapy emerged as promising therapies for MM patients.5 6 However, efficacy and long-term anti-MM T cell responses are suggested to be hampered by the presence of a strong immunosuppressive environment.7 8
Tasquinimod is a small-molecule oral inhibitor and a second-generation quinoline-3-carboxamide compound.9 Tasquinimod binds the inflammatory protein S100A9 and inhibits its interaction with the proinflammatory toll-like receptor 4 (TLR4) and receptor of advanced glycation end products (RAGE).10 11 Besides its high affinity for S100A9, binding of tasquinimod to histone deacetylase 4 (HDAC4) and modulation of the thrombospondin-1 protein has been demonstrated as well.12 13 Originally tested for the treatment of prostate cancer, tasquinimod exerts immunomodulatory, antiangiogenic and antimetastatic effects in various preclinical cancer models.13 14 While S100A9 expression is low/absent on MM cells, previous work by our group demonstrated the abundant expression of S100A9 by myeloid-derived suppressor cells (MDSCs) in the bone marrow niche and identified this cell population as a key regulator of MM progression.15 A better understanding of the direct and indirect anticancer effects of tasquinimod is critical to predict its clinical impact and propose new combination therapies for MM patients.
In this study, we evaluated the effect of tasquinimod on MM cells, myeloid cells (including MDSCs, macrophages, and dendritic cells (DCs)) and T cell activation using in vitro co-culture assays and in vivo short-term treatment of myeloma-bearing mice. We aimed to provide more mechanistic insights into the observed tasquinimod-mediated antitumor effects. Effects on tumor growth, bone disease and survival were further evaluated in immunocompetent MM models.
Material and methods
Animals
C57BL/KaLwRij mice were purchased from Envigo (Horst, The Netherlands).
Cell culture
Three human MM cell lines (LP-1, OPM-2, RPMI-8226) and murine myeloma cell lines (5TGM1, 5TGM1-eGFP, 5T33MMvt) were cultured in RPMI-1640 medium (Gibco; Thermo Fisher Scientific, Waltham, Massachusetts, USA) supplemented with 10% fetal bovine serum (FBS) (Biochrom AG, Berlin, Germany), 100 U/mL penicillin, 100 µg/mL streptomycin and 2 mM L-glutamine (Lonza, Basel, Switzerland). The human stromal cell line HS-5 was cultured in DMEM medium supplemented with 10% FBS, 1% sodium pyruvate, 1% MEM NEAA (Thermo Fisher Scientific), 100 U/mL penicillin, 100 µg/mL streptomycin and 2 mM L-glutamine. The human MM cell lines LP-1, OPM-2, RPMI-8226 and HS-5 cells were obtained from ATCC (Molsheim, France) and identity of the cell lines was yearly validated by short-tandem repeat analysis. Cell lines were regularly tested for mycoplasma contamination and passaged no more than 1 month prior to experiments (#LT07-418, Lonza, USA).
Compounds
For in vitro experiments, tasquinimod was purchased from Sigma-Aldrich (Diegem, Belgium) and dissolved in dimethylsulfoxide at a stock concentration of 5 mM. For the final concentration, we chose the concentrations 10 µM and 25 µM. For in vivo experiments, tasquinimod was kindly provided by Active Biotech AB (Lund, Sweden) and was administered orally via the drinking water at a dose of 30 mg/kg.
Cell proliferation and apoptosis assay
MM cell lines were cultured at a concentration of 5.0×10⁵ cells/mL and HS-5 cells were seeded at a concentration of 1.0×10⁵ cells/mL. Cells were treated with increasing concentrations of tasquinimod (10, 25 µM) for 24 hours, 48 hours, 72 hours and 120 hours. A 1 mg/mL bromodeoxyuridine (BrdU) (#B5002, Sigma) was added 4 hours before sample collection. Samples were washed with FACS flow and stained for 10 min with paraformaldehyde at 4°C. The cells were incubated overnight in PBS (Gibco) 0.2% Tween (Sigma-Aldrich) at room temperature, washed twice with FACS flow, stained for 30 min with 2 M HCl and washed with both FACS flow and a mixture of PBS + 0.5% Triton X (Sigma-Aldrich) + 10% FBS. Cells were then stained with 3 µL of anti-BrdU-Fluorescein (#112022693011, Sigma-Aldrich) in 50 µL of PBS + 0.5% Triton X+ 10% FBS and incubated in the dark for 30 min. After a washing step, the percentage of BrdU+ cells was detected by flow cytometry using the FACS Canto flow cytometer (BD Biosciences, Belgium). Apoptosis was measured by flow cytometry using Annexin-V and 7-aminoactinomycin D staining (BD Biosciences, Erembodegem, Belgium).
Colony-forming unit assay
Clonogenic potential of human MM cell lines was assessed through colony growth in MethoCult media (H4230, M3231, STEMCELL Technologies, Canada) in the presence of dimethylsulfoxide (control) or tasquinimod. Briefly, LP-1 and 5TGM1 cells (2000 cells/well) were treated with different concentrations of tasquinimod (10, 25 µM). Each plate contained RPMI-1640 media consisting of Methylcellulose-Based Media, 10% FBS, 100 U/mL penicillin and 100 µg/mL streptomycin. Plates were incubated at 37°C, 5% CO2 for 14 days. The colonies were photographed using the EVOS M7000 Imaging System (Thermo Fisher Scientific).
RNA sequencing and analysis
LP-1 cells were cultured for 6 hours and 24 hours with or without 25 µM of tasquinimod. Total RNA was extracted and purified using the NucleoSpin RNA plus kit (Macherey-Nagel, Düren, Germany). Sample quality was checked by calculating the RNA integrity number (RIN value) using fragment analyser (Agilent). The RNA sequencing (RNA-seq) library preparation was performed with 150 ng RNA using the Illumina KAPA RNA HyperPrep kit with RiboErase (HMR) (Illumina, Cambridge, UK). Paired-end RNA-seq (2*100 bp) was done with an Illumina NovaSeq 6000 seqencing instrument (Illumina, Cambridge, UK) and read pairs were mapped to the human GRCh37 reference genome using the STAR alignment algorithm.16 All statistical analyses were performed with the statistics software R (V.4.1.2) and R packages obtained though the BioConductor project (https://www.bioconductor.org).17 The expression level of each gene was summarized and normalized using DESeq2 R/Bioconductor package and differential expression analysis was performed using DESeq2 pipeline.18 P values were adjusted to control the global false discovery rate (FDR) across all comparisons with the default option of the DESeq2 package. Genes were considered differentially expressed if they had an adjusted p value equal or lower than 0.05 and a fold change of more or equal to 2. Pathway enrichment analyses were performed using online curated gene set collection on the Gene Set Enrichment Analysis software (GSEA) (Broad Institute, UC San Diego). GSEA was performed to determine differentially expressed genes that were enriched in gene lists extracted from human MSigDB database V.2022.1 to determine enrichment in gene sets from the hallmark gene sets. Raw data files are available in the public data repository ‘ArrayExpress’ (Accession number: E-MTAB-11787).
Western blot
MM cells were cultured at a density of 5.0×10⁵/ mL and were treated with tasquinimod for 6 hours and 24 hours. Cells were lysed in cell lysis buffer including protease (Roche) and phosphatase inhibitors (Sigma). Western blot analysis on these cell lysates was performed as previously described.19 The following primary antibodies were used: mouse-anti p-STAT3 (Y705) (#9145), p-STAT3 (S727) (#9138), rabbit-anti STAT3 (#4094), c-MYC (#5605), p27 Kip1(#3688), HDAC4 (#2072), α-TUBULIN (#2144), β-ACTIN (#4907) and horseradish peroxidase (HRP)-coupled anti-rabbit (#7074) and anti-mouse (#7076) secondary antibodies; all purchased from Cell Signaling Technology (Boston, Massachusetts, USA). The bands were visualized and captured using Pierce ECL Western Blot Substrate (Thermo Scientific) and Li-Cor Odyssey Fc (Bad Homburg, Germany). Pixel densities were quantified using Image J.
RNA isolation and real-time PCR
The total RNA was isolated by RNeasy mini kit (QIAGEN, Hilden, Germany) and converted to cDNA by the Verso cDNA Synthesis Kit (Thermo Fisher Scientific, Waltham, Massachusetts, USA). Expression level of mRNA was quantified by Real-time PCR with PowerUp SYBR Green Master Mix (Thermo Fisher Scientific) using the ABI 7900TH Real-time PCR System (Applied Biosystems). ABL was included as an internal control. Relative mRNA expression normalized to ABL was carried out using the 2-ΔΔCt method. Gene specific primers were purchased at Integrated DNA Technologies (Leuven, Belgium). Primer sequences are listed in online supplemental table S1.
Supplemental material
Magnetic activated cell sorting of bone marrow derived CD11b+ cells
Bone marrow was flushed from the femurs, tibiae and humeri of naïve and diseased mice; followed by red blood cell lysis. CD11b+ cells were isolated by magnetic activated cell sorting using human/mouse CD11b MACS Beads (Miltenyi Biotec, Bergisch Gladbach, Germany) according to the manufacturer’s instructions.
Flow cytometry analysis
The antibodies used for all experiments included CD11b-APCCy7 (#101226), Ly6G-PECy7 (#127618), CD3-APCCy7 (#100330), F4/80-APC (#123116), CD206-PE (#141706), MHCII-PE (#107647), MHCII-PECy7 (#107629), CD11c-APC (#117309), CD86-PECy7 (#105014) from Biolegend (Biolegend, San Diego, California, USA) and Ly6C-APC (#560595) from BD (BD Biosciences, UK). BD FACSDiva Software (Becton Dickinson) was used to acquire data. Analysis of data involved postacquisition gating using FlowJo software (Tree Star: Ashland, Oregon, USA).
T cell proliferation assay
To assess T cell proliferation in vitro, spleens were isolated from naïve C57BL/KaLwRij mice, followed by red blood cell lysis. Mononuclear cells (2.0×10⁶/mL) were stained by carboxyfluorescein succinimidyl ester (CFSE) (0.1 µM/L) (Invitrogen, Carlsbad, California, USA) for 10–15 min at 37°C, centrifuged and resuspended in RPMI-1640 supplemented with 10% FBS, 10% HEPES (Sigma), 1% sodium pyruvate, 1% MEM NEAA and 20 µM β-ME (Sigma). T cells were cocultured with CD11b+ cells at different ratios and stimulated with 2 µL Dynabeads Mouse T-Activator CD3/CD28 (Invitrogen) and tasquinimod (25 µM) in MM conditioned medium for 72 hours. Conditioned medium was prepared from 5TGM1 cells, cultured for 48 hours in RPMI-1640 medium (with 10% FBS, 100 U/mL penicillin, 100 µg/mL streptomycin and 2 mM L-glutamine) at a density of 1×10⁶ cells/mL. T cell proliferation was detected by flow cytometric CFSE dilution after CD3-APCCy7 staining.
For the ex vivo T cell proliferation assay, naïve-derived splenic T cells were cocultured with CD11b+ cells isolated from tasquinimod treated and untreated 5TGM1 MM-bearing mice (n=5). As described previously, T cells were cultured with different ratios CD11b+ cells for 72 hours, in the presence of CD3/CD28 microbeads. After staining by CD3-APCCy7, T cell proliferation assay was performed using flow cytometry.
IFN-γ determination by ELISA
Supernatant was collected from the T cell proliferation assays and was analyzed for IFN-γ secretion by ELISA. Serum collected from the blood of the 5TGM1 model and 5T33MM models was subjected to an IFN-γ ELISA. ELISA was carried out according to the manufacturer’s instructions (#88-7314-88, Invitrogen).
In vivo experiments
For in vivo experiments, the sample size was calculated using G*Power. The 5TGM1 model is propagated by intravenous injection of 1.0×10⁶ 5TGM1-eGFP cells into 6–8 weeks old female C57BL/KaLwRij mice.20 21 For the 5T33MM mouse model, the 5T33MMvv cell line originated spontaneously in elderly C57BL/KaLwRij mice and have since been propagated in vivo by intravenous transfer of the diseased bone marrow (5.0×10⁵ cells/mouse) into young syngeneic mice.20 The treatment group (n=10/group) received tasquinimod (30 mg/kg in daily drinking water) from day 1 after tumor cell inoculation. When the mice showed signs of disease (eg, hind-limb paralysis), all mice were sacrificed. For short-term exposure (n=5/group), 5TGM1 mice were treated with/without tasquinimod for 10 days.
Tumor load was assessed using flow cytometry (GFP+ in the bone marrow, 5TGM1 model) or by cytosmear staining with May-Grünwald Giemsa (% plasmacytosis in the bone marrow, 5T33MM model). In addition, M-protein in the blood was determined by means of serum electrophoresis. Immune cell populations were evaluated by flow cytometry. One femur from the 5TGM1 model was dissected and stored in 70% EtOH for micro-CT analysis. Micro-CT was performed on distal femurs of mice with the Skyscan 1172 system (Bruker, Kontich, Belgium) as described previously.22 To determine the effect of tasquinimod on survival (n=10/group), a similar experiment was performed in the 5TGM1 model. Treatment continued until each animal showed signs of morbidity, namely hind-limb paralysis, at which point they were sacrificed.
Statistical analysis
Results were analyzed with GraphPad Prism V.9 software (GraphPad Software, La Jolla, California, USA). A Mann-Whitney U test and Unpaired t-test was used to compare two groups, One-way analysis of variance was used to compare multiple groups. For the survival study, a Kaplan-Meier analysis and log-rank test was performed. All data represent the mean±SD. *p<0.05; **p<0.01; ***p<0.001, ****p<0.0001 were considered statistically significant.
Results
Tasquinimod directly inhibits the proliferation and c-MYC expression in human MM cell lines
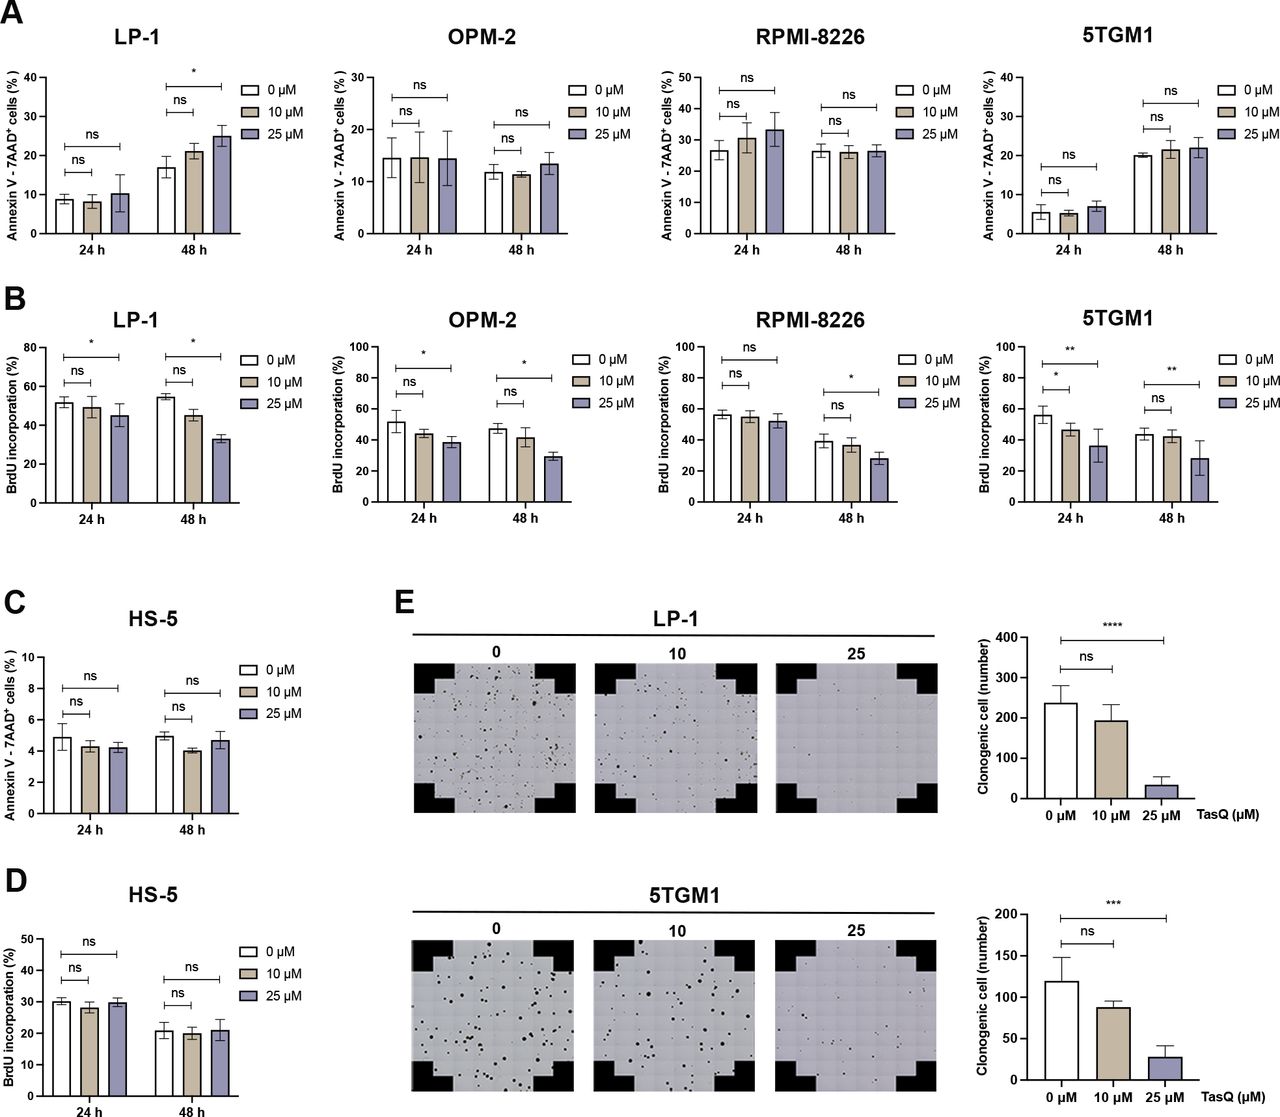
To evaluate the direct antitumor effect of tasquinimod in MM, different human myeloma cell lines (LP-1, OPM-2 and RPMI-8226) and the murine 5TGM1 cell line were incubated with increasing concentrations of tasquinimod for 24 hours, 48 hours, 72 hours and 120 hours. While tasquinimod had no effect on the number of apoptotic MM cells (figure 1A, online supplemental figure S1A,C), a significant decrease could be found in the percentage of proliferating MM cells (figure 1B, online supplemental figure S2). Furthermore, no effect could be observed on the apoptosis and proliferation of stromal HS-5 cells after tasquinimod treatment (figure 1C,D, online supplemental figure S2B). Using a colony-forming unit assay, we demonstrated a significant reduction in the number of colonies after 14 days in the presence of tasquinimod (figure 1E). Altogether, these data indicate that tasquinimod inhibits MM cell growth and proliferation in vitro.

Tasquinimod inhibits MM cell proliferation and reduces colony formation in vitro. (A) Apoptosis was analyzed by flow cytometry using Annexin V/7-AAD staining of tasquinimod-treated MM cell lines including LP-1, OPM-2, RPMI-8226 and 5TGM1 at indicated concentrations for 24 and 48 hours (n=3). (B) Cell proliferation of tasquinimod-treated MM cells (10, 25 µM) was investigated using BrdU staining at 24 hours and 48 hours. Various human MM cell lines were tested including LP-1 (n=3), OPM-2 (n=3), RPMI-8226 (n=4) and 5TGM1 (n=5). (C) Apoptosis and cell proliferation of the human stromal cell line HS-5 treated/untreated with tasquinimod (10, 25 µM) was detected by Annexin V/7-AAD (n=3) and BrdU staining (n=4). (D) Methylcellulose colony formation assays were used for LP-1 and 5TGM1 cell lines treated with vehicle or tasquinimod (10, 25 µM) for 14 days. Quantification of colony numbers was also shown (n=4). *p<0.05, **p<0.01, ***p<0.001, ****p<0.0001, Mann-Whitey U test, Error bars indicate SD. 7-AAD, 7-aminoactinomycin D; MM, multiple myeloma; ns, not significant.

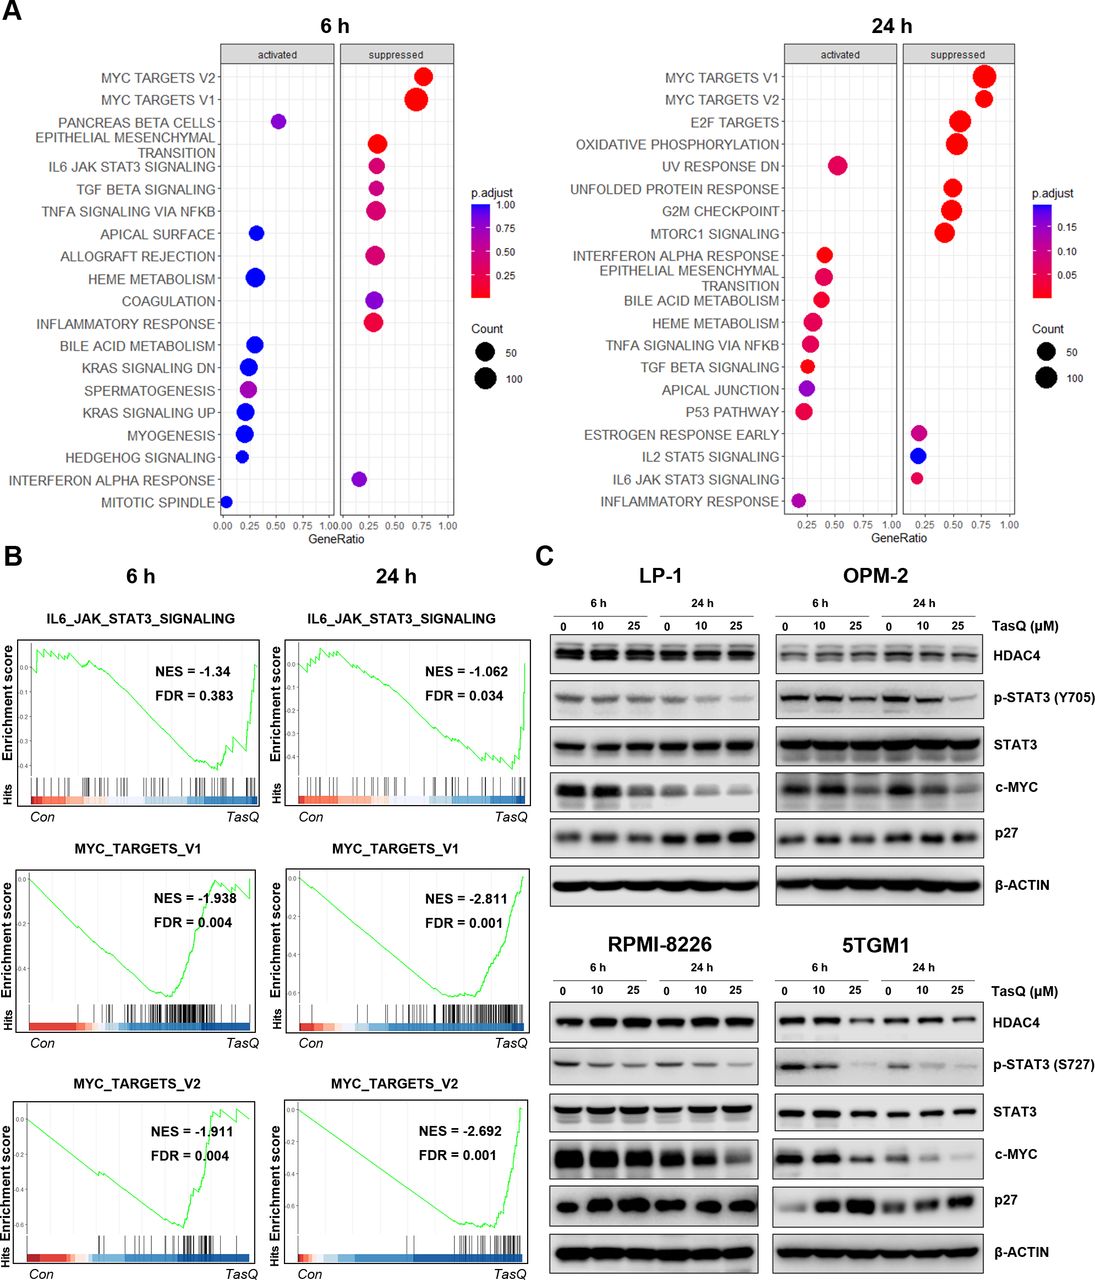
Tasquinimod-mediated downregulation of c-MYC expression in MM cells in vitro. (A) The bubble plot shows the top 20 differentially regulated (activated/suppressed) pathways in the tasquinimod-treated group compared with the control group (6, 24 hours) (n=3). (B) Gene set enrichment analysis (GSEA) of the IL6-JAK-STAT3 and MYC targets V1, V2 gene signature in LP-1 cells after treatment with either 25 µM of tasquinimod or DMSO for 6 hours and 24 hours. GSEA of differentially expressed genes was determined by querying the MSigDB. False discovery rate (FDR) and normalized enrichment scores (NES) are indicated (n=3). (C) LP-1, OPM-2, RPMI-8226 and 5TGM1 cells were cultured with tasquinimod (TasQ) (10, 25 µM) for 6 hours and 24 hours. Whole-cell lysates were subjected to Western blot using HDAC4, anti-Phospho-Stat3 (Tyr705, S727), anti-Stat3, anti-c-MYC, anti-p27 Kip and anti-β-Actin antibodies (n=5). HDAC4, histone deacetylase 4.
To obtain further mechanistic insights into the tasquinimod-mediated antiproliferative effect of MM cells, we performed RNA sequencing of LP-1 cells, treated with tasquinimod for 6 hours and 24 hours. We found 9 upregulated and 21 downregulated genes after 6 hours of tasquinimod treatment, which increased to 35 upregulated and 47 downregulated genes at 24 hours (online supplemental table S2). Gene Ontology analysis revealed a consistent upregulation of genes involved in migration, metabolism and proliferation (online supplemental figure S3). To further investigate the essential regulatory genes in the antitumor mechanism of tasquinimod, we performed gene set enrichment analysis (GSEA) on RNA-seq data (figure 2A). Interestingly, the gene sets of IL6-JAK-STAT3 and MYC targets were significantly less enriched in the tasquinimod-treated group than in the control group (figure 2B). Using western blot, we confirmed a significant downregulation in p-STAT3 (Y705, S727) and c-MYC levels after tasquinimod treatment in all tested cell lines (figure 2C, online supplemental figure S4). These effects were also associated with increased expression of cyclin dependent kinase inhibitor p27 Kip1, most clearly observed in LP-1 (24 hours), RPMI-8226 (6 hours) and 5TGM1 (6 hours, 24 hours) cells.

Tasquinimod reduces the MDSC suppressive capacity and increases T cell proliferation in vitro. (A) MACS sorted CD11b+ BM cells were cocultured in the presence of 5TGM1 MM conditioned medium, CD3/CD28 microbeads and splenic CFSE-labeled T cells of naive mice with/without tasquinimod (TasQ). MDSC and T cells were cocultured at a ratio of 1/4, 1/2 and 1/1, respectively. After 72 hours, T cell proliferation was analyzed using flow cytometry (n=8, Mann-Whitey U test). (B) Supernatant was collected from this assay and IFN-γ was analyzed by ELISA (n=8, Mann-Whitey U test). (C) CD11b+ cells were sorted from the BM of the 5TGM1MM model and treated with vehicle or tasquinimod for 24 hours. The mRNA level of genes was measured with RT-qPCR and calculated with the ΔΔC. The data are expressed relative to their respective controls set to 1 (n=5, unpaired t-test). (D) The CD11b+ F4/80+ population and M2 macrophage subset (CD11b+ F4/80+ CD206+) were detected by flow cytometry (n=5, Mann-Whitey U test). *p<0.05, **p<0.01, ****p<0.0001. Error bars indicate SD. BM, bone marrow; CFSE, carboxyfluorescein succinimidyl ester; MACS, magnetic-activated cell sorting; MDSC, myeloid-derived suppressor cell; MM, multiple myeloma.

Short-term tasquinimod treatment of 5TMM mice modulates the myeloid cell phenotype and increases T cell activation. (A) 6-week-old C57BL/KaLwRij mice were inoculated with 1.0×10⁶ 5TGM1-eGFP cells on day 0 and treatment with tasquinimod (TasQ, 30 mg/kg in daily drinking water) started on day 1 (n=5/group). At day 10, all mice were sacrificed to investigate immune cell populations using flow cytometry. (B) The effect of tasquinimod on the percentage of CD11b+ cells in tasquinimod-treated mice compared with vehicle mice. (C) The percentage of monocytic MDSCs (M-MDSCs) (CD11b+, Ly6G-) and granulocytic MDSCs (G-MDSCs) (CD11b+, Ly6G+) in tasquinimod-treated mice compared with vehicle mice. (D) In the CD11b+Ly6Glow population three MDSC subtypes were distinguished based on Ly6C (Ly6Chi inflammatory monocytes (MO), Ly6Cintermediate eosinophils, and Ly6Clow immature myeloid cells (IMC)). (E) The percentage F4/80+ cells within the CD11b+ cell population in vehicle and tasquinimod-treated mice. (F) Frequency of CD11b+ F4/80+ MHCII+ cells (M1 like) and CD11b+ F4/80+ MHCII- CD206+ cells (M2 like) in the 5TGM1 model±tasquinimod treatment for 10 days. (G) Percentage of total CD11c+ cells. (H) Percentage of CD86+ MHCII+ CD11c+ cells in 5TGM1 model±tasquinimod treatment for 10 days. (I) CD11b+ cells were sorted from the BM of 5TGM1 mice treated with tasquinimod or vehicle, followed by western blot for p-Stat3. (J) T cells were stimulated with CD3/CD28 in the presence of CD11b+ cells from mice treated with tasquinimod or vehicle (at indicated ratios) and proliferation was measured by CFSE incorporation using flow cytometry. (K) IFN-γ ELISA of supernatant of naïve spleen cells cocultured with BM CD11b+ cells of mice treated with tasquinimod or vehicle (n=5/group). *p<0.05, **p<0.01, Mann-Whitey U test, Error bars indicate SD. BM, bone marrow; CFSE, carboxyfluorescein succinimidyl ester; MACS, magnetic-activated cell sorting; MDSCs, myeloid-derived suppressor cells.
As we previously found low to absent expression of S100A9 in MM cells, we analyzed the expression of HDAC4, another molecular target of tasquinimod which was also previously linked to c-MYC expression in primary patient samples and human MM cell lines.23 24 HDAC4 is expressed in MM cell lines and bone marrow plasma cells, at all stages of disease progression, and correlates with an adverse prognosis in newly diagnosed MM patients (online supplemental figure S5A-C). HDAC4 expression was decreased after tasquinimod treatment in the murine 5TGM1 cells, while it remained stable in the human MM cell lines (figure 2C). This result could be explained by the allosteric binding of tasquinimod to the regulatory Zn2+ binding domain of HDAC4 that locks the protein in a conformational state.12 To evaluate whether the decrease in c-MYC could be associated with the targeting of HDACs, we treated MM cells with a class I/II HDAC inhibitor panobinostat and observed a similar reduction in pSTAT3 and c-MYC expression in MM cell lines (online supplemental figure S5).Taken together, these results indicate that the tasquinimod-mediated HDAC4-c-MYC targeting could be a promising therapeutic approach for MM patients.

Tasquinimod decreases tumor burden and significantly prolongs median survival of 5TMM mice. (A) 6-week-old C57BL/KaLwRij mice were inoculated with 1.0×10⁶ 5TGM1-eGFP cells on day 0 for the 5TGM1 model (n=10/group). Six-week-old C57BL/KaLwRij mice were inoculated with 1.0×10⁶ 5T33 vv cells on day 0 for the 5T33MM model (n=10/group). Treatment with tasquinimod (30 mg/kg in daily drinking water) started on day 1. At day 35 (5TGM1 model) or 21 (5T33MM model) all mice were sacrificed. (B) In the 5TGM1 model, teGFP expression was analyzed using flow cytometry to determine the number of tumor cells in the bone marrow. For the 5T33MM model, tumor load was assessed using May-Grunwald Giemsa-stained cytosmears of mononuclear bone marrow cells and the percentage plasma cells was calculated. (C) The M protein was analyzed by serum electrophoresis. (D) MM cells were MACS sorted from the bone marrow of vehicle and tasquinimod-treated mice and c-MYC levels were detected via western blot. (E) Serum IFN-γ concentration in the 5T33MM model was detected using ELISA. (F) Kaplan-Meier survival curves for the 5TGM1 mice treated with/without tasquinimod (n=10/group). **p<0.01, ****p<0.0001, Mann-Whitney U test. Error bars indicate SD. MM, multiple myeloma.
Tasquinimod reduces the MDSC suppressive capacity and increases T cell proliferation in vitro
MDSCs are a suppressive population in the MM bone marrow microenvironment and are a major target to re-establish T cell activity, particularly in the context of immunotherapeutic approaches.25 As we previously demonstrated a high S100A9 expression in MDSCs, we investigated the effect of tasquinimod on MDSC-mediated immune suppression using a T cell proliferation assay.15 Bone marrow derived myeloid cells (CD11b+) were cocultured with spleen cells at different ratios in MM conditioned medium (derived from 5T33 and 5TGM1 MM cel lines), and T cells were stimulated for 72 hours using anti-CD3/CD28 microbeads. Tasquinimod significantly increased the % CD3+ T cells and T cell proliferation at a 1/2 and 1/4 ratio (MDSCs:T), which was associated with increased IFN-γ secretion (figure 3A,B, online supplemental figure S6A-C). Tasquinimod-treated T cells, without MDSCs, demonstrated a reduced proliferative capacity; indicating that the tasquinimod-mediated effect on T cell activation is solely mediated by targeting the MDSC’s suppressive function (figure 3A). Interestingly, we could not observe any direct effect of tasquinimod on the cell viability of MM derived MDSCs (online supplemental figure S7)

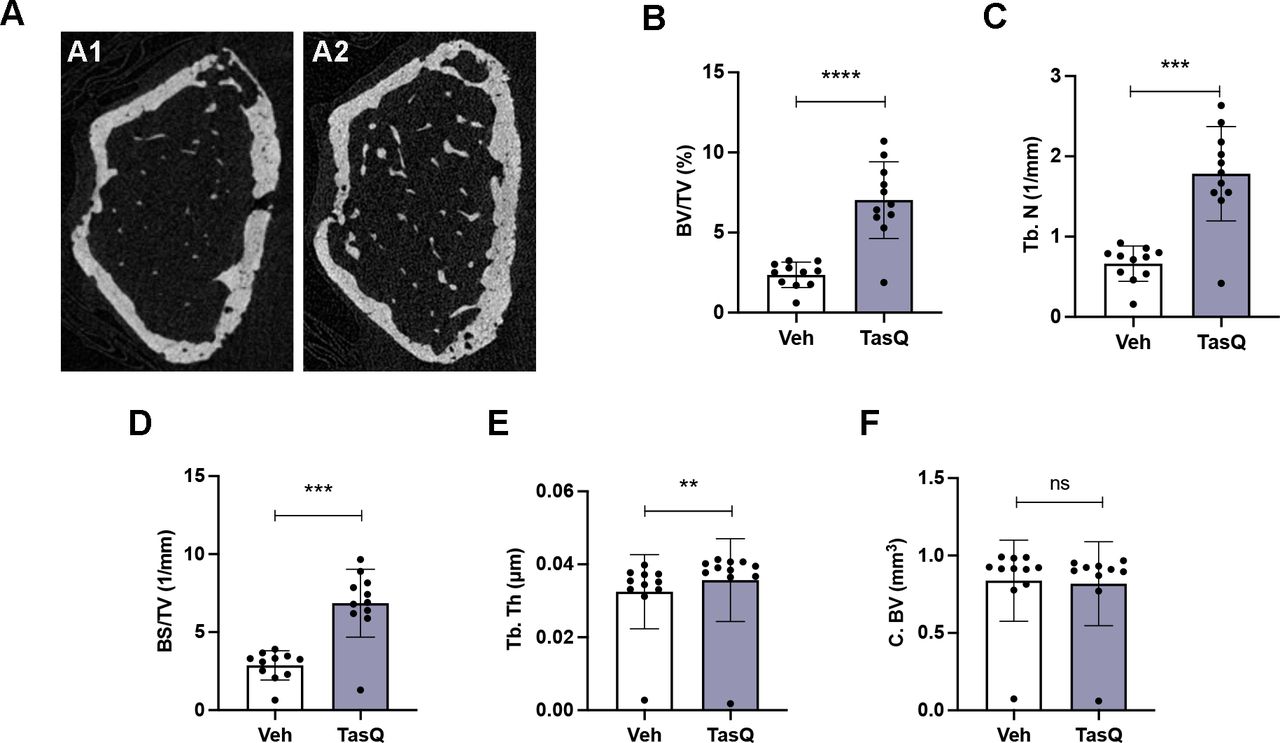
Tasquinimod therapy resulted in increased trabecular bone volume in vivo. (A) Three-dimensional reconstructions of micro-CT scans of the representative femur from vehicle (A1) and tasquinimod-treated 5TGM1 mice (A2). (B) Percentage of bone volume over total volume or bone volume fraction (BV/TV). (C) Trabecular number (Tb.N). (D) Surface density (BS/TV). (E) Trabecular thickness (Tb. Th). (F) Cortical bone volume (C. BV). **p<0.01, ***p<0.001, ****p<0.0001, Mann-Whitney U test. Error bars indicate SD, n=10 per group.
As monocytic MDSCs, in contrast to monocytes, are described to differentiate into immunosuppressive macrophages and are associated with elevated S100A8/A9 proteins, we evaluated the effect of tasquinimod on macrophage differentiation markers (figure 3C, online supplemental figure S6D). Twenty-four hours after tasquinimod treatment of MM derived myeloid cells (CD11b+), we observed a significant decrease in the M2 macrophage markers Arginase-1 (Arg1) and Stabilin-1 (Stab1). Stab1 is a scavenger receptor which has been reported to be expressed by tumor-associated macrophages. Moreover, tasquinimod significantly reduced IL-10 expression, which is a well-known anti-inflammatory cytokine that induces immunosuppression and is associated with M2 polarization.26 27 Using flow cytometry on tasquinimod-treated myeloid cells, we observed a decrease in CD206 expression within the macrophage population (CD11b+ F4/80+), again confirming a shift in their polarization state (figure 3D).
Since tasquinimod reduced IL-10 expression, a cytokine reported to dictate the immunosuppressive function of MDSC, we further evaluated the impact of recombinant IL-10 on tasquinimod-mediated T cell proliferation in vitro. We found that the addition of IL-10 significantly hampered the T cell proliferating capacity, particularly at the 1/1 MDSC-T cell ratio (online supplemental figure S8A).
To evaluate whether the immunomodulating effect of tasquinimod could be mediated by HDAC4 targeting, we repeated the same T cell proliferation assay with/without HDAC inhibitor panobinostat. Although panobinostat was able to increase T cell proliferation in the presence of MDSC; we could clearly observe a more pronounced T cell proliferative effect in coculture assays with tasquinimod (online supplemental figure S8B). These data suggest that both HDAC4 and S100A9 targeting in myeloid cells could be responsible for the increased T cell proliferation in vitro.
Altogether, these data demonstrate a clear effect of tasquinimod on the myeloid cell phenotype and function, resulting in a reduced immunosuppressive capacity and increased T cell activating potential.
Short-term tasquinimod treatment of 5TMM mice modulates the myeloid cell phenotype and increases T cell activation
To evaluate whether the observed in vitro effects on myeloid cells could also be found in vivo, 5TGM1 MM mice were treated for a 10-day period with 30 mg/kg tasquinimod (figure 4A). Mice were treated at an early stage after MM cell inoculation (at day 1), as we know the myeloid cell population is already skewed toward an immunosuppressive phenotype the first week after MM injection.23 Various myeloid cell subtypes were investigated by flow cytometry including monocytic myeloid cells (CD11b+, Ly6G-, Ly6Chigh, intermediate, low), granulocytic myeloid cells (CD11b+, Ly6G+), macrophages (CD11b+, F4/80+, CD206/MHCII) and DCs (CD11c+, CD86/MHCII+) (online supplemental figure S9).28 Short-term tasquinimod therapy did not result in an altered homing of the MM cells to the bone marrow (online supplemental figure S10), however, we could clearly observe a significant increase in the total percentage of CD11b+ cells (figure 4B). While the monocytic and immature myeloid cell population (CD11b+, Ly6G-, Ly6Clow) slightly decreased (figure 4C,D), we observed an increase in the macrophage population (CD11b+, F4/80+), which displayed a more M1-like proinflammatory phenotype (MHCII+) and a reduced expression of M2 marker CD206 (figure 4E,F). As STAT3 signaling in myeloid cells is linked to their immunosuppressive capacity, we analyzed this specific signaling pathway on bone marrow derived MACS-sorted CD11b+ cells. CD11b+ cells of tasquinimod-treated mice demonstrated reduced p-STAT33 expression compared with control CD11b+ cells (figure 4I). Moreover, tasquinimod significantly increased the DC maturation marker MHC class II and costimulatory molecule CD86, suggesting a more mature phenotype of DCs (figure 4G,H).
To investigate whether in vivo tasquinimod therapy could inhibit the immunosuppressive capacity of myeloid cells, CD11b+ cells were isolated from vehicle and tasquinimod-treated MM-bearing mice followed by a T cell proliferation assay. T cells cocultured in vitro with MDSCs of tasquinimod-treated mice showed an increase in T cell proliferation that was accompanied by an increased IFN-γ secretion compared with T cells cocultured in vitro with MDSCs of vehicle-treated mice (figure 4J,K).
Tasquinimod decreases tumor burden and significantly prolongs median survival of 5TMM mice
To address the impact of tasquinimod on tumor load and survival in vivo, we used the 5TGM1 and 5T33 immunocompetent murine models, characterized by a moderate (±35 days) and rapid (±21 days) tumor growth in the bone marrow respectively. Daily treatment with tasquinimod (30 mg/kg) resulted in a significant reduction in tumor load in both 5TGM1 (reduced GFP+ tumor cells) and 5T33MM mice (reduction in % bone marrow plasmacytosis) (figure 5A,B). In addition, we observed a decrease in the serum M-protein levels of tasquinimod-treated mice compared with vehicle mice in the 5TGM1 model (figure 5C). As c-MYC downregulation was previously associated with the direct anti-MM effects of tasquinimod in vitro, we investigated c-MYC expression in purified MM cells from vehicle and tasquinimod-treated 5TGM1 and 5T33 myeloma mice (>90% purity of MM cells). Interestingly, our data confirmed a tasquinimod-mediated downregulation of c-MYC expression in the tumor cells of both models, potentially linked to HDAC4 targeting (figure 5D). In addition, we detected a significant increase in IFN-γ levels in tasquinimod-treated 5T33MM mice, indicative for increased T cell activation (figure 5E).
In a last step, we also investigated the impact of tasquinimod therapy on the survival of MM-bearing mice. 5TGM1-eGFP mice were treated as described above and animals were sacrificed when they showed humane endpoint signals (eg, significant weight loss, hindlimb paralysis). The median survival of animals receiving tasquinimod therapy significantly increased compared with the control group (36 days for tasquinimod vs 31 days for vehicle group, p<0.001), again illustrating its therapeutic potential in MM (figure 5F).
Tasquinimod therapy resulted in increased trabecular bone volume in vivo
As S100A8/S100A9 expression has been linked to increased bone resorptive activity of mature osteoclasts, but reduced monocyte-to-osteoclast differentiation29; we assessed the impact of tasquinimod therapy on osteolytic lesions. Comparable to the human situation, 5TGM1 MM mice develop lytic bone lesions which can be visualized radiographically using micro-CT (figure 6A). Tasquinimod-treated mice demonstrated an increased bone volume fraction (BV/TV) (figure 6B), trabecular number (Tb.N.) (figure 6C), surface density (BS/TV) (figure 6D) and trabecular thickness (Tb.Th.) (figure 6E), while no effect could be observed on the cortical bone volume (C.BV.) (figure 6F).
These data provide evidence for the use of S100A9 inhibitor tasquinimod in the treatment of MM-induced bone disease, particularly mediated by effects on the trabecular bone mass.
Discussion
We demonstrate here the dual therapeutic effects of the small molecule inhibitor tasquinimod in MM, by remodeling the immunosuppressive microenvironment and by directly targeting MM cell proliferation. We found that tasquinimod reduced the proliferation and colony growth of MM cells, in an S100A9-independent manner, which was associated with a downregulation of pSTAT3 and c-MYC. Additionally, we observed a shift in the immune cell phenotypes, including an increase in M1-like proinflammatory macrophages (MHCII+) and mature DCs, along with increased T cell activation; illustrating its immune activating capacity. Moreover, using immunocompetent mouse models, we demonstrated the therapeutic potential of tasquinimod in MM, illustrated by a reduction in tumor load, increased bone volume and prolonged survival of MM-bearing mice.
Our findings provide new insights on how tasquinimod modulates the bone marrow niche and directly affects tumor progression in MM. Prior research in solid tumors already demonstrated an impact of tasquinimod on immune activation through modulation of the tumor microenvironment. In both a melanoma and prostate cancer model, they found that tasquinimod reduced the number of tumor-infiltrating MDSCs and M2 polarized macrophages, and was able to impair their suppressive capacity.30 31 The switch in macrophage polarization was also observed in the 4T1 breast cancer model, where tasquinimod significantly reduced the development of lung metastasis.32 In contrast to solid tumors, we observed a clear increase in the total number of CD11b+ cells after short-term and long-term treatment with tasquinimod in MM-bearing mice. Notably, this increase was associated with a higher number of M1-like macrophages and more mature DCs, both important players to activate an immune response. While tasquinimod had no direct effect on the T cell number and functionality, it affected the immunosuppressive myeloid cell population which resulted in increased T cell proliferation and IFN-y secretion. Previous work by our group already showed a high expression of S100A9 and its receptors TLR4 (and RAGE) on myeloid cells, while the expression was low or even absent on T cells and MM cells; suggesting that the effect of tasquinimod is particularly attributed to targeting of the myeloid cell population.15 All these data illustrate the immune activating capacity of tasquinimod in MM models, not by depleting the immunosuppressive myeloid cells but by switching their phenotype into a less suppressive and more proinflammatory state.
Although the immunoactivating properties of tasquinimod are linked with S100A9-targeting, it has been shown that tasquinimod suppresses tumor angiogenesis and tumor growth by allosteric binding to the regulatory Zn2+ binding domain of HDAC4.10 33 In MM, HDAC4 was previously described as a regulator of tumor cell growth and survival; while HDAC5, 7 and 9 had no effect on MM cell proliferation.34 Tasquinimod had no effect on MM cell apoptosis, however, we could clearly observe a reduction in MM cell proliferation; while HS-5 stromal cells remained unaffected.35 As MM cells are S100A9 negative and HDAC4 positive, the effect of tasquinimod is potentially attributed to HDAC4-mediated targeting of the tumor cells.12 HDAC4 is a potent transcriptional repressor and regulates the expression of numerous genes (eg, ATF4, NF-kB) which are potentially involved in the anti-MM effect. Previous studies already demonstrated a close interplay between HDAC and c-MYC/p27 expression in cancer.24 36 Accordingly, our data supported this notion as tasquinimod-mediated targeting of MM cells resulted in reduced c-MYC and increased p27 expression in vitro.
Tasquinimod-mediated antitumor effects were further evaluated in vivo and demonstrated a significant impact on tumor load, osteolytic lesions and a prolonged survival of MM-bearing mice. Whether the antitumor effect was attributed to the immune-activating potential of tasquinimod or to the direct targeting of MM cells (or a combination of both) remains to be elucidated, however, the increase in serum IFN-y levels (at end-stage) together with the shift of myeloid cell populations (after short-term treatment) points toward the immunostimulating properties of tasquinimod in this cancer model.
Depending on the time of exposure, S100A8/S100A9 proteins were previously reported to stimulate or reduce bone resorption. Exposure of osteoclast precursors to S100A9 strongly inhibited their osteoclastogenic potential, while the addition of S100A8/S100A9 to mature osteoclasts stimulated their bone-resorbing activity.29 37 Our study clearly demonstrated an increase in the trabecular bone volume after tasquinimod treatment in MM-bearing mice, hence suggesting a therapeutic potential of tasquinimod for treating MM bone disease.
Altogether, this study gives insights in potential further combination trials in MM patients. The compound is currently evaluated in a non-randomized phase Ib/IIa for relapsed/refractory MM patients, in combination with a standard MM regimen including ixazomib, lenalidomide, and dexamethasone (IRd) (NCT04405167).38 In castrate-resistant prostate cancer trials (NCT01732549, NCT01234311), the compound demonstrated efficacy and a favorable safety profile.39 As tasquinimod suppresses the immunosuppressive microenvironment, a combination therapy of this small molecule inhibitor with other immunotherapeutic approaches could provide a promising therapeutic option for MM patients and should be further researched preclinically.
Supplemental material
Data availability statement
All data relevant to the study are included in the article or uploaded as online supplemental information.
Ethics statements
Patient consent for publication
Ethics approval
All experiments were reviewed and approved by the Ethical Committee for Animal Experiments of the Vrije Universiteit Brussel (license no. LA1230281, ethical number 21-281-1).
Acknowledgments
The authors thank Carine Seynaeve and Charlotte Van De Walle for excellent laboratory assistance in microscopy, isolation and staining.
References
Supplementary materials
Supplementary Data
This web only file has been produced by the BMJ Publishing Group from an electronic file supplied by the author(s) and has not been edited for content.
Footnotes
Contributors Study design: KDV and RF; methodology and investigation: RF, HS, CM, EV, NV and HE; resources: KDV, MT and HE; bioinformatic analysis: KM, PV and RF; formal analysis: RF and KDV; writing-original draft preparation: RF and KDV; manuscript editing: HS, NV, EV, AM, EDB, EM, HE, AC, NDB, PV, DH, MT, HE, KV, KM and KB; Supervision: KDV, KM and KB; Guarantor: KDV. The author(s) read and approved the final manuscript.
Funding This study was supported by the VUB spearhead research programs and the Wetenschappelijk Fonds Willy Gepts of Universitair Ziekenhuis Brussel. KDV is postdoctoral fellow of FWO Vlaanderen (12I0921N). NV and CM are predoctoral fellows of FWO Vlaanderen (1159622N, 1103223N). RF was supported by a China Scholarship Council (CSC)-VUB scholarship.
Competing interests This study was in part funded by Active Biotech.
Provenance and peer review Not commissioned; externally peer reviewed.
Supplemental material This content has been supplied by the author(s). It has not been vetted by BMJ Publishing Group Limited (BMJ) and may not have been peer-reviewed. Any opinions or recommendations discussed are solely those of the author(s) and are not endorsed by BMJ. BMJ disclaims all liability and responsibility arising from any reliance placed on the content. Where the content includes any translated material, BMJ does not warrant the accuracy and reliability of the translations (including but not limited to local regulations, clinical guidelines, terminology, drug names and drug dosages), and is not responsible for any error and/or omissions arising from translation and adaptation or otherwise.