Article Text

Abstract
Background BCG is recommended as intravesical immunotherapy to reduce the risk of tumor recurrence in patients with non-muscle invasive bladder cancer (NMIBC). Currently, it is unknown whether intravesical BCG application induces trained immunity.
Methods The aim of this research was to determine whether BCG immunotherapy induces trained immunity in NMIBC patients. We conducted a prospective observational cohort study in 17 NMIBC patients scheduled for BCG therapy and measured trained immunity parameters at 9 time points before and during a 1-year BCG maintenance regimen. Ex vivo cytokine production by peripheral blood mononuclear cells, epigenetic modifications, and changes in the monocyte transcriptome were measured. The frequency of respiratory infections was investigated in two larger cohorts of BCG-treated and non-BCG treated NMIBC patients as a surrogate measurement of trained immunity. Gene-based association analysis of genetic variants in candidate trained immunity genes and their association with recurrence-free survival and progression-free survival after BCG therapy was performed to investigate the hypothesized link between trained immunity and clinical response.
Results We found that intravesical BCG does induce trained immunity based on an increased production of TNF and IL-1β after heterologous ex vivo stimulation of circulating monocytes 6–12 weeks after intravesical BCG treatment; and a 37% decreased risk (OR 0.63 (95% CI 0.40 to 1.01)) for respiratory infections in BCG-treated versus non-BCG-treated NMIBC patients. An epigenomics approach combining chromatin immuno precipitation-sequencing and RNA-sequencing with in vitro trained immunity experiments identified enhanced inflammasome activity in BCG-treated individuals. Finally, germline variation in genes that affect trained immunity was associated with recurrence and progression after BCG therapy in NMIBC.
Conclusion We conclude that BCG immunotherapy induces trained immunity in NMIBC patients and this may account for the protective effects against respiratory infections. The data of our gene-based association analysis suggest that a link between trained immunity and oncological outcome may exist. Future studies should further investigate how trained immunity affects the antitumor immune responses in BCG-treated NMIBC patients
- Urinary Bladder Neoplasms
- Immunity, Innate
- Immunotherapy
- Genetic Markers
- Cytokines
Data availability statement
Data are available on reasonable request. Raw data files for RNA-sequencing and ChIP-sequencing are deposited in the NCBI Gene Expression Omnibus under the reference series number GSE190530.
This is an open access article distributed in accordance with the Creative Commons Attribution Non Commercial (CC BY-NC 4.0) license, which permits others to distribute, remix, adapt, build upon this work non-commercially, and license their derivative works on different terms, provided the original work is properly cited, appropriate credit is given, any changes made indicated, and the use is non-commercial. See http://creativecommons.org/licenses/by-nc/4.0/.
Statistics from Altmetric.com
WHAT IS ALREADY KNOWN ON THIS TOPIC
It is unknown whether BCG immunotherapy for bladder cancer induces trained immunity in humans and how relevant trained immunity is for antitumor immune responses.
WHAT THIS STUDY ADDS
In our study, we show that BCG immunotherapy induces trained immunity and decreases the risk for respiratory infections in non-muscle invasive bladder cancer (NMIBC) patients. The production of TNF and IL-1β by peripheral blood mononuclear cells was increased up to 3 months after BCG instillations, which indicate a long-term trained immunity phenotype.
HOW THIS STUDY MIGHT AFFECT RESEARCH, PRACTICE OR POLICY
Future studies should further investigate how trained immunity affects the antitumor immune responses in BCG-treated NMIBC patients.
Introduction
Intravesical instillations with BCG is the recommended adjuvant therapy in patients with high-risk non-muscle invasive bladder cancer (HR-NMIBC). HR-NMIBC is associated with a high risk of tumor recurrence and progression to muscle-invasive bladder cancer. BCG immunotherapy generally consists of an induction course with 6-weekly instillations, followed by 3-weekly maintenance courses at months 3 and 6 and then every 6 months for up to 3 years.1 Although BCG is more effective in preventing tumor recurrences than intravesical chemotherapy,2 3 non-responsiveness to BCG is observed in more than 25% of HR-NMIBC patients within 5 years.4 5 The exact immunological mechanisms through which BCG mediates antitumor immunity in bladder cancer are still unclear. Initiation of a T helper 1 (Th1) cell immune response is important to achieve a good clinical response,6 7 and cell-mediated antitumor activity is achieved via immune cells such as CD8+ T cells8,9 NK cells10 11 and macrophages.12–14
It is known that activated myeloid cells can further increase Th1 immune responses by producing TNF, IL-1β, IL-6, IL-12, and IL-18.15–19 These cytokines are produced after stimulation of Toll-like receptors (TLR) and NOD-like receptors (NLR) by BCG.20–22 TLR2 and TLR4 are especially important for the production of IL-1β by monocytes after BCG stimulation.23 Additionally, BCG vaccination and mechanistic studies have demonstrated that following BCG stimulation, myeloid cells can develop trained immunity (TI),24 which is characterized by long-term functional and epigenetic reprogramming of myeloid cells, with enhancement of their function.25 This TI phenotype allows myeloid cells to respond with an increased cytokine response on encountering a secondary stimulus or challenge.24 25 It contributes to the increased protection against non-tuberculosis infections, including respiratory infections, after BCG vaccination.26–28 Mechanistic studies found that autophagy,29 IL-1β signaling,26 30 31 IL-32 signaling,32 33 NOD2-RIPK2 signaling,34 epigenetic enzymes,35 36 metabolic reprogramming,37 and reprogramming of hematopoietic stem and progenitor cells (HSPCs) in the bone marrow,38 39 are important for the induction of TI by BCG.
Whether repeated BCG instillations in NMIBC also induce TI, and whether this is relevant for clinical responses, has not been systematically studied. There are no data on epigenetic modifications and metabolic changes in myeloid cells of NMIBC patients during BCG therapy. Reports of increased urinary TNF, IL-1β, IL-2, IL-6, IL-8, IFNγ, M-CSF, and GM-CSF after BCG instillations only provide indirect evidence for (systemic) TI.6 40–43 Ex vivo lipopolysaccharide (LPS) stimulation experiments with blood monocytes found that TNF, IL-1β and IL-6 production was generally increased during a BCG induction cycle,29 44–46 indicating induction of TI, but these experiments lacked relevant long-term data. Here, we extensively investigate and describe induction of TI by BCG instillations in NMIBC by (1) analyzing long-term induction of systemic TI in blood monocytes of BCG-treated NMIBC patients, (2) evaluating whether BCG instillations result in reduced incidence of respiratory infections, and (3) exploring the relation between BCG-induced TI and oncological NMIBC outcome via genetic studies.
Methods
Study design and patient population of the tribute study
We set up a prospective observational study in high-risk NMIBC patients (ie, Ta high grade or T1 with or without concomitant carcinoma in situ (CIS)) that were scheduled to start BCG therapy at the urology departments of two Dutch academic hospitals (Radboud university medical center Nijmegen and Erasmus MC Rotterdam). Inclusion for this study, named Tribute (‘TRained Immunity induced by BCG in UroThElial carcinoma’), was initiated in June 2018 and ended in April 2021. Eligibility criteria are given in online supplemental table 1. In short, all patients were BCG naive and had primary or recurrent HR-NMIBC, with or without CIS. All patients were free of visible papillary tumor at the start of BCG therapy as determined via re-TURT or negative cystoscopy and/or cytology at most 6 weeks before start of BCG therapy. Patients with tumor stage>cN0 or cM1 were excluded from participation, as well as those with upper urinary tract tumors or another malignancy other than basal cell carcinoma of the skin or prostate cancer under active surveillance. The BCG treatment schedule in this observational study was up to the treating urologist and was based on a standard regimen of a 6-week induction course followed by 3-weekly maintenance courses. Clinical data and follow-up were collected from the medical files of the participating patients. A baseline questionnaire was used to extract patient information on, for example, smoking and BCG vaccination status and a diary was used to collect data on smoking and co-medication during BCG therapy.
Supplemental material
Blood sample collection
Blood for the Tribute study was collected (40–50 mL in EDTA tubes) at nine time points during the first year of BCG therapy and was drawn at the outpatient clinic, either directly before the BCG bladder instillation or 5–20 min after the instillation. Blood was drawn directly before the BCG bladder instillation at study visits: pre-BCG1, pre-BCG7, pre-BCG10, and pre-BCG13. Blood was drawn 5–20 min after applying the BCG instillation at study visits: BCG2, BCG6, BCG9, BCG12, and BCG15 (figure 1A).
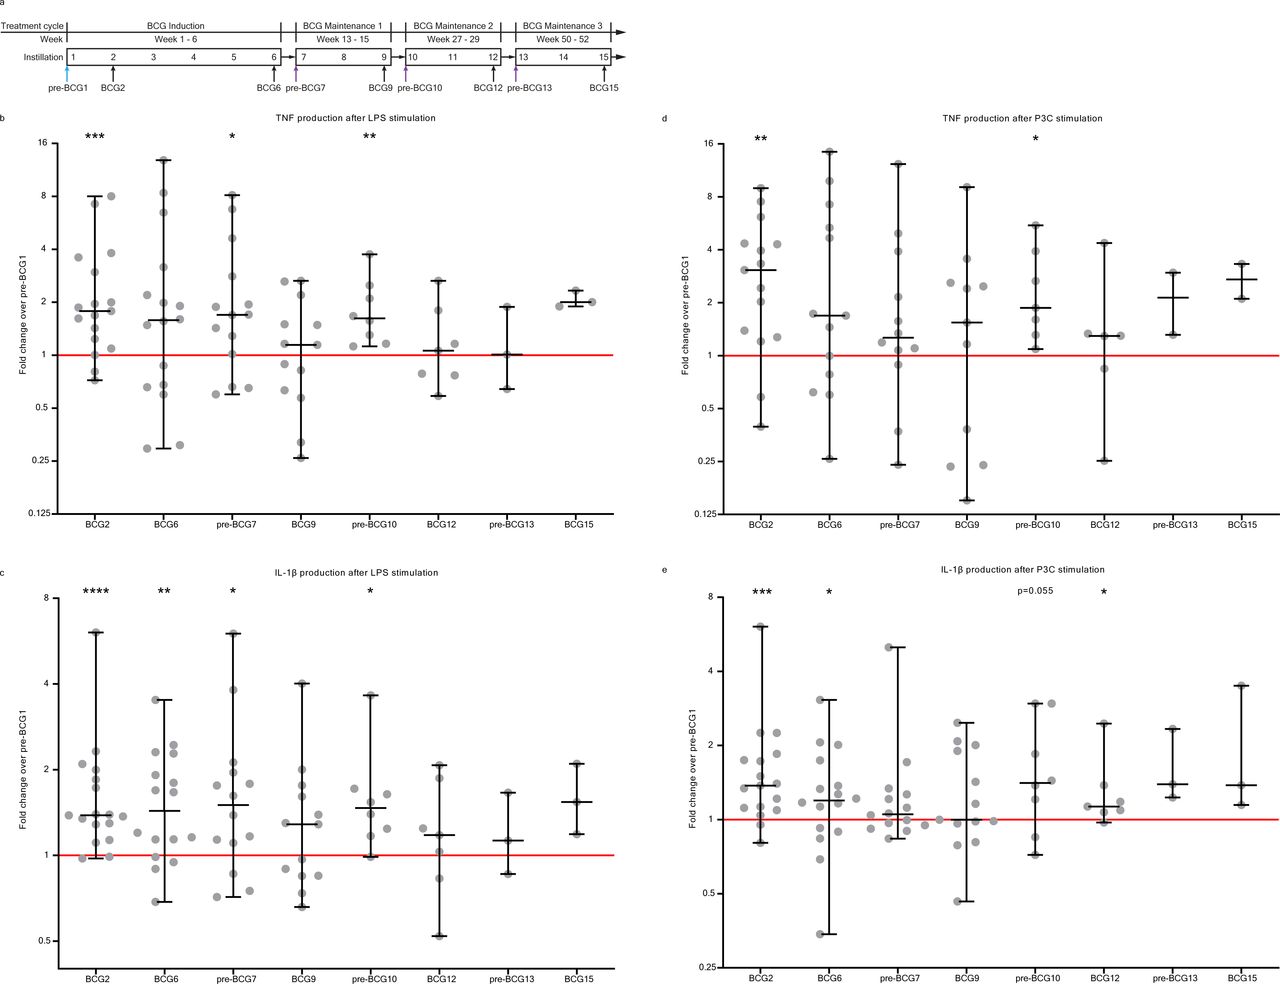
Cytokine production by PBMCs on ex vivo stimulation with heterologous stimuli is increased after BCG instillations. (A) Study schedule of the Tribute study. Blood was collected and PBMCs were isolated at three time points during the BCG induction cycle: pre-BCG1, BCG2 and BCG6; and two time points during each subsequent BCG maintenance cycle: pre-BCG7, BCG9, pre-BCG10, BCG12, pre-BCG13 and BCG15. Some patients discontinued with BCG (see online supplemental table 2). Light blue arrow indicates pre-BCG1 time point which is used to calculate fold change in cytokine production. Purple arrows indicate important time points for TI, as patients did not receive BCG for weeks to months and thus represent the best ‘innate immune memory’ time points. (B) TNF production by PBMCs after 24 hour stimulation with LPS at eight time points during BCG therapy compared with pre-BCG1. (C) IL-1β production by PBMCs after 24 hour stimulation with LPS at eight time points during BCG therapy compared with pre-BCG1. (D) TNF production by PBMCs after 24 hour stimulation with Pam3Cys (P3C) at eight time points during BCG therapy compared with pre-BCG1. (E) IL-1β production by PBMCs after 24 hour stimulation with P3C at eight time points during BCG therapy compared with pre-BCG1. Fold change values for each individual patient are displayed as gray dots. Group values for each time point are displayed as median±range in fold change compared with pre-BCG1. Two-tailed matched-pairs Wilcoxon signed-rank test was used to determine statistical significance in cytokine production between time points. Statistical significance was accepted at p<0.05 and indicated as follows: *p<0.05, **p<0.01, ***p<0.001, ****p<0.0001. Number of data points per time point for b, c, e: pre-BCG1: 17, BCG2: 17, BCG6: 16, pre-BCG7: 14, BCG9: 13, pre-BCG10: 8, BCG12: 7, pre-BCG13: 3, BCG15: 3. Number of data points per time point for d: pre-BCG1: 15, BCG2: 15, BCG6: 13, pre-BCG7: 12, BCG9: 11, pre-BCG10: 7, BCG12: 6, pre-BCG13: 2, BCG15: 2. LPS, lipopolysaccharide; PBMC, peripheral blood mononuclear cell.
Whole blood cell counts
Complete blood leukocyte counts were determined in 100 μL EDTA whole blood using a Sysmex XN-450 analyzer (Sysmex) within 5 hours after blood draw.
Peripheral blood mononuclear cell isolation
Isolation of peripheral blood mononuclear cell (PBMCs) and purification of monocytes was performed as described in previously published articles by our group.26 34 47 Briefly, PBMCs were isolated by density centrifugation of Ficoll-Paque (GE healthcare, UK) within 5 hours after blood draw. Cells were washed twice in PBS and resuspended in RPMI culture medium (Roswell Park Memorial Institute medium; Invitrogen, California, USA) supplemented with 50 mg/mL gentamicin, 2 mM Glutamax (GIBCO), and 1 mM pyruvate (GIBCO) and diluted to a concentration of 5×10⁶/mL for in vitro PBMC stimulation experiments.
After PBMC isolation, purification of monocytes was performed using a hyperosmotic density gradient medium Percoll (Sigma-Aldrich). The PBMC suspension was adjusted to a concentration of 50–60×106 cells/mL and subsequently applied on top of the hyper osmotic Percoll solution, after which the cells were centrifuged at 580 g for 15 min at room temperature, with no brake and slow acceleration (Sorvall Legend RT). The interphase layer was collected with a Pasteur pipette and the cells were washed with cold PBS once. The cells were diluted in 2–3 mL RPMI and this monocyte-enriched cell suspension was further used for epigenetics analyses, and RNA isolation.
PBMC stimulation experiments
PBMC stimulation experiments were performed within 6 hours after drawing of blood. PBMC stimulation experiments were performed on round bottom 96 wells plates (Greiner). In each well, 100 μL of PBMC cell suspension (5×10⁶/mL) was seeded. Subsequently, 100 μL of stimulus was added. The final cell culture concentrations of the used stimuli were as follows: 10 ng/mL Escherichia coli LPS (serotype 055:B5, Sigma-Aldrich), 10 µg/mL Pam-3-Cys (EMC microcollection). The experiments were performed in duplicate. PBMCs were stimulated for 24 hours in an incubator at 37°C and 5% CO2. After 24 hours the plates were spun for 8 min at 1400 RPM (Rotina 380R Hettich) and supernatants were collected and stored at −80°C until analysis.
Cytokine measurements in PBMC supernatants
Cytokine concentrations in PBMC supernatants were measured to determine whether cytokine production after non-specific stimulation for 24 hours was altered throughout BCG instillation therapy. These measurements were performed for both duplicates and the mean value of both duplicates was used for data analysis. IL-1β, IL-6, TNF, and IL-1 receptor antagonist (IL-1Ra) were measured in thawed supernatants using commercial ELISA kits (R&D Systems). IL-1Ra was measured because it inhibits the binding and bioactivity of IL-1β,48 thus, we expect IL-1Ra to inhibit TI responses.
Chromatin immuno precipitation for histone 3 lysine 4 trimethylation
Isolated monocyte-enriched suspensions were fixed with 1% formaldehyde (Sigma). Fixed cell suspensions were sonicated using a Bioruptor Pico (Diagenode) for seven cycles (30 s on; 30 s off). For each Chromatin immuno precipitation (ChIP), chromatin of 0.5×10⁶ cells was incubated with 254 μL dilution buffer, 12 μL protease inhibitor cocktail (25×), and 1 µg of H3K4me3 antibody (Cell Signaling Technology, Danvers USA) and incubated overnight at 4C with rotation. Protein A/G magnetic beads were washed in dilution buffer with 0.15% SDS and 0.1% BSA, added to the chromatin/antibody mix and rotated for 60 min at 4C. Beads were washed with 500 mL buffer for 5 min at 4C with five rounds of washes. After washing, chromatin was eluted using elution buffer for 20 min. Supernatant was collected, 8 µL 5M NaCl, 2 µL proteinase K were added and samples were incubated on a shaking heat-block for 4 hours at 1000 rpm, 65C. This elution procedure was also repeated for chromatin input samples, where 0.5×10⁶ cells were used for input as well. As final step, the DNA was isolated using QIAGEN MinElute PCR purification Kit and eluted in 20 µL elution buffer.
ChIP-qPCR
We included the first seven Tribute patients for ChIP-qPCR to have access to chromatin from long-term time points (ie, pre-BCG10). Immunoprecipitated chromatin was used for qPCR analysis. For qPCR analysis the input samples were diluted 25 times and the ChIP samples were diluted 3 times. Primers used in the reaction are listed in online supplemental table 13. Samples were analyzed with a comparative Ct method on the StepOne PLUS qPCR machine (Thermo Fisher Scientific) using SYBR green (Invitrogen) in accordance with the manufacturer’s instructions.
Chromatin immuno precipitation sequencing
ChIP-seq was performed for the first seven patients that were included in Tribute. Illumina library preparation was performed using the KAPA HyperPrep kit (KAPA Biosystems). Library concentration was measured using the KAPA Library Quantification Kit (KAPA Biosystems); library size was determined using the BioAnalyzer High Sensitivity DNA Kit (Agilent). Sequencing was performed using an Illumina NextSeq500, and 42-bp paired-end reads were generated.
Processing of genome-wide histone modification data
Chromatin Immunoprecipitation and sequencing (ChIP-seq) reads were aligned to human genome assembly hg38 (NCBI V.38) using bwa.49 BAM files were first filtered to remove the reads with mapping quality less than 15, followed by fragment size modeling. MACS2 was used to call the peaks. Peaks from all samples were merged into a single ‘H3K4me3 peaks’ bed file and reads per peak were counted using bedtools coverage.50 Data (reads/peak) were normalized using the R package DESeq2 and then pairwise comparisons were performed.
RNA isolation and RNA-sequencing
After isolation, 1–5 × 10⁶ cells of the monocyte-enriched cell suspension were used for RNA extraction. The cells were spun down at 500 g for 5 min. Supernatant was removed and the cell pellet was resuspended with 500 µL RNAlater solution (Thermo Fisher Scientific) and kept at room temperature for 20 min. The resuspended solution was stored at −80°C until RNA isolation. The cell pellets which were frozen in RNAlater solution were thawed to RT and centrifuged for 5 min at 300 g. The cell pellets were then dissolved in RLT buffer (Qiagen) for 20 min. RNA was isolated using RNeasy Mini Kit (Qiagen) according to manufacturer’s protocol, and including DNAse treatment.
RNA sequencing (RNA-seq) was performed by BGI Genomics (Denmark) for six patients (all included in ChIP-seq). The DNBseq RNA transcriptome PE101 pipeline was used with 30 million reads per sample. Read length was 100 bp. After sequencing, the raw reads were filtered. Data filtering included removing adaptor sequences, contamination and low-quality reads from raw reads. To infer gene expression levels, RNA-seq reads were aligned to hg19 human transcriptome using Bowtie.51 Quantification of gene expression levels as Reads Per Kilobase Million (RPKM) was performed using MMSEQ, a software package for statistical analysis of RNA-seq data.52 Reads/transcripts were normalized using DEseq2 and pairwise comparisons were performed.
Statistical analysis for ChIP-seq and RNA-seq datasets
Differentially expressed genes were identified using DEseq2 with fold change >1.33 and p<0.05, with a mean RPKM>1. For longitudinal comparisons, the outputs of all pairwise comparisons (eg, pre-BCG1 vs BCG6, pre-BCG1 vs pre-BCG7) were combined and separated into groups using k-means clustering in MeV.53 Dynamic H3K4me3 peaks were identified using DEseq2 with change in signal determined as fold change >1.5 and unadjusted p<0.05, with a mean reads/peak>25.54 The Benjamini-Hochberg method was used to correct for multiple testing in DEseq2 and the adjusted p values are shown in online supplemental tables. Genes of interest were downloaded from Kyoto Encyclopedia of Genes and Genomes.55 For gene ontology, H3K4me3 peaks were assigned to the nearest transcription start site (TSS) within 1 Mb using the GREAT tool.56 Promoter H3K4me3 peaks were identified as those within 5 kb from a TSS using bedtools. Motif analysis was performed on gene promoters using HOMER findMotifs.57 Motif enrichment was calculated using the hypergeometric distributions, comparing the input promoter list to a background list of promoters. In addition to the p value, we used a fold change cut-off of >2 to designate a motif as significantly enriched.
Analysis of genes of interest in ex vivo BCG RNA sequencing data
In vitro validation of in vivo findings is a useful tool to confirm TI associated molecular signatures in monocytes.26 58 The in vitro TI model has been extensively used for this purpose.54 59 We recently published transcriptome (RNA sequencing) data in monocytes from five healthy volunteers that were exposed to BCG ex vivo for 24 hours and RNA was collected at baseline, 4 hour, 24 hours, day 6 (5 days after removal of stimulus), and day 6+4 hours of LPS stimulation60 (GSE168468). Two different strains of the BCG vaccine (Denmark and Bulgaria) were used in the experiments and showed a strong concordance in monocyte transcriptional response. Differential gene expression was determined using DESeq2, with p-adjusted<0.05, fold change>2, RPKM>1. Time-course RNA expression data for GBP1, −2, –4, -5 and AIM2 was extracted from the differentially expressed gene table, and gene expression was plotted as RPKM over time.
Measurement of IFNγ in blood plasma
Measurement of IFNγ in blood plasma was performed for the following number of patients and time points: pre-BCG1: 17, BCG2: 17, BCG6: 16, pre-BCG7: 13, BCG9: 13, pre-BCG10: 8, BCG12: 7, pre-BCG13: 3, BCG15: 3. Measurement of circulating IFNγ in blood plasma was performed using the commercially available Olink Proteomics AB (Uppsala Sweden) inflammation panel (92 inflammatory proteins). Data values are depicted as Normalized Protein eXpression (NPX), which is Olink’s arbitrary unit and is in Log2 scale.
Statistical analysis of cytokine levels in supernatants and blood plasma
Descriptive statistics are presented as median±range, as indicated in the legend of each figure, unless otherwise stated. The statistical significance of the differences between study visits was evaluated using matched pair two-tailed Wilcoxon signed-rank test. In figures, asterisks denote statistical significance (*, p<0.05; **, p<0.01; ***, p<0.001; ****, p<0.0001). Statistical analysis was performed in GraphPad PRISM 8.
Study into respiratory infections in NMIBC patients from the BlaZIB and UroLife studies
NMIBC patients with date of diagnosis between May 2014 and April 2020 who are participating in BlaZIB61 or UroLife,62 two ongoing observational studies (METC Region Arnhem-Nijmegen file numbers 2017-3240 and 2013-494, respectively), were invited in May 2020 to participate. We only invited those BlaZIB and UroLife patients who had given prior informed consent to be approached for additional studies, and for whom an email address was available. Patients were invited via email to fill out a digital questionnaire. A total of 1230 patients were invited of which 678 consented and filled out the questionnaire.
The questionnaire contained questions on bladder instillations, disease history, smoking, vaccinations for influenza and tuberculosis (BCG), respiratory infections (ie, pneumonia, bronchitis, laryngitis, influenza, and common cold) between November 2018 and May 2020, and questions on COVID-19 symptoms. Errors in recall and self-report of RI’s in this patient population are expected to be small for pneumonia and influenza but may affect measurement of bronchitis, laryngitis, and cold. Do note however that any errors are unlikely to be different for BCG-treated versus non-BCG-treated patients and hence will unlikely lead to false positive results.
Clinical and treatment characteristics for the patients were extracted from the Netherlands Cancer Registry (NCR) in the second half of 2020, but follow-up on treatment was incomplete for some patients. Data from both the questionnaires and the NCR were used to define the (timing of) BCG exposure for the patients. Given the period of outcome assessment of November 2018 to May 2020, we defined a subgroup of BCG-treated NMIBC patients that we considered as exposed to BCG during the whole outcome assessment period, that is, first BCG instillation prior to October 15 2018 and final BCG instillation after April 2019. Here, we assumed that a TI phenotype is fully induced 2 weeks after the first instillation and will be present up to 1 year after the last BCG instillation. The other BCG-treated patients were either partially exposed during the outcome assessment period or exposed prior to the outcome assessment period.
Statistical analyses entailed the description of characteristics in cross tables for comparison of groups that differed in their exposure to BCG. Univariable logistic regression analysis was performed to generate ORs and 95% CIs. Multivariable logistic regression analysis was performed to allow for adjustment of factors that are known to affect the incidence of respiratory infections and may be associated with BCG exposure or NMIBC patient status. More specifically, we considered older age, male sex, lack of influenza vaccination (in the year 2018 and/or 2019), smoking cigarettes, and history of chronic lung disease (ie, asthma, COPD, chronic bronchitis, lung emphysema) as potentially relevant respiratory infection-risk increasing covariables.
Genotyping and analysis of exome DNA variation in BCG-treated NMIBC patients
BCG-treated NMIBC patients were included from the previously described Nijmegen Bladder Cancer Study (NBCS).63 NBCS patients were genotyped using the Illumina HumanExome BeadChip (‘exome chip’) containing over 240 000 exonic markers of which ~90% with minor allele frequency (MAF) <5%. Variants were called and cleaned according to64 and as an additional quality check, cluster plots of variants that showed a difference of >5% in MAF compared with European samples from the 1000 Genomes project were visually checked and adjusted, where appropriate. Additionally, standard quality control was performed using PLINK V.1.9 which included removal of samples based on call rate, gender mismatch, relatedness, heterozygosity and population outliers, and removal of variants with call rate <98%, that were monomorphic, not in HWE, or should be treated with caution (https://genome.sph.umich.edu/wiki/Exome_Chip_Design). Also, duplicate and triallelic variants were removed. After QC, 92 364 exome chip variants were available for analysis in a total of 215 NMIBC patients that had received at least 5 BCG induction instillations (see online supplemental table 11 for patient characteristics). Given the known clinical benefit of BCG maintenance cycles, we also performed analyses in the subset of patients that received at least one maintenance cycle (defined as at least seven instillations). Gene-based analyses of candidate TI genes were performed using the coxKM R-package65 (linear kernel and default settings). Five of the 34 candidate genes could not be analyzed (IL1B and KDM4E: no exome chip variants; ASC and ATG5: only monomorphic DNA variants in study population; LAMP5: X chromosome, not analyzed). Multiple testing-adjusted p value was set at 4.3×10⁻⁴ (29 genes and 4 outcome/treatment combinations). Single-variant analyses were performed using univariable Cox proportional hazards regression analysis and an additive genotype model. Recurrence was defined as a new, histologically confirmed bladder tumor following at least one tumor-negative urethrocystoscopy or following two surgical resection attempts for the primary bladder tumor. Disease progression was defined as a shift to a higher tumor stage and/or grade. Recurrence-free survival (RFS) and progression-free survival (PFS) were defined as the time period between the initial transurethral resection of the tumor and the first event (recurrence or progression, respectively), date of censoring or date of 5-year follow-up, whichever came first, as described before.66
Data availability
Raw data files for RNA-sequencing and ChIP-sequencing are deposited in the NCBI Gene Expression Omnibus under the reference series number GSE190530.
Results
BCG instillations induce long-term systemic TI responses as indicated by increased cytokine production before BCG maintenance cycles
To determine whether BCG instillations induced TI in peripheral blood mononuclear cells (PBMCs) we performed a prospective cohort study (‘Tribute’) and isolated PBMCs collected before BCG therapy and at eight time points during BCG therapy (figure 1A). A total of 17 BCG-naïve HR-NMIBC patients were included (see online supplemental table 1 for inclusion and exclusion criteria), with a median age at inclusion of 67 years and 16 male patients (94%). Twelve patients received a complete induction regimen of six cycles of full-dose BCG. Four patients discontinued BCG therapy due to side effects, two patients due to disease progression, one patient because of BCG shortage, and for two patients the last BCG maintenance regimen was not performed (see online supplemental table 2). Six patients received one-third dose BCG or a reduced number of BCG instillations (or both) due to BCG shortage.
Immediately after PBMC isolation, we performed ex vivo stimulation experiments for 24 hours and measured production of four innate cytokines, that is, IL-1β, IL-6, TNF, and IL-1 receptor antagonist (IL-1Ra) (see the Methods section). The fold change in cytokine production between pre-BCG1 (baseline, BCG naïve) and time points during BCG therapy was used as indicator of the TI response, in line with methods used by BCG vaccination studies.67 We focused on pre-BCG7, pre-BCG10 and pre-BCG13 (ie, pre-BCG maintenance time points). At these time points, the patients had not received a BCG instillation for multiple weeks or months and hence are most informative for TI.68
Before the start of the first 3-weekly BCG maintenance cycle (pre-BCG7, ±6 weeks after BCG6, figure 1A), the LPS-induced production of TNF and IL-1β was elevated compared with pre-BCG1 (median fold change (MFC) TNF: 1.70 (p=0.035); IL-1β: 1.50 (p=0.020)) (figure 1B,C). The TNF and IL-1β production after P3C stimulation was also increased, but not at the level of nominal statistical significance (MFC TNF: 1.26 (p=0.110); IL-1β: 1.05 (p=0.194)) (figure 1D,E). Similar findings were observed for IL-6 (LPS: MFC 1.21 (p=0.080); P3C: MFC 1.55 (p=0.058)) and IL-1Ra (LPS MFC 1.12 (p=0.020); P3C MFC 1.16 (p=0.058)) (online supplemental figure 1).
Supplemental material
At the start of the second BCG maintenance cycle (pre-BCG10), approximately 3 months after BCG9, TNF and IL-1β production after stimulation was still increased compared with pre-BCG1 (figure 1). TNF was increased with a MFC of 1.62 and 1.87 for LPS and P3C stimulation, respectively (p=0.008 and p=0.016), and the MFC for IL-1β was 1.48 and 1.41 (p=0.016 and p=0.055). Production of IL-6 and IL-1Ra was not increased compared with pre-BCG1 (online supplemental figure 1). Between pre-BCG7 and pre-BCG10, there was no further increase in TNF production after LPS or P3C stimulation. The three patients from whom PBMCs were isolated at the pre-BCG13 time point did not show an increased production of TNF, IL-1β, IL-6 or IL-1Ra compared with pre-BCG1, but small numbers prevent meaningful conclusions.
Thus, for the first time, we showed that BCG instillations induce long-lasting increased innate cytokine production by circulating monocyte-enriched PBMCs and we confirmed the presence of a persistent TI phenotype before the first and second BCG maintenance cycle.
We also assessed the short-term effects of BCG on innate immune responses during the BCG induction regimen and found that 1 week after the first BCG instillation (at BCG2) the total number of white blood cells in the circulation was increased (p<0.01, online supplemental table 3) compared with pre-BCG1. More specifically, the neutrophil (p<0.01) and monocyte (p<0.01) cell populations were increased. The increase in neutrophil count after a single BCG instillation is in line with a study that found increased peripheral blood neutrophil counts in human newborns 3 days after vaccination with BCG.69 For other time points, changes in innate immune populations were either less strong or absent (online supplemental table 3). At BCG2, we also observed increased TNF, IL-1β and IL-1Ra production by PBMCs after ex vivo stimulation with LPS or P3C. IL-6 production was not increased (figure 1 and online supplemental figure 1). IL-1β production after LPS and P3C stimulation remained increased at BCG6 compared with pre-BCG1, whereas on a group level, TNF, IL-6 and IL-1Ra production was not increased (figure 1 and online supplemental figure 1).
Epigenetic changes at cytokine-gene promoters in monocytes isolated after BCG instillations
Epigenetic modifications at the gene promoters of IL6, TNF, and IL1B are hallmarks of TI.26 70 Using ChIP-qPCR we assessed histone 3 lysine 4 trimethylation (H3K4me3) modifications, an activating epigenetic modification linked to BCG-induced TI,70 at these promoters in a subset of seven patients (those seven that were included first in Tribute). Again, we focused on the pre-BCG1, pre-BCG7 and pre-BCG10 time points to assess innate immune memory. Surprisingly, in contrast to observations for cytokine production, we did not find an increase on group level in H3K4me3 modifications at pre-BCG7 or pre-BCG10 compared with pre-BCG1 (figure 2). An increased H3K4me3 signal was only observed in 2–4 out of 7 patients for the various cytokine gene loci. Importantly though, these 2–4 patients all had an increased TNF and IL-1β production after LPS stimulation. Furthermore, three out of the four patients with an increase in H3K4me3 at region 1 of the IL6 promoter showed a strong increase in IL-6 production after LPS stimulation (MFC of 2 or higher). However, there were also patients with increased IL-6, TNF or IL-1β production on LPS or P3C stimulation that showed decreased H3K4me3 signal.
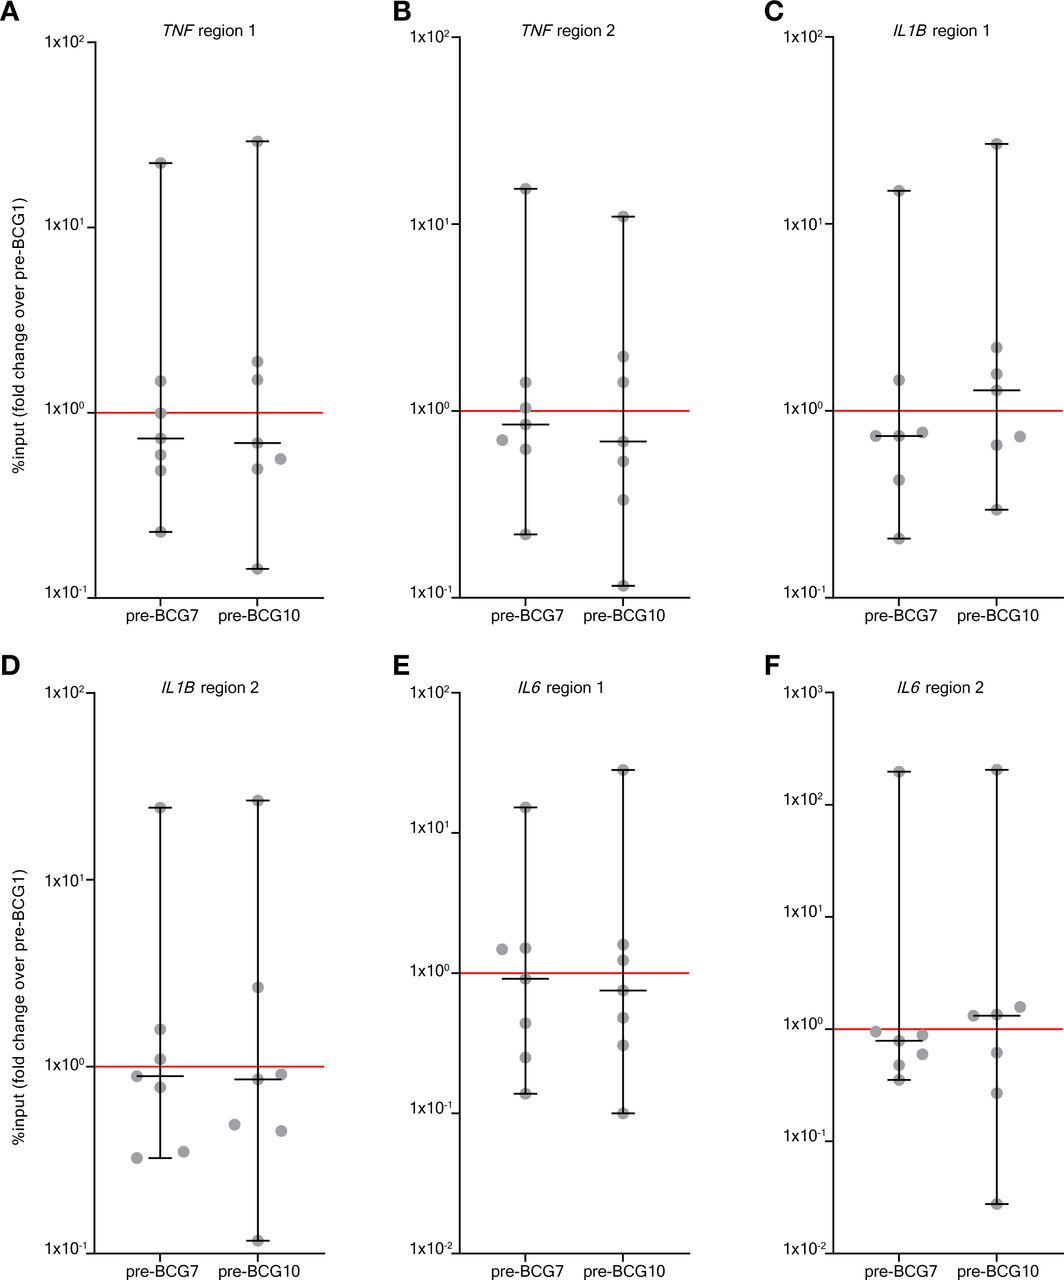
BCG instillations induce H3K4me3 modifications in monocytes. Results of the ChIP-PCR analysis for H3K4me3 modifications. H3K4me3 signal was calculated as %input and the fold change (of %input) is shown for pre-BCG7 and pre-BCG10 compared with pre-BCG1. The fold change is shown for six genomic regions in the promoter of TNF, IL1B and IL6 (the primers are displayed in online supplemental table 13). (A) TNF region 1, (B) TNF region 2, (C) IL1B region 1, (D) IL1B region 2, (E) IL6 region 1, (F) IL6 region 2. Two-tailed matched-pairs Wilcoxon signed-rank test was used to determine statistical significance in between time points. Statistical significance was accepted at p<0.05 and indicated as follows: *p<0.05, **p<0.01, ***p<0.001 ****p<0.0001. ChIP, chromatin immuno precipitation.
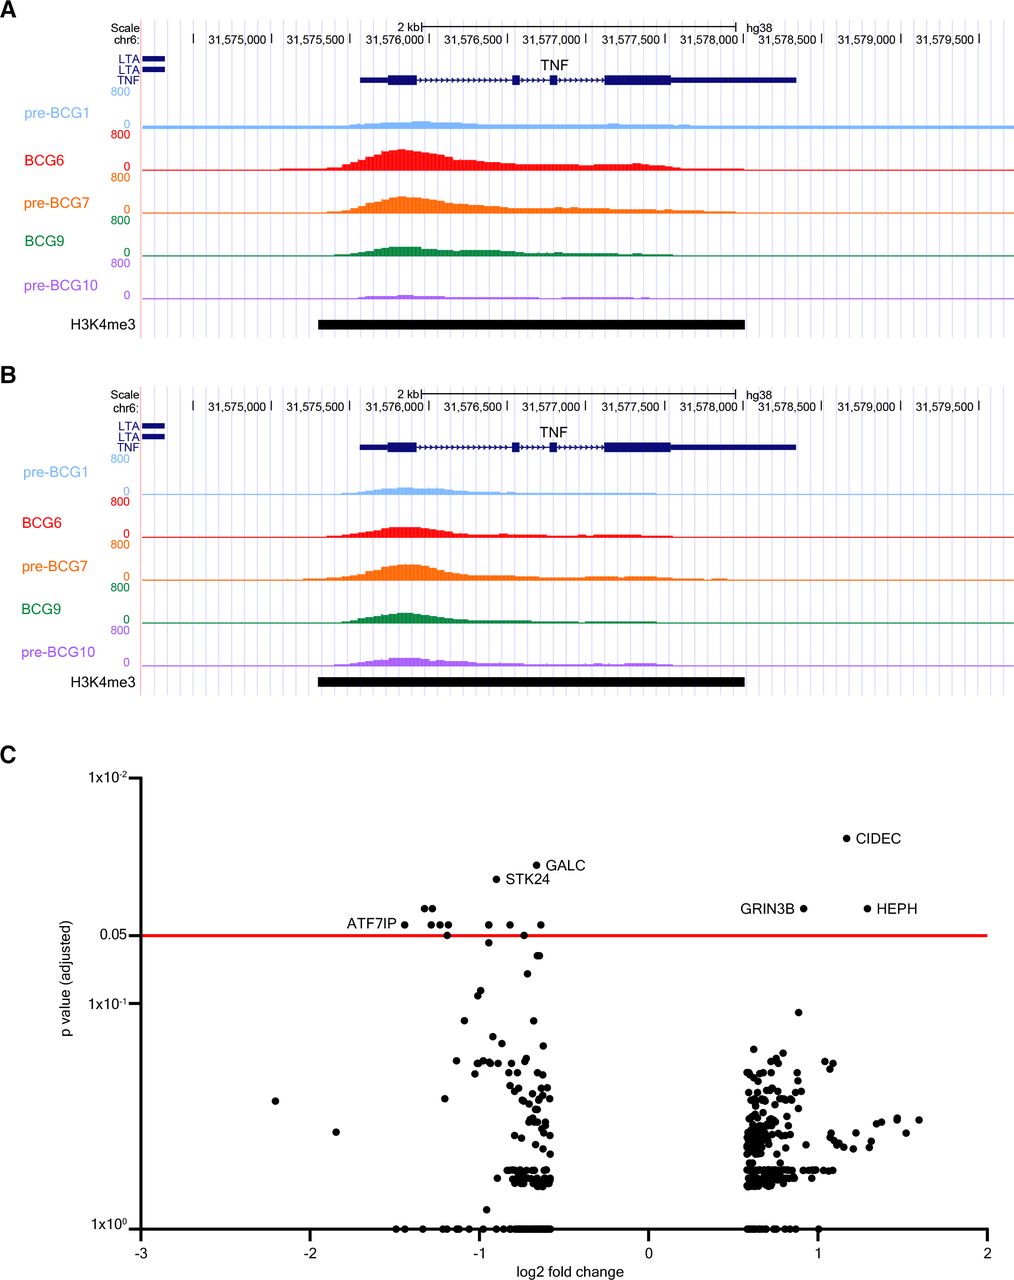
The analysis of H3K4me3 modifications via ChIP-PCR only covered specific parts of the promoter regions of TNF, IL6 and IL1B. To exclude the possibility of missing out on modification signals in other parts of the promoter due to the selection of specific primers only, we investigated changes in H3K4me3 signal in other parts of these promoters as well via analysis of genome-wide ChIP-sequencing data of these seven patients. This more in-depth analysis revealed that, on a group level, there were no changes in H3K4me3 signal at either the gene promoter or gene body of IL6, TNF or IL1B. This result was consistent for all comparisons between pre-BCG1 and post-BCG time points. Notably, both patients without (figure 3A) and with (figure 3B) recurrence of urothelial carcinoma after BCG therapy showed increases in H3K4me3 signal at the TNF promoter indicating no deterministic association with clinical outcome.

BCG instillations induce epigenetic modifications in genes involved in autophagy, IL-1β, and epigenetic enzymes. Results of the ChIP-sequencing analysis. (A) UCSC genome browser tracks of H3K4me3 signal found around the TNF gene locus of a NMIBC patient with good clinical response to BCG. (B) H3K4me3 signal near the TNF gene locus of a patient who had a recurrence after BCG therapy. H3K4me3 signal is displayed for pre-BCG1, BCG6, pre-BCG7, BCG9 and pre-BCG10. (C) Volcano plot of ChIP-sequencing data. The x-axis displays the fold change (in log2) in H3K4me3 signal between pre-BCG1 and any of the post-BCG time points (BCG6, pre-BCG7, BCG9 and pre-BCG10; see online supplemental table 4). The y-axis displays the p value adjusted for multiple testing using the Benjamini-Hochberg method. The red line indicates an adjusted p value of 0.05. ChiP, chromatin immuno precipitation; NMIBC, non-muscle invasive bladder cancer; UCSC, University of California Santa Cruz.
BCG instillations induce epigenetic modifications in genes involved with inflammasome signaling and chromatin remodeling
We further analyzed the ChIP-seq data to evaluate genomic regions that changed in H3K4me3 signal on a genome-wide scale. In total, there were 481 dynamic peaks (increasing or decreasing in H3K4me3 signal) that showed unadjusted p<0.05 between pre-BCG1 and any of the measured post-BCG time points (ie, BCG6, pre-BCG7, BCG9, pre-BCG10) of which 375 were unique (online supplemental table 4). Seventeen peaks showed an adjusted p<0.05. The strongest statistical evidence for an increase in H3K4me3 signal was found for pre-BCG10 and a region near CIDEC, coding for Cell-death-inducing-DFF45-like-effector-C and important for LPS-induced IL-1β production by epithelial cells71 (figure 3C; at pre-BCG10); the signal was increased at BCG6 and BCG9 as well (online supplemental table 4). CIDEC is also involved in the formation of proinflammatory macrophage foam cells72 and controls inflammasome activation in mouse adipocytes.73 In contrast, H3K4me3 near ATF7IP, a binding partner and regulator of SETDB1,74 75 which is a histone 3-lysine 9 (H3K9) methyltransferase, was decreased (figure 3C and online supplemental table 4). We specifically assessed changes in H3K4me3 signal in 34 candidate TI genes (online supplemental table 5), which are genes related to IL-1β/inflammasome signaling,26 autophagy,29 epigenetic enzymes,35 36 myelopoiesis39 and glycolysis.37 Among the candidate genes, three regions showed a significant unadjusted p value. IL32 increased in H3K4me3 signal at BCG9 and pre-BCG10, ATG16L2 and KDM4E were increased at pre-BCG10, and H3K4me3 near TLR4, the receptor for LPS, was decreased at BCG9. IL-32 plays a crucial role in the induction of TI by BCG.32 33 ATG16L2 is involved in autophagy and KDM4E is an epigenetic enzyme which demethylates H3K9 and regulates TI responses.36 KDM4E and ATF7IP (indirectly) affect the methylation status of H3K9 which is interesting because the methylation status of H3K9 affects BCG-induced TI responses.35 Overall, the ChIP-seq results suggested that H3K4me3 modifications at the promoter regions of TNF, IL6, and IL1B can be induced by BCG instillations but not in all patients and without a clear link to clinical response in our small patient series. Analysis of the top hits and candidate genes suggested that genes involved with IL32, autophagy and H3K9-remodeling epigenetic enzymes, important for TI responses, may be epigenetically modified.
BCG instillations upregulate genes involved in inflammasome activation
To determine how BCG instillations affect gene expression in monocytes, we performed RNA-sequencing on circulating Percoll-isolated monocytes isolated from six (out of seven ChIP-seq) patients for time points pre-BCG1, BCG6 and pre-BCG7 (figure 4A). Note that the monocytes were not stimulated ex vivo before RNA-seq analysis. We did not find statistically significant changes in gene expression of TNF, IL6, IL1B or IL1RN at BCG6 or pre-BCG7 compared with pre-BCG1 (online supplemental tables 6 and 7 and online supplemental figure 2). This is in line with BCG vaccination results described by Arts et al.26 Among the top hits for BCG6 versus pre-BCG1, FANCA (log2 FC: 0.41; padj=0.0199) and APOL2 (log2 FC: 0.39; padj=0.0303) showed upregulation. The FANCA protein is involved in DNA damage repair during hematopoiesis.76 Increased APOL2 expression is associated with polarization of macrophages to the M1 (proinflammatory phenotype).77 Furthermore, two defined TI candidate genes, GBP1 and GBP2, involved in inflammasome activation,78–81 showed strong but borderline non-significant evidence for increased gene expression (log2 FC: 0.83; padj=0.052 and log2 FC: 0.54; padj=0.114). Among the candidate genes that did not reach statistical significance after multiple testing, we found that in addition to GBP1 and GBP2, also GBP4 and GBP5 were upregulated (figure 4B) Interferon regulatory factor 1 (IRF1), an upstream transcription factor that regulates GBP gene expression, and the cytosolic DNA sensing receptor AIM2, which is activated by GBPs and IRF1,78 82 were upregulated as well (at punadj<0.05). Interestingly, IL8, a major chemokine for neutrophil recruitment, was downregulated (online supplemental table 6). Motif enrichment analysis revealed that 17% of the scanned promoters from the differentially expressed genes at BCG6 are enriched for an interferon-sensitive response element (ISRE), an IRF responsive motif, compared with just 1.3% of all genes (figure 5A). These results suggest that IRFs, which are also transcription factors that control M1 macrophage differentiation,83 84 are important mediators between BCG exposure and gene induction,38 also when BCG is instilled in the bladder. In line with this observation, we found upregulated expression of IRF1 and IRF9 at BCG6 (figure 5B) and increased IFNγ concentration in blood plasma (figure 5C).
Supplemental material
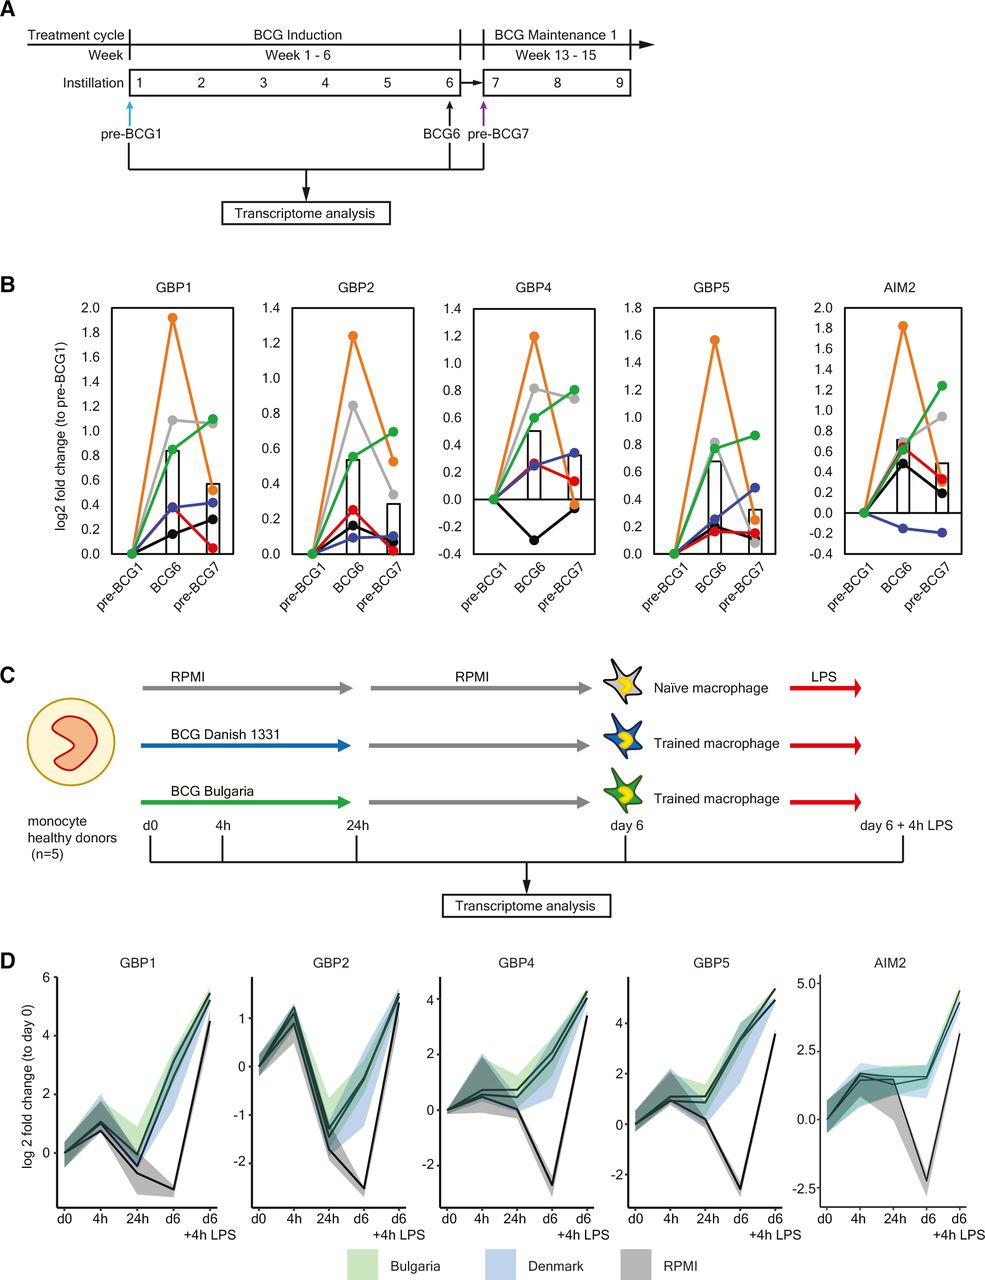
Upregulation of GBPs and AIM2 in vivo and during induction of trained immunity in vitro. (A) Protocol for transcriptome analysis of monocyte-enriched cell suspensions before and during intravesical BCG therapy. Note that the cells were not stimulated ex vivo before RNA-sequencing. (B) Gene expression of GBP1, GBP2, GBP4, GBP5 and AIM2 at pre-BCG1, BCG6 and pre-BCG7. Each color indicates an individual patient. The bar represents the mean gene expression of all 6 patients for each time point. For the changes in mean gene expression between pre-BCG1 and BCG6: GBP1 p=0.0001, padjust=0.053; GBP2 p=0.0002, padjust=0.114; GBP4 p=0.0070, padjust=1; GBP5 p=0.0016, padjust=0.5051; AIM2 p=0.0027, padjust=0.7203. And between pre-BCG1 and pre-BCG7 only GBP1 and AIM2 were significant: GBP1 p=0.0084, padjust=1; AIM2 p=0.0427, padjust=1. (C) The in vitro trained immunity protocol as described by Domínguez-Andrés et al.59 Monocytes are isolated from the blood, seeded on a cell culture plate and subsequently incubated with a trained immunity-inducing stimulus (BCG), and a control condition (RPMI), for the first 24 hours. After 24 hours, the training stimulus is washed away and the culture medium is refreshed. On day 6, the restimulation stimulus (LPS), or a negative control restimulation (RPMI) is added. After 24 hours of restimulation, the supernatant is collected for cytokine measurements. For this particular experiment, cells were harvested at baseline (d0), After the first 4 hours (4 hour), 24 hours (24 hours), at day 6 before restimulation (d6), and at day 6, 4 hours after restimulation with LPS (d6+4 hour LPS), and RNA was isolated and gene expression was measured. (D) Changes in gene expression for GBP1, GBP2, GBP4, GBP5 and AIM2 are displayed as median (solid line), and 25th and 75th quartiles (shaded) for three conditions: BCG Bulgaria (green), BCG Denmark (blue), and RPMI (gray, negative control). The expression of all genes was significantly increased in D6-BCG-trained macrophages compared with RPMI macrophages (GBP1 p=0.0001, padjust=0.03; GBP2 p=7.78-5, padjust=0.02; GBP4 p=2.79-6, padjust=0.0013; GBP5 p=7.40-8, padjust=8.10-5; AIM2 p=0.00015, padjust=0.034). All adjusted p values in this figure were calculated using the Benjamini-Hochberg method.

Increased activity of IRF transcription factors and higher IFNγ plasma concentration may drive upregulation of genes after BCG instillations. (A) Motif enrichment analysis at the promoters of the upregulated genes between pre-BCG1 and BCG6 reveals that Interferon-Sensitive Response elements (ISRE) and IRFs are significantly more present at the promoter regions of upregulated genes. (B) Gene expression of IRF1 and IRF9 is increased at BCG6 (IRF1 p=0.0146, padjust=1; IRF9 p=0.0004, padjust=0.1763) (C) Concentration of IFNγ in blood plasma of Tribute patients at each time-point. Data are presented in NPX values, which is a log2 scale. Individual patient values are displayed as gray dots. Group values are displayed as median±range. Two tailed matched-pair Wilcoxon signed-rank test was used to determine statistical significance between time points. Statistical significance was accepted at p<0.05 and indicated as follows: *p<0.05, **p<0.01, ***p≤0.001, ****p≤0.0001. Number of data points per time point: pre-BCG1: 17, BCG2: 17, BCG6: 16, pre-BCG7: 14, BCG9: 13, pre-BCG10: 8, BCG12: 7, pre-BCG13: 3, BCG15: 3. IRFs, Interferon Regulatory Factors.
At the start of BCG maintenance (pre-BCG7), 6 weeks after BCG induction, there were no genes upregulated that reached the level of statistical significance after multiple testing (online supplemental table 7).
A total of 26 genes remained upregulated at punadj<0.05 from BCG6 to pre-BCG7 and 27 genes remained downregulated (online supplemental table 8). Among those that were upregulated, we identified four genes involved in inflammasome activation: GBP1, AIM2, CASP5 and KCNMA1,85 86 and one gene involved in positive regulation of autophagy: RUFY4.87–89 Interestingly, three genes coding for hemoglobin subunits (HBA1, HBA2, HBB) remained downregulated.
GBPs regulate intracellular innate immune responses and activate the inflammasome for IL-1β production,78–82 also after LPS stimulation.78 80 90 GBPs also mediate the release of DNA from vacuoles into the cytosol for activation of DNA-sensing receptors such as CGAS and AIM2.91 Thus, our RNA-seq data suggested that GBP-inflammasome signaling and DNA-sensing by AIM2 may be increased.
In vitro TI experiments with BCG are characterized by increased GBP-AIM2 inflammasome gene expression
The increased IL-1β production by PBMCs and the upregulation of AIM2 and GBPs suggests that inflammasome activity is enhanced and may be an important mechanism of TI during BCG therapy. To determine whether GBP and AIM2 gene expression is also upregulated in monocytes trained by direct exposure to BCG vaccine, we performed in vitro experiments with monocytes from five healthy donors using a standard TI protocol37 59 (figure 4C), and measured gene expression at baseline, after 4 hours, 24 hours, 6 days, and 6 days plus 4 hours after LPS restimulation. In line with the RNA-seq data from the BCG-treated bladder cancer patients, we found that in vitro induction of TI by two strains of BCG increased the expression of GBP1, GBP2, GBP4, GBP5 and AIM2 (figure 4D) compared with the non-BCG trained control condition, especially after LPS restimulation. These results suggested that BCG-trained monocytes, compared with the non-trained monocytes, had a primed AIM2-GBP inflammasome prior to restimulation which is then enhanced even more on LPS restimulation. BCG may thus increase AIM2-mediated DNA-sensing and subsequently lead to increased inflammasome activation and IL-1β production.
BCG bladder instillations decrease the risk of respiratory infections in NMIBC patients
BCG vaccination is associated with a reduced risk of pneumonia and influenza due to TI.27 92–94 If BCG instillations also induce a TI phenotype, we would expect to see a reduced frequency of respiratory infections. We studied this association by comparing self-reported data on respiratory infections experienced in the 18 months prior to reporting (ie, between November 2018 and May 2020) from 407 BCG-treated NMIBC patients and 250 non-BCG treated NMIBC patients. Out of the 407 BCG-treated patients, 109 were considered BCG-exposed during the whole respiratory infection outcome assessment period; the remaining 298 BCG-treated patients were exposed during a part of this period or prior to this period (partially exposed) (see the Methods section and online supplemental table 9 for patient characteristics). Results of the univariable regression analysis showed a borderline statistically significant 37% decreased risk of respiratory infections for the BCG-exposed versus BCG-unexposed group (OR 0.63 (95% CI 0.40 to 1.01)), and a non-significant 17% reduced risk for the partially BCG exposed versus BCG unexposed (OR 0.83 (95% CI 0.58 to 1.18)) (table 1). The strongest evidence for a risk reduction in BCG-treated patients was seen for pneumonia and common cold. Comparison of risk estimates for fully and partially BCG-exposed NMIBC patients for those RIs with a substantial number of events showed a dose–response relation with the lowest risks for those who are fully exposed. Multivariable analyses that included potential confounders showed very similar results (online supplemental table 10). These findings suggest that BCG instillations induce heterologous protective effects against infectious diseases, in line with the induction of a systemic TI phenotype.
Results of univariable association analysis for respiratory infections (RIs) and BCG exposure status among NMIBC patients participating in the BlaZIB and UroLife studies
Germline DNA variants in genes that affect TI induction are associated with recurrence and progression in BCG-treated NMIBC patients
We previously described an association between single-nucleotide polymorphism rs3759601 in ATG2B, that influenced both the in vitro and in vivo training effect of BCG, and response to BCG in NMIBC patients from the NBCS.29 63 Here, we extended our genetic research and assessed whether rare to common DNA variants in the 34 TI candidate genes (online supplemental table 5) affect clinical outcome of BCG-treated patients. We analyzed available exome chip data of 215 BCG-treated NMIBC patients from the NBCS (see online supplemental table 11 for patient characteristics). Gene-based association analysis could be performed for 29 of the 34 genes and revealed no multiple testing-adjusted statistically significant finding (<4.3×10⁻⁴) for any of the candidate genes (online supplemental table 12). However, a borderline significant result was found for EHMT2 (p=0.0005 for progression-free survival after BCG induction and maintenance). Unadjusted p values between 0.008 and 0.058 were found for candidates ATG2B, ATG7, ATG16L1, and HNF1B, with either recurrence or progression after BCG induction or BCG induction and maintenance (table 2). These results suggest that genetic variation in genes known to affect TI induction by BCG, that is, autophagy genes,29 a gene controlling myelopoiesis,39 and a mediator of H3K9 methylation,35 affects the clinical response after BCG therapy. Given the lack of statistical significance, however, validation in other cohorts is required.
Results of the association analysis of exome chip variants in trained immunity candidate genes and clinical outcome in patients of the Nijmegen Bladder Cancer Study (NBCS)
Discussion
In this study, we showed for the first time that intravesical BCG treatment induces TI at a systemic level, reflected by the increased cytokine production by PBMCs isolated from peripheral blood and increased protection against respiratory infections. Also, we found that germline DNA variants in genes important for the induction of TI influence the clinical oncological outcome after BCG instillations in NMIBC.
Previous research assessing the effects of intravesical BCG application on TI responses is scarce and provides incomplete evidence. Conti et al showed that after 18 hours of ex vivo LPS stimulation, monocytes from three BCG-treated NMIBC patients had a significantly higher production of TNF and IL-1α compared with monocytes from three non-BCG treated NMIBC patients or three healthy age-matched controls.45 Furthermore, Buffen et al found an increased production of TNF, IL-1β and IL-6 after the sixth BCG instillation compared with before the first BCG instillation.29 Kim et al observed that TNF production increased with consecutive BCG instillations of an induction cycle and peaked after the fourth BCG instillation, but for three out of seven patients the TNF production declined between the fourth and sixth instillation.46 Graham et al described variable post-BCG versus pre-BCG ratios of cytokines released by monocytes following LPS stimulation in 33 NMIBC patients during BCG induction, with approximately half of the patients showing an increase in ratios.95 A limitation of all these studies is that they only assessed the cytokine production during a BCG induction cycle which may be influenced by the immunological processes of priming or tolerance.68
We now showed that repeated intravesical BCG instillations induce systemic TI and added new long-term data that showed that the TI phenotype is present at the start of BCG maintenance cycle 1 and 2, despite a time interval of 6–12 weeks without BCG instillations. TI may already be induced after a single BCG instillation given the observed increased cytokine production 1 week after the first BCG instillation by us and others.46 Importantly, some patients showed a decreased cytokine production capacity at the sixth BCG instillation, as also observed by Kim et al,46 which could indicate a phenotype of immune tolerance.68 From in vitro TI experiments it is known that the induction of TI and induction of immune tolerance is dose dependent, where TI-inducing stimuli induce immune tolerance at a high dose and TI at a low or moderate dose.96 The number of colony forming units in a single dose used during a BCG instillation is approximately 500-fold higher compared with the dose of a BCG vaccination.97 98 This dose and the repetitive instillations in NMIBC may explain why at BCG6, BCG9 and BCG12, shortly after multiple BCG instillations, the cytokine responses were decreased compared with pre-BCG7 and pre-BCG10.
The TI phenotype is complex and training capacity in the form of TI-associated cytokine production on ex vivo stimulation or any of the other TI markers will vary among patients. This interindividual variation in TI responses has been described both after BCG vaccination and after BCG-induced TI in vitro.99 Our Tribute patient series was too small to assess associations between patient, tumor, BCG treatment (frequency and dosage), and clinical characteristics and magnitude of TI responses but novel investigations are increasing insight into relevant factors for variation after BCG vaccination.100 We did find interpatient variation in in vitro cytokine production which may explain the non-statistically significant increases for some cytokines and time points. Surprisingly, increase in H3K4me3 signal at promoters of hallmark TI genes was only observed for less than half of the patients. We have no definitive explanation for this finding. One explanation for the lack of increase in H3K4me3 signal in multiple patients could be the use of Percoll for monocyte isolation, resulting in approximately 60% purity. Furthermore, we were able to assess only one histone mark (H3K4me3), and it may be hypothesized that other epigenetic modifications (such as H3K4me1, H3K27Ac, H3K9me3) could also contribute to the TI effects of BCG instillations. Assessment of genome-wide changes in chromatin architecture using ATAC-sequencing, similarly to Cirovic et al, for BCG vaccination,39 at multiple time points could provide more information as to which genomic regions are important for TI responses during treatment with BCG instillations.
Previous research showed that IL-1β is a key mediator controlling the induction of TI by BCG vaccination and that IL-1β was highly correlated with a reduction of viremia after BCG vaccination in an experimental model of viral infection in humans.26 Furthermore, IL-1β signaling promotes glycolysis and proliferation of HSPCs in β-glucan trained mice.30 31 Functional reprogramming of HSPCs is also a hallmark of BCG-induced TI in humans39 and mice.38 Our data confirmed that IL-1β is also a key mediator of the TI phenotype induced by BCG instillations in humans. We showed that NMIBC patients treated with BCG have the capacity to produce increased amounts of IL-1β compared with pre-BCG1, and most importantly, this capacity is still present at the start of BCG maintenance 1 and 2. This indicates that circulating monocytes of BCG-treated NMIBC patients, which have proliferated in the bone marrow, have acquired a long-term functional program for increased IL-1β production on immunological stimulation. Indeed, the increased expression of GBPs and AIM2 in our RNA-seq data indicates that the BCG-treated patients had an increased capacity to produce IL-1β, which is controlled by the inflammasome. A limitation of our results is that no genes were significant after adjustment for multiple correction, and therefore replication in a larger number of patients is required. Nevertheless, our results are in line with previous studies which show that GBPs activate the inflammasome on sensing cytosolic LPS, and thereby increase IL-1β production.79 80 101 Furthermore, the increase in GBP5 expression reflects data from Lim et al, who showed increased GBP5 expression in non-tumor urothelial tissue 3 months post-BCG compared with pre-BCG.8 Finally, we showed that GBP and AIM2 expression was increased in in vitro TI experiments as well. Thus, BCG seems to increase GBP expression in circulating monocytes (GBP5 also in the bladder8) and GBP-enhanced inflammasome activation may control TI responses both in vivo and in vitro.
The GBP-AIM2 inflammasome can also indirectly become activated via the signaling cascade of CGAS-STING-IRF1.82 102 CGAS (MB21D1) is a DNA-sensing receptor which activates the STING pathway which is important for the production of proinflammatory cytokines and type 1 interferon.103 Recently, a recombinant BCG overexpressing c-di-AMP (a STING agonist) induced TI and improved antitumor efficacy in animal models of NMIBC.104 To what extent DNA-sensing by CGAS and AIM2 is involved in TI responses during BCG therapy in NMIBC patients remains to be elucidated. In our study, we did not stimulate PBMCs with double-stranded DNA, so we cannot confirm whether TI responses to DNA stimulation are also increased. If this is indeed the case, one might hypothesize that (tumor derived and BCG derived) DNA-sensing in the bladder microenvironment may be increased and this may be one of the antitumor immune mechanisms of BCG instillations.
We already previously reported the association of genetic variation in ATG2B29 and IL18105 with clinical response after BCG therapy. Our exome chip analysis identified associations for additional autophagy genes and other genes that are known to affect TI induction directly at the epigenetic level (ie, EHMT235) and the level of hematopoiesis (ie, HNF1B39). These genetic findings suggest a connection between TI and clinical efficacy of BCG in NMIBC. However, the genetic associations have not been replicated in independent NMIBC cohorts. Also note that due to the small study sample and incomplete coverage of DNA variation via the exome chip, negative gene findings have low informative value.
In conclusion, we present comprehensive evidence from in vivo and ex vivo studies that BCG instillations in patients with NMIBC induce TI. Most patients showed an augmented long-term systemic innate immune response, which may very well boost antitumor and antipathogen immune responses. However, the TI responses induced varied widely between patients and this may also be the substrate of variable clinical responses, although this remains to be investigated in future studies.
Data availability statement
Data are available on reasonable request. Raw data files for RNA-sequencing and ChIP-sequencing are deposited in the NCBI Gene Expression Omnibus under the reference series number GSE190530.
Ethics statements
Patient consent for publication
Ethics approval
The Tribute study received ethical approval from the medical research ethics committee Arnhem-Nijmegen (METC number: NL60341.091.17). The BlaZib and Urolife studies were approved by the medical research ethics committee Arnhem-Nijmegen (METC numbers 2017-3240 and 2013-494, respectively). Participants gave informed consent to participate in the study before taking part.
Acknowledgments
We thank all participants of Tribute, UroLife, BlaZIB and NBCS for their participation. We thank H. Dijkstra and H. Lemmens for support with ELISA analysis. We thank M.A.B. Rosmalen, H. van de Pol, J.C.M. Smits-van de Camp, J.M. Jansen-Jansen and V.E. de Kleijnen for their help with blood and urine collection for Tribute and J.S.F. Maurits for help with data collection for the respiratory infection study. The authors thank the registration team of the Netherlands Comprehensive Cancer Organization (IKNL) for the collection of data for the Netherlands Cancer Registry as well as IKNL staff for scientific advice.
References
Supplementary materials
Supplementary Data
This web only file has been produced by the BMJ Publishing Group from an electronic file supplied by the author(s) and has not been edited for content.
Supplementary Data
This web only file has been produced by the BMJ Publishing Group from an electronic file supplied by the author(s) and has not been edited for content.
Footnotes
Correction notice This article has been corrected since it was first published to indicate that LABJ and SHV are joint senior authors.
Contributors Study conception and design: AGvdH, EO, JHvP, JLB, LABJ, MGN and SHV. Provision of study material or patients: AGvdH, AV, BN, DK, JAW, JHvP, JLB, KKHA, LALMK, SHV and TCMZ. Acquisition of data: AGvdH, AV, BN, DK, JAW, JHvP, KKHA, LALMK, LvE, SHV and UTHO. Analysis and interpretation of data: BN, JHvP, LABJ, SHV and TEG. Writing of the manuscript: AGvdH, BN, EO, JHvP, JLB, LABJ, MGN and SHV. Review of the manuscript: All authors. Revision of the manuscript: BN, JHvP, LABJ and SHV. Guarantors of the manuscript: JHvP, LABJ and SHV.
Funding MGN was supported by an ERC Advanced Grant (#833247) and a Netherlands Organization for Scientific Research Spinoza Grant (NWO SPI 94-212). LABJ was supported by a Competitiveness Operational Programme grant of the Romanian Ministry of European Funds (P_37_762, MySMIS 103587). SHV is supported by a grant from the Netherlands Organization for Scientific Research (NWO Vidi 91717334). BN is supported by an NHMRC (Australia) Investigator Grant (APP1173314) and Project Grant (APP1157556). The BlaZIB study was financially supported by the Dutch Cancer Society (IKNL 2015-7914). The UroLife study was financially supported by Alpe d’HuZes/Dutch Cancer Society (KUN 2013-5926) and Dutch Cancer Society (2017-2/11179). Funding for the exome chip study was provided by the Netherlands Organization for Scientific Research under award number 184021007 and made available as a Rainbow Project of the Biobanking and Biomolecular Research Infrastructure Netherlands (BBMRI-NL). Genetic analyses were carried out on the Dutch national e-infrastructure with the support of SURF Cooperative.
Competing interests LABJ and MGN declare that they are scientific founders of Trained Therapeutics Discovery and are the owners of two patents related to trained immunity. JLB discloses consultancy for MSD, Roche, Ambu, Eight Medical, and Janssen and research collaborations with Janssen, Merck, Vitroscan. All other authors declare no competing interests.
Provenance and peer review Not commissioned; externally peer reviewed.
Supplemental material This content has been supplied by the author(s). It has not been vetted by BMJ Publishing Group Limited (BMJ) and may not have been peer-reviewed. Any opinions or recommendations discussed are solely those of the author(s) and are not endorsed by BMJ. BMJ disclaims all liability and responsibility arising from any reliance placed on the content. Where the content includes any translated material, BMJ does not warrant the accuracy and reliability of the translations (including but not limited to local regulations, clinical guidelines, terminology, drug names and drug dosages), and is not responsible for any error and/or omissions arising from translation and adaptation or otherwise.