Article Text

Abstract
Background Agonistic anti-CD40 monoclonal antibodies (mAbs) have emerged as promising immunotherapeutic compounds with impressive antitumor effects in mouse models. However, preclinical and clinical studies faced dose-limiting toxicities mediated by necroinflammatory liver disease. An effective prophylactic treatment for liver immune-related adverse events that does not suppress specific antitumor immunity remains to be found.
Methods We used different mouse models and time-resolved single-cell RNA-sequencing to characterize the pathogenesis of anti-CD40 mAb induced liver toxicity. Subsequently, we developed an antibody-based treatment protocol to selectively target red blood cells (RBCs) for erythrophagocytosis in the liver, inducing an anti-inflammatory liver macrophage reprogramming.
Results We discovered that CD40 signaling in Clec4f+ Kupffer cells is the non-redundant trigger of anti-CD40 mAb-induced liver toxicity. Taking advantage of the highly specific functionality of liver macrophages to clear antibody-tagged RBCs from the blood, we hypothesized that controlled erythrophagocytosis and the linked anti-inflammatory signaling by the endogenous metabolite heme could be exploited to reprogram liver macrophages selectively. Repeated low-dose administration of a recombinant murine Ter119 antibody directed RBCs for selective phagocytosis in the liver and skewed the phenotype of liver macrophages into a Hmoxhigh/Marcohigh/MHCIIlow anti-inflammatory phenotype. This unique mode of action prevented necroinflammatory liver disease following high-dose administration of anti-CD40 mAbs. In contrast, extrahepatic inflammation, antigen-specific immunity, and antitumor activity remained unaffected in Ter119 treated animals.
Conclusions Our study offers a targeted approach to uncouple CD40-augmented antitumor immunity in peripheral tissues from harmful inflammatoxicity in the liver.
- Immunotherapy
- Macrophages
- Immunity, Innate
Data availability statement
Data are available in a public, open access repository. Data are available on reasonable request.
This is an open access article distributed in accordance with the Creative Commons Attribution Non Commercial (CC BY-NC 4.0) license, which permits others to distribute, remix, adapt, build upon this work non-commercially, and license their derivative works on different terms, provided the original work is properly cited, appropriate credit is given, any changes made indicated, and the use is non-commercial. See http://creativecommons.org/licenses/by-nc/4.0/.
Statistics from Altmetric.com
WHAT IS ALREADY KNOWN ON THIS TOPIC
Inflammatoxicity in the liver is a dose-limiting adverse activity of anti-CD40-based cancer immunotherapy. Established immunosuppressive and anti-inflammatory drugs like glucocorticoids and TNF-blocking agents can effectively suppress liver-inflammation, but may undermine antitumor efficacy. Novel strategies to prevent liver-toxicity focused on either liver-specific anti-inflammatory functions or targeting CD40-activity towards extrahepatic antigen-presenting cells.
WHAT THIS STUDY ADDS
We identified Kupffer cells as the essential driver of anti-CD40-induced liver toxicity, setting the stage for a selective strategy to prevent immunotherapy induced liver toxicity. Based on this pathophysiological insight, we developed a monoclonal antibody-based protocol to direct host erythrocytes for phagocytosis in the liver, inducing liver-restricted anti-inflammatory macrophage reprogramming. With this conditioning strategy, we could uncouple anti-CD40-stimulated inflammation and immunity in the liver and in extrahepatic tissues.
HOW THIS STUDY MIGHT AFFECT RESEARCH, PRACTICE OR POLICY
Our study provides proof of concept for liver selective anti-inflammatory macrophage reprogramming, which may support the development of more effective and less harmful immunotherapy protocols in cancer medicine.
Background
Agonistic anti-CD40 monoclonal antibodies (mAbs) have shown strong immunotherapeutic effects in preclinical models of solid tumors when combined with chemotherapy, radiotherapy, or other immunotherapies.1–4 CD40 ligation and activation drive not only T-cell-dependent5–9 but also T-cell-independent antitumor immunity, such as the reprogramming of tumor-associated macrophages into antitumor macrophages.10 11
CD40 targeting employs an agonistic immunotherapeutic strategy. In contrast to immune checkpoint-inhibiting antibodies, which block intrinsic receptor–ligand interactions, agonistic compounds must be carefully dosed to reach efficiency without triggering harmful side effects. Systemic administration of agonistic anti-CD40 mAb leads to the activation of macrophages in multiple organs, producing cytokine release syndrome and, notably in the liver, leading to necroinflammatory liver injury.12 Liver toxicity is currently the main factor limiting the use of anti-CD40 mAbs at higher and more anti-tumor effective doses in clinical settings. This has been demonstrated in mouse models, in which anti-CD40 mAbs were delivered intravenously at high doses (5–20 mg/kg).12–15 When improperly administered before chemotherapy, anti-CD40 treatment can result in lethal hepatotoxicity in mice.14 In humans, clinical trials of anti-CD40 mAb administration reported a mild to moderate elevation in transaminase levels, even when anti-CD40 mAbs were applied at low doses (0.1–0.2 mg/kg).16–18 Although less frequent, liver toxicity has also been reported as an immune-mediated adverse effect of other immunotherapies, including checkpoint inhibitors.19 Glucocorticosteroids and TNF-blocking agents have been successfully used to treat immune-related adverse events (irAEs) induced by immunotherapeutic agents in cancer treatment.20 21 However, the systemic anti-inflammatory and immunosuppressive activity of these drugs may negatively affect their antitumor efficiency.22–25 To fully leverage the antitumor potential of anti-CD40 mAbs and other immunotherapeutic agents, a specific prophylactic treatment for liver irAEs that does not suppress antitumor immunity remains to be found.
Mechanistically, anti-CD40 mAbs induce hepatotoxicity by stimulating localized cytokine expression and reciprocal immune-cell activation in the liver, including lymphocytes, Kupffer cells, neutrophil granulocytes, and endothelial cells.12 13 Moreover, lineage selective conditional knockout of CD40 in all macrophages throughout the body abrogated the disease.12 These data suggest that CD40-ligation on Kupffer cells could be an indispensable trigger of liver disease, rationalizing the development of therapeutic interventions to selectively reprogram liver macrophages into an anti-inflammatory phenotype.
One of the most archetypical functions of resident liver macrophages is the clearance of membrane-altered or antibody-tagged red blood cells (RBCs) during hemolytic stress.26 In mice with genetic spherocytosis or phenylhydrazine-induced hemolytic anemia, we have discovered that phagocytosis of RBCs and subsequent heme signaling through the transcription factor NRF2 transformed liver macrophages into erythrophagocytes with a profoundly attenuated inflammatory response on activation of CD40 and TLR signaling pathways.27–29 Based on these observations, we hypothesized that therapeutic targeting of RBCs with an opsonizing mAb could selectively induce erythrophagocyte transformation in the liver, resulting in an anti-inflammatory mode of action with unique liver tropism.
Here, we exploited time-resolved single-cell RNA-sequencing (scRNA-seq) and Kupffer cell selective conditional gene knockout to demonstrate that CD40 signaling in resident liver macrophages is indeed the principal upstream trigger of anti-CD40 mAb-induced liver toxicity. We then used a recombinant antibody targeting RBCs for erythrophagocytosis to induce selective erythrophagocyte reprogramming of liver macrophages before administering high-dose agonistic anti-CD40 mAb. This conditioning strategy allowed us to uncouple antitumor immunity in peripheral tissues from harmful inflammatoxicity in the liver. Based on these data, antibody-instructed erythrophagocyte transformation may evolve as a liver-selective anti-inflammatory strategy in cancer immunotherapy and potentially other inflammatory and metabolic liver diseases.
Methods
Mouse strains and treatment protocols
Details about mouse strains, treatment protocols, tissue sampling, and single cell preparation can be found in online supplemental methods sections. Rat anti-mouse Ter119 IgG2 mAb was acquired from InVivoPlus and diluted in sterile phosphate-buffered saline (PBS) before s.c. injection. Murine Ter119 (mTer119) IgG2 mAb was produced by CSL Behring30 (non-commercialized) and diluted in sterile PBS before s.c. injection.
Supplemental material
Agonistic anti-CD40 mAb challenge
Anti-CD40 mAbs were purchased from BioXCell (clone FGK4.5/FGK45) and injected intravenously at 20 mg/kg in a maximum volume of 5 µL/g weight. Animals were sacrificed 16 hours later for cytokine and macrophage gene expression measurement or 30 hours later for plasma alanine aminotransferase (ALT) measurement, liver histology, and colon histology.
Histology
Detailed protocols for tissue preparation, staining and imaging can be found in online supplemental methods sections. Whole-liver sections processed by H&E, immunohistochemical or immunofluorescence (IF) staining, and embedded in paraffin were acquired using a Zeiss Axio Scan.Z1 and Akoya Phenoimager HT microscope. Regions of liver vibratome sections subjected to IF staining were visualized with a Leica SP8 confocal laser scanning microscope. Images were analyzed using Qupath31 (V.0.3.2) and ImageJ.
Macrophage quantification in IF tissue sections
F4/80+ cells were quantified in whole-liver sections using the integrated watershed cell detection plugin in Qupath. The cells were detected in the Alexa Fluor 555 channel using a requested pixel size of 0.5 µm. The background radius, median filter radius and sigma were 8, 0 and 1.5 µm, respectively. The minimum and maximum areas were 10 and 400 μm2, respectively. The threshold was set to 150, and cell expansion to 2 µm.
Flow cytometry
In all flow cytometry experiments, except for flow cytometric analysis of RBCs, live dead staining was performed using the LIVE/DEAD Fixable Near-IR cell stain kit (Invitrogen) as described by the manufacturer. Fc receptor blockade was performed by preincubating cells with TruStain FcX PLUS (anti-mouse CD16/32) antibodies (BioLegend). Multiparameter analysis was performed with an LSR Fortessa analyzer (BD Biosciences) or an Aurora 5 L spectral flow cytometer (Cytek). The autofluorescence of cells was subtracted in all experiments using a spectral flow cytometer. Data were analyzed using FlowJo software (V.10.7.1) and flow cytometry software express V.6 (De Novo software).
Bone marrow-derived macrophages cell culture
Bone marrow (BM) cells were isolated by flushing the femurs and tibias of 8–10-week-old C57BL/6 J mice, followed by straining of the BM through a 70 µm filter. The BM cells were plated at a density of 30,000 cells/cm2 on tissue culture-treated 96-well plates (TPP) in complete RPMI-1640 medium (10% FCS and 1% L-glutamine) supplemented with 1% penicillin/streptomycin and 100 ng/mL recombinant mouse M-CSF (PeproTech). On day 3, half of the medium was replaced. Experiments were carried out on day 7.
In vitro erythrophagocytosis assay
BM-derived macrophages (BMDMs) were isolated and cultured on a 96-well plate at a concentration of 104 cells/well as described above. On day 7 of BMDM culture, donor RBCs were obtained from mice by submental vein puncture. The whole-blood samples were washed twice with PBS. RBCs (50×106) were stained using red pHrodo (pHrodo Cell Labeling Kit for Incucyte Phagocytosis Assays, Sartorius) according to the manufacturer’s protocol. Stained RBCs were added to increasing concentrations of BMDMs. Immediately before starting image acquisition, the Ter119 antibody (400 µg/mL) was added to each well. Images were acquired every 15 min for 8 hours using an Incucyte live-cell analysis system.
Sequencing-based workflows and data analysis
Detailed description of the workflow for scRNAseq experiments using the 10x Genomics Chromium platform, Illumina sequencing, and data analysis are provided in online supplemental methods section. Sequencing data can be accessed at the Gene Expression Omnibus under accession no. GSE202918.
RT-qPCR analysis
The experimental details for RNA isolation, cDNA synthesis, qPCR, and primer sequences are provided in online supplemental methods section.
Statistical analysis
Sample size was calculated with R (V.4.1.2). Data plotting and statistical analysis were performed with Prism V.9 (GraphPad) and JMP V.15 (SAS) or the Bioturing SingleCell browser (V.3.3.15). We used analysis of variance with Tukey’s post-test, t-tests (two tailed), and Fisher’s exact test or χ2 test to analyze contingency tables, as indicated in the figure legends. All data points are displayed in bar plots as the mean±SD (n.s.=not significant, *p≤0.05, **p≤0.01, ***p≤0.001, ****p≤0.0001).
Results
Kupffer cell activation drives anti-CD40 mAb-induced liver inflammatoxicity in mice
To identify a cell target for the selective suppression of anti-CD40 mAb-induced liver toxicity, we studied the sequence of inflammatory processes leading to liver toxicity due to anti-CD40 treatment. To this end, we used our previously described mouse model of anti-CD40 mAb-induced necroinflammatory liver disease.12 Consistent with our previously published results, thirty hours after intravenous injection of anti-CD40 mAb, we detected large areas of liver necrosis by histology (figure 1A) and a significant increase in liver enzyme (ALT) levels in plasma, indicating liver toxicity (figure 1B). The administration of anti-CD40 mAb also induced a systemic inflammatory cytokine response starting 7 hours postinjection which then peaked at 24 hours postinjection (figure 1C). We then performed a time-resolved scRNA-seq experiment with CD45-enriched liver cell suspensions that were isolated from saline-treated mice (0 hour) and anti-CD40-treated mice at 7 hours, 14 hours, or 22 hours after administration. Cells from each condition were labeled with DNA-barcoded antibodies, pooled and processed for sequencing (figure 1D). Figure 1E shows a uniform manifold approximation and projection plot containing merged data from the cells across the four treatment time points. The cellular identity of each cell cluster was determined by matching its gene expression profile with canonical marker genes for Kupffer cells, monocytes, neutrophils, dendritic cells, T and B lymphocytes, and endothelial cells (figure 1F, online supplemental figure 1A,B) and the cell population dynamics was analyzed over time (figure 1G and online supplemental figure 2). At baseline, we found primarily an endothelial cell population and a population of Clec4f+ Kupffer cells. At 7 hours, we detected a position shift in the Clec4f+ Kupffer cell population. This shift reflected an inflammatory transformation of the Kupffer cells, accompanied by the induction of the expression of multiple chemokines, including Cxcl9 and Cxcl10, and a strong signal for the activated IFN alpha and IFN gamma signaling pathways based on gene set enrichment analysis (GSEA) (figure 1H, online supplemental figure 3A,B). At 14 hours, the liver leucocyte population was dominated by recruited Ly6c2+ monocytes. The strong expression of Ccr2 in monocytes observed at 14 hours paired with the expression of Ccl2 in Kupffer cells at 7 hours after anti-CD40 mAb treatment was consistent with a process in which initial Kupffer cell activation led to inflammatory monocyte recruitment (online supplemental figure 4A,B). At 22 hours, there was additional recruitment of S100a8+ neutrophils. Across the whole process, we also observed a progressive shift in the endothelial cell population along an activation vector defined by progressive expression of the adhesion molecule Vcam1 (online supplemental figure 2A). The inflammatory activation of endothelial cells was consistent with the histopathological finding of extensive thromboses in the liver of the anti-CD40 mAb-treated mice.
Supplemental material

Anti-CD40 mAb treatment drives hepatotoxicity which requires Kupffer cell activation as the essential primary hit. (A) Representative image of a liver section stained with H&E from a C57BL/6 mouse harvested at 30 hours after intravenous injection of an agonistic anti-CD40 mAb (20 mg/kg). Dotted lines show the boundary between necrotic and healthy tissue. (B) Bar plots displaying plasma levels of alanine aminotransferase (ALT) in C57BL/6 mice at 30 hours after intravenous injection of an anti-CD40 mAb (n=4) vs saline (n=3). (C) Heatmap displaying z-scaled levels of plasma cytokines in C57BL/6 mice at 7 (n=5), 16 (n=5), 24 (n=5) or 30 hours (n=5) after intravenous injection of an anti-CD40 mAb or saline (0 hour, n=2) (blue=low concentration, red=high concentration). (D) Outline of the multiplexed scRNA-seq experiment: C57BL/6 mice were intravenously injected with an anti-CD40 mAb or saline (0 hours). After saline injection (n=1) or 7 (n=1), 14 (n=1) and 22 hours (n=1) after anti-CD40 mAb, livers were digested into a single-cell suspension and enriched for leucocytes using CD45-coated magnetic beads. Cells were harvested, tagged with DNA-barcoded antibodies and pooled into a single scRNA-seq sample for sequencing. Data generated from this experiment are shown in the subsequent panels. (E) UMAP plot displaying cells colored by condition. (F) UMAP plot displaying cells colored by cell type. (G) UMAP plots separated by treatment conditions (anti-CD40 mAb treatment for 7, 14, or 22 hours or saline) with color saturation corresponding to cellular density. Below each UMAP plot are horizontal stacked bar charts displaying the proportions of different cell types, with the same code color as in Panel 1F. (H) Dot plot displaying the results of a differential gene expression (DEG) analysis between Kupffer cells from anti-CD40 mAb-treated (7 hours) and saline-treated mice. Points are plotted according to the log-transformed fold change (logFC) on the y-axis and the base mean on the x-axis and colored according to the -log(p value). (I) Plasma levels of ALT in LysMCre CD40fl/fl (n=5) and CD40fl/fl (wild-type, n=7) (left) or in Clec4fCre CD40fl/fl (n=8) and CD40fl/fl (n=6, wild-type) (right) mice at 30 hours after intravenous injection of anti-CD40 mAb. (J) Hierarchical clustering analysis of z-scaled levels of plasma cytokines in LysMCre CD40fl/fl (n=7) and CD40fl/fl (n=7) (left) or in Clec4fCre CD40fl/fl (n=5) and CD40fl/fl (n=8, wild-type) (right) mice treated with an anti-CD40 mAb (30 hours, green) or saline (purple) (blue=low concentration, red=high concentration). (K) The data in (B, I, J) are presented as the mean±SD Each dot (B, I, J) or row (C) represents one mouse. T-test (B, I, J); n.s.=not significant, **p≤0.01, ***p≤0.001. mAb, monoclonal antibody; UMAP, uniform manifold approximation and projection.
The above described time course analysis suggested that Kupffer cell activation is the initial trigger of anti-CD40 mAb-induced liver disease. To evaluate the necessity of Kupffer cells as a driver of anti-CD40 mAb-induced immune toxicity in the liver, we studied two conditional CD40 knockout mouse strains. LysM-Cre CD40flox/flox mice have a deletion of CD40 in most macrophages throughout the body, while the deletion in Clec4f-Cre CD40flox/flox mice is restricted to Kupffer cells.33 In both models, the increase in ALT expression observed following anti-CD40 mAb treatment was significantly decreased, and no necrosis was detected in these mice by histology (figure 1I). By contrast, hierarchical clustering analysis of plasma cytokine levels showed that the systemic inflammatory response was abolished in only the LysM-Cre mice and not in the Clec4f-Cre mice (figure 1J). These results demonstrate that, while lineage selective conditional knockout of CD40 in all macrophages abolished hepatic and nonhepatic inflammation, suppression of CD40 signaling in Clec4f+ Kupffer cells abrogates anti-CD40 mAb-induced necro-inflammatory liver disease with only minimal adverse effects on systemic innate immune activation.
Collectively, this suggested that Kupffer cells might be a preferable drug target for the selective suppression of anti-CD40 mAb-associated liver toxicity.
Ter119 targets RBCs for phagocytosis by liver macrophages
After identifying Kupffer cells as a potential drug target to suppress anti-CD40-induced liver toxicity, we next sought to selectively reprogram liver macrophages into an anti-inflammatory phenotype. Liver macrophages are the default erythrophagocytes under conditions of enhanced RBC turnover.34 Furthermore, erythrophagocytosis followed by heme-activated NRF2 signaling transforms macrophages into an anti-inflammatory Hmox1highMarcohighMHCIIlow phenotype.27 We therefore, evaluated strategies to induce a controlled erythrophagocytosis to selectively reprogram liver macrophages, providing a novel anti-inflammatory mode of action to overcome anti-CD40 mAb-mediated liver toxicity.
Ter119 is a rat mAb that recognizes a glycophorin-associated protein on mouse RBCs.35 Using time-lapse fluorescence imaging, we demonstrated that Ter119 specifically induced the phagocytosis of pHrodo-labeled RBCs by mouse bone marrow (BM)-derived macrophages (BMDMs) over time (figure 2A). To study whether Ter119 directs RBCs to be selectively phagocytosed by liver macrophages in vivo, we labeled mouse RBCs with carboxyfluorescein succinimidyl ester (CFSE), incubated the cells with Ter119, and tracked their clearance from the blood into the liver after intravenous injection by flow cytometry analysis (figure 2B). Staining of the blood with a fluorescent goat anti-rat secondary reagent (AF 555) allowed us to clearly distinguish the CFSE-labeled, Ter119-opsonized RBC population from RBCs only opsonized with Ter119 or labeled with CFSE (figure 2C). Within 1 hour, we noted a rapid decline of CFSE+Ter119+ RBCs from the peripheral blood, while nonopsonized RBCs remained in the circulation (figure 2D). Non-invasive fluorescence imaging combined with infrared fluorescent labeling of RBCs demonstrated that Ter119+ RBCs were specifically trapped in the liver. No fluorescence signal was observed in the heart, spleen, kidneys, or colon (figure 2E). Finally, by confocal microscopy and flow cytometry, we found that the fluorescence signal of CFSE-labeled, Ter119-opsonized RBCs was contained within the F4/80+ liver macrophages (figure 2F–I). Collectively, these data suggest that Ter119 directs RBCs to be selectively phagocytosed by liver macrophages.

Ter119-opsonized RBCs are phagocytosed by liver macrophages. (A) BMDMs were exposed to different numbers of RBCs opsonized or not with the rat antibody Ter119 (400 µg/mL). Before exposition, the RBCs were labeled with red pHrodo. The cells were imaged every 15 min using a live-cell analyzer. The dot plot displays the mean fluorescence intensity of four replicates over time as a direct correlation to the number of phagocytosed erythrocytes. (B) Outline of the transfusion experiments: C57BL/6 mice were transfused with CFSE- or IVISense 680-labeled RBCs that were opsonized (Ter119+) or not (Ter119-) with the rat anti-mouse antibody Ter119 (667 µg/mL). Blood was collected every 10 min, and the clearance of the RBCs was analyzed by flow cytometry. After 45 min, the mice were sacrificed, and organs were collected for analysis with an IVIS Spectrum in vivo imaging system. Some animals were euthanized after 1 hour for flow cytometric analysis or liver histology of liver cell suspensions. (C) Untreated RBCs or in vitro rat Ter119-opsonized RBCs were labeled with CFSE (far red) or left unlabeled, and Ter119 opsonization was subsequently detected by staining the cells with an Alexa Fluor 555-conjugated goat anti-rat secondary antibody. The RBCs subjected to each treatment condition were pooled and evaluated by flow cytometry. (D) RBC clearance (number of CFSE-positive RBCs/mL of blood over time) after mouse transfusion as indicated in B. Blood was collected every 10 min and stained using an Alexa Fluor 555-coupled goat anti-rat secondary antibody to verify opsonization by the primary rat antibody Ter119. CFSE-positive RBCs were gated in each sample and counted to obtain the number per ml of blood. (E) Representative image of the far-red fluorescence of organs collected from mice transfused with IVIS sense 680-labeled Ter119+ or Ter119- (saline) RBCs 45 min after transfusion. Data are representative of three animals. (F) Representative immunofluorescence staining images of liver sections collected from mice transfused with CFSE-labeled Ter119+ or Ter119- RBCs (red) 1 hour after transfusion. The liver sections were stained with anti-Iba1 (green) and phalloidin (blue), and images were acquired with a confocal microscope using a 20 × objective. (G) Representative immunofluorescence staining image of liver macrophages phagocytosing CFSE-labeled Ter119-opsonized RBCs (red). The image was acquired from a liver section stained with anti-Iba1 (green) and Hoechst (blue) under a confocal microscope using a 63 × objective. (H) Flow cytometry contour plots of liver cell suspensions collected from mice transfused with CFSE-labeled Ter119+ or Ter119- RBCs 1 hour after transfusion. Cells were stained for F4/80 and gated from live CD45+ cells. (I) Cumulative data for the mean CFSE fluorescence intensity of CD45+F4/80+ cells in liver cell suspensions from mice transfused as described in H (n=4). (J) The data in I are presented as the mean±SD. Each dot represents one mouse (D, I) or one well (A). t test (I); **p≤0.01. BMDMs, bone marrow-derived macrophages; CFSE, carboxyfluorescein succinimidyl ester; RBCs, red blood cells.
mTer119 induces the transformation of liver macrophages into erythrophagocytes
As a next step, we established a treatment protocol involving an initial high dose of Ter119 antibody followed by repeated low-dose injections, as delineated in figure 3A. This protocol allowed us to reach a hematopoietic steady state with stimulated erythropoiesis compensating for the accelerated RBC clearance by liver macrophages. To avoid adverse immunological reactions, such as anaphylaxis and the generation of neutralizing antibodies, it was critical for these studies involving repeated injections to use a recombinant murine IgG2 antibody (mTer119), which was derived from the original rat Ter119 clone.30
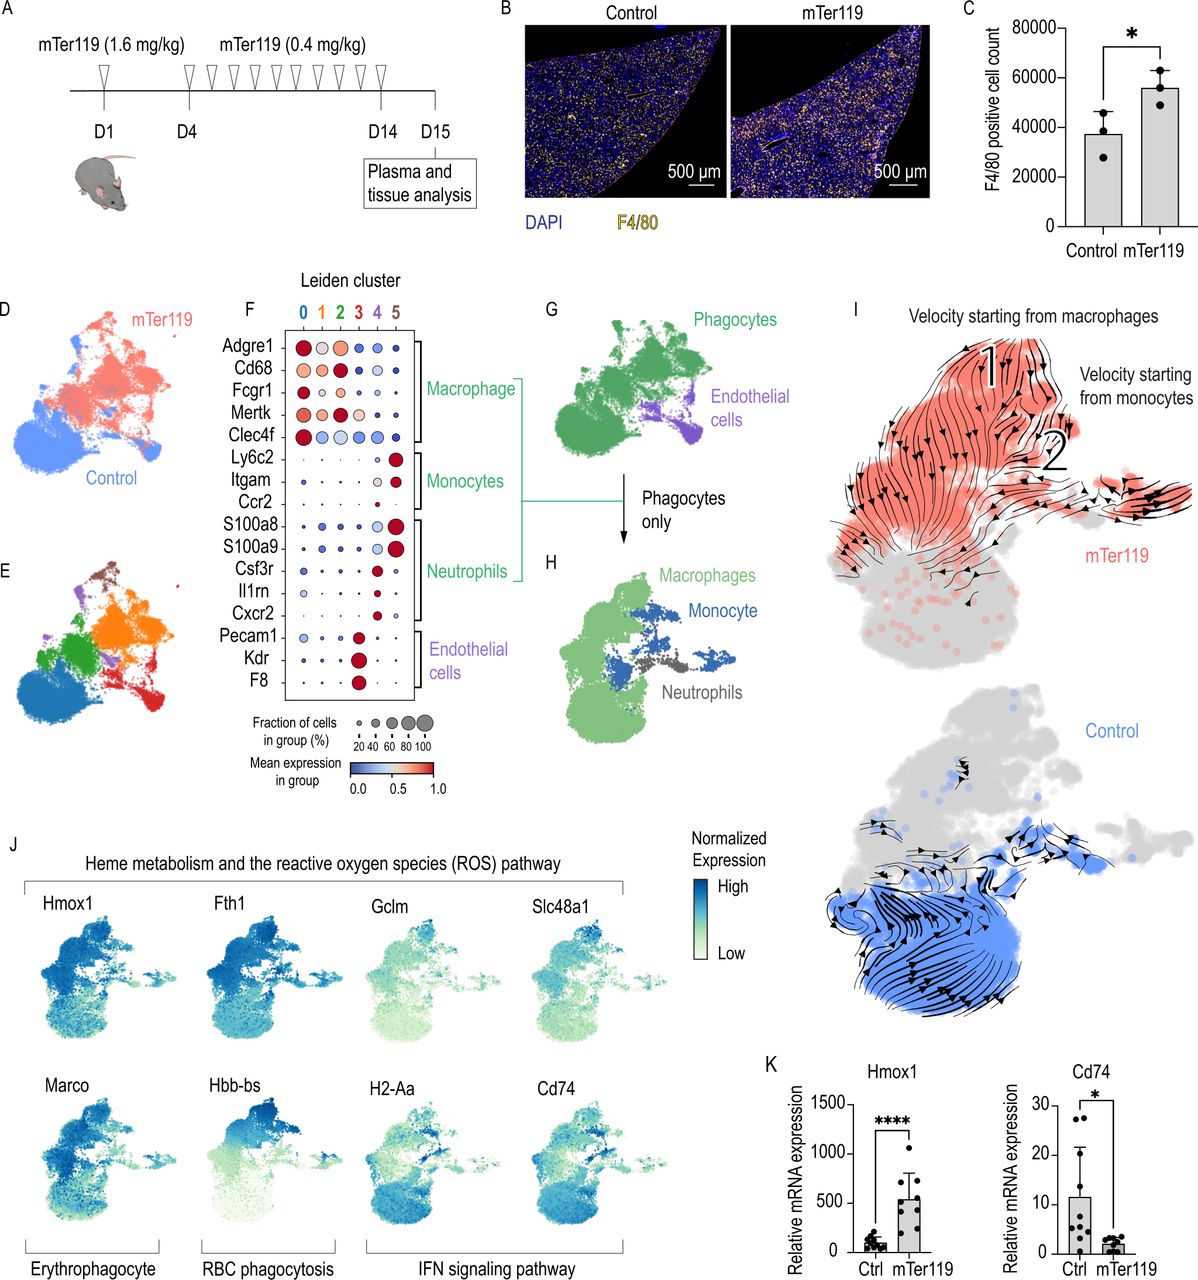
Chronic mTer119 antibody treatment transforms liver macrophages into erythrophagocytes. (A) Outline of the mTer119 treatment protocol: C57BL/6 mice were treated subcutaneously with a loading dose of the murine Ter119 (mTer119) antibody (1.4 mg/kg). After 4 days, a low dose (0.4 mg/kg) of the antibody was given on a daily basis for 10 days. The animals were sacrificed 24 hours after the last injection for analysis. As a control, saline or isotype control was injected with the same volume, concentration and frequency. (B) Representative immunofluorescence staining images of paraffin-embedded liver sections from C57BL/6 mice subjected to mTer119 treatment. The liver sections were stained with anti-F4/80 (yellow) and DAPI (blue), and the images were acquired using a Zeiss Axio scan. (C) Morphometric quantification of F4/80+ macrophage counts based on stained whole-liver sections from C57BL/6 mice subjected to mTer119 (n=3) or saline treatment (n=3). (D) UMAP plot of pooled scRNA-seq data from two sequencing experiments performed with liver cell suspensions from mTer119- (n=1) and saline-treated (n=1) mice. Before sequencing, the liver cells were enriched for macrophages using anti-F4/80 and anti-CD11b-coated magnetic beads. The enriched cell suspensions were then processed for scRNA-seq. Cells are colored by treatment (mTer119 or saline). (E) UMAP plot of cells colored by clusters as computed by the Leiden unsupervised clustering algorithm. (F) Dot plot displaying the scaled expression of canonical marker genes for each cell type and the proportion of cells in each cluster expressing those genes. (G) UMAP plot displaying cells colored by cell type. Macrophages, monocytes, and neutrophils were regrouped and displayed as phagocytes. (H) All cells marked as phagocytes in G were pooled into a new dataset and dimension reduction was calculated. UMAP plot displaying cells colored by cell type. (I) UMAP plots with cells colored by sample. RNA velocity vectors are superimposed onto the UMAP plots with arrows indicating the velocity direction and magnitude (arrow length). Velocities were calculated for each sample separately, only including the phagocyte populations (top: mTer119, bottom: saline). (J) UMAP plots with cells colored according to their expression of key genes associated with the erythrophagocytic phenotype (yellow=low expression, blue=high expression). (G) Hmox1 and Cd74 mRNA expression measured by RT-qPCR of liver macrophage isolated using anti-F4/80 coated magnetic beads from animals treated with isotype control (n=10) or mTer119 (n=9). (H) The data in C and K are presented as the mean±SD Each dot represents one mouse. T-test (C, K); *p≤0.05, ****p≤0.0001. RBC, red blood cell; scRNA-seq, single-cell RNA-sequencing; UMAP, uniform manifold approximation and projection.
We first analyzed the effect of repeated mTer119 injections on liver macrophage counts. IF staining demonstrated a 40% increase in the number of F4/80+ liver macrophages in mTer119-treated mice compared with control mice (figure 3B,C). This expansion of the liver macrophage population could be attributed to the recruitment of circulating monocytes using the Ms4a3Cre-RosaTdT monocyte fate-mapper mouse strain. In this mouse granulocyte-monocyte progenitors, common monocyte progenitors,36 and all their descendants are labeled by the fluorescent protein tdTomato. 24 hours after the last mTer119 injection, 40% of the CD45+F480+CD11b+ liver macrophages expressed tdTomato (online supplemental figure 5A,B), which was consistent with the overall 40% expansion of the macrophage pool. This expansion reflects the increased demand for erythrophagocytes, nevertheless we can not exclude that some Kupffer cells die after erythrophagocytosis and are subsequently replaced by recruited blood monocytes.
To study the phenotype of liver macrophages after mTer119 treatment, we performed a scRNA-seq study of liver cells that were enriched for macrophages by combined F4/80 and CD11b magnetic bead capture. In total, 9480 cells were analyzed from a mTer119-treated mouse, and 9611 cells were analyzed from a vehicle-treated mouse (figure 3D). By matching the gene expression of each cluster with canonical marker genes, we classified the cell clusters as macrophages, monocytes, neutrophils, and endothelial cells (figure 3E,F, online supplemental figure 6A,B). After regrouping all phagocytic cells, we recalculated dimension reduction and cell type assignment (figure 3G,H). We could observe a stark separation with little overlap of the phagocytes in the two conditions (figure 3I) indicating a pronounced effect of mTer119 on their transcriptional phenotype. We next performed a differential gene expression analysis between the macrophages of the antibody-treated mouse versus the vehicle-treated mouse before pathway enrichment analysis by GSEA (online supplemental figure 6C). Liver macrophages from the mTer119-treated mouse strongly increased expression of genes involved in heme metabolism and the reactive oxygen species pathway (Hmox1, Fth1, Gclm, Slc48a1) and the erythrophagocyte marker gene Marco,27 while genes linked to IFN signaling pathways and the inflammatory response (H2-Aa and Cd74) were suppressed (online supplemental figure 6D,E, examples highlighted in figure 3J). In the mTer119-treated mouse phagocytes, RNA velocity analysis revealed the direction of differentiation starting from macrophages (1) and monocytes (2). In both cases, the initial cell populations have a high Hbb-bs mRNA content, suggesting that macrophages undergo a differentiation process driven by phagocytosis of erythrocytes (figure 3I,J).
We confirmed the scRNA-seq data in a separate experiment by analyzing Hmox1 and Cd74 mRNA of liver macrophages that were isolated using anti-F4/80 antibody-coated Dynabeads from mTer119-treated mice and mice treated with an isotype-matched control antibody. We identified the same erythrophagocytic signature with increased expression of Hmox1 and suppressed Cd74 in the mTer119-treated animals (figure 3K). As further validation, we detected a strong increase of HMOX1 in liver macrophages of mTer119-treated mice compared with control animals by fluorescence immunohistochemistry. On mTer119-treatment, the fraction of F4/80+/HMOX1+ double positive macrophages increased from 6.9% to 67.8% (online supplemental figure 5C,D).
Collectively, these data suggest that mTer119 treatment induced extensive phenotypic transformation of the liver macrophages of mixed ontogeny, supporting the generation of a homogenous population of Hmox1highMarcohighMHCIIlow erythrophagocytes.
mTer119 prevents liver inflammatory toxicity induced by high-dose anti-CD40 mAb administration
To determine whether the mTer119-induced transformation of liver macrophages into erythrophagocytes could protect against anti-CD40 mAb-triggered liver disease, we challenged mTer119-treated mice with an anti-CD40 mAb 24 hours after the last mTer119 injection and analyzed the inflammatory response and liver toxicity 30 hours later (figure 4A). mTer119 treatment prevented the generation of morphological evidence of liver necrosis (figure 4B,C) and the increase of ALT plasma levels (figure 4D). However, anti-CD40 mAb-induced plasma cytokine levels remained high despite mTer119 treatment, consistent with a liver-selective mode of action (figure 4E). Ter119 treatment did also not reduce anti-CD40 mAb-induced colitis, as denoted by similar increases in colon crypt length and the disappearance of goblet cells (figure 4F,G) in both mTer119-treated mice and control mice subjected to anti-CD40 mAb.

Chronic mTer119 treatment protects against liver toxicity induced by anti-CD40 mAb treatment. (A) Experimental design for anti-CD40 mAb challenge: C57BL/6 mice were first subjected to mTer119 treatment (1.4 mg/kg, followed by 0.4 mg/kg daily) before challenge with anti-CD40 mAb (20 mg/kg) 24 hours after the last dose of mTer119. The mice were sacrificed 16 or 30 hours later for cytokine or plasma transaminase measurements, respectively. (B) Representative images of liver sections stained with H&E from a C57BL/6 mouse subjected to mTer119 (n=12) or saline treatment (n=14) and challenged with an anti-CD40 mAb. (C) Morphometric quantification of the necrotic area (percentage of the total liver area) of mice treated as described in A (mTer119 n=12, saline n=14). (D) Plasma ALT levels measured in C57BL/6 mice subjected to mTer119 (n=8) or saline treatment (n=11) and challenged with an anti-CD40 mAb. (E) Heatmap showing unsupervised hierarchical clustering of plasma cytokine levels in C57BL/6 mice subjected to mTer119 (n=7) or saline treatment (n=7) and challenged with an anti-CD40 mAb (n=8, blue=low concentration, red=high concentration) (gray mark=presence of treatment, white=absence of treatment). (F) Representative images of crypts in colon sections stained with H&E from a C57BL/6 mouse subjected to mTer119 antibody treatment or saline treatment and challenged with or without an anti-CD40 mAb. (G) Average crypt length (µm) calculated from 20 measurements of colon sections from C57BL/6 mice subjected to mTer119 (n=7) or saline treatment (n=6) and challenged with or without an anti-CD40 mAb. (H) Experimental design for anti-CD40 mAb challenge with macrophage isolation: C57BL/6 mice were first subjected to mTer119 treatment before challenge with anti-CD40 mAb 24 hours after the last dose of mTer119. The mice were sacrificed 16 hours later and underwent peritoneal lavage as well as liver and colon harvesting and digestion. Single-cell suspensions from the liver, colon and peritoneal cavity were enriched for macrophages using F4/80-coated Dynabeads, and macrophage gene expression was analyzed by RT-qPCR. (I) Heatmap showing unsupervised hierarchical clustering analysis of Cxcl9, Cxcl10 and Il12b gene expression in liver (orange) or colon (purple) macrophages in C57BL/6 mice subjected to mTer119 antibody treatment or saline treatment and challenged with or without an anti-CD40 mAb. Organs were digested into single-cell suspensions, macrophages were isolated using anti-F4/80-coated magnetic beads, and gene expression was measured by RT-qPCR (blue=low gene expression, red=high gene expression). The clustering analysis classified animals into inflamed and noninflamed groups (gray mark=presence of treatment, white=absence of treatment). (J) Contingency tables (mTer119 treatment × inflammation) of the classified animals separated by organ; data were analyzed with Fisher’s exact test. (K) Heatmap showing unsupervised hierarchical clustering analysis of Cxcl9, Cxcl10 and Il12b gene expression in liver (orange) or colon (purple) macrophages in C57BL/6 mice subjected to etanercept (eta) treatment (two intraperitoneal (i.p.) injections of 100 mg/kg on days −3 and −1) or saline treatment and challenged with or without an anti-CD40 mAb. The clustering analysis classified animals into inflamed and noninflamed groups (gray mark=presence of treatment, white=absence of treatment). (H) Contingency tables (etanercept treatment x inflammation) of the classified animals separated by organ; data were analyzed with Fisher’s exact test. The data in C, D, and G are presented as the mean±SD. Each dot (C, D, G) or row (E, I, K) represents one mouse. T-test (C, D), ANOVA (G), Fisher’s exact test (J, L); n.s.=not significant, *p≤0.05, **p≤0.01, ****p≤0.0001. ANOVA, analysis of variance; mAb, monoclonal antibody.
Collectively, these experiments suggest that mTer119-induced erythrophagocytic transformation exhibits liver-specific anti-inflammatory organ tropism.
mTer119 suppresses selectively anti-CD40 mAb-induced hepatic macrophage inflammation
To further assess whether the mTer119-induced anti-inflammatory effect is liver-specific, we analyzed the CD40 ligation-induced cytokine mRNA expression of F4/80+ macrophages isolated from the liver, colon, or peritoneal cavity of anti-CD40 mAb versus saline-treated mice. We also compared the anti-inflammatory activity of mTer119 with the one issued by the TNF blocker etanercept, which is a non-liver specific anti-inflammatory and immunosuppressive drug (figure 4H). Figure 4I provides a visual representation of the early mRNA expression levels of the inflammation markers Cxcl9, Cxcl10, and Il12b in colon and liver macrophages 16 hours after anti-CD40 mAb treatment quantified by RT-qPCR. An unsupervised clustering analysis allowed us to segregate the macrophages into two main clusters, which were defined as ‘inflamed’ and ‘noninflamed’, based on the cytokine expression of saline-treated (control) and anti-CD40 mAb-treated animals. This clustering could then be used to classify the macrophage samples from mTer119 plus anti-CD40 mAb-treated animals in a cross table. All colon macrophage samples from the mTer119 plus anti-CD40 mAb group were classified as inflamed, suggesting that mTer119 treatment did not attenuate anti-CD40 mAb-triggered inflammation in colon macrophages. By contrast, all liver macrophage samples from the mTer119 plus anti-CD40 mAb animals were classified as noninflamed, confirming the robust and specific anti-inflammatory effect of mTer119 treatment on the liver (figure 4J). In contrast to the liver-specific anti-inflammatory activity of mTer119, pretreatment of mice with etanercept (eta) before anti-CD40 mAb treatment profoundly suppressed the cytokine responses in both organs (figure 4K,L). Similar results were observed in a separate study analyzing the response of peritoneal macrophages; mTer119 did not change the inflammatory outcome of anti-CD40 treatment, but the inflammatory cytokine response induced by anti-CD40 mAb treatment was attenuated by etanercept (online supplemental figure 7A,B).
Collectively, these experiments demonstrated that mTer119 selectively suppressed macrophage inflammation in the liver, leaving the inflammatory responses of macrophages in the colon and peritoneum unaffected. This organotropic anti-inflammatory function diverged from the function of etanercept, which non-selectively impaired inflammation in the liver, colon and peritoneum.
mTer119 does not suppress systemic immunity or the antitumor activity of anti-CD40 mAbs
After establishing the organotropic nature of the effect of mTer119 on anti-CD40 mAb-induced inflammatory toxicity, we aimed to determine whether mTer119 has anti-inflammatory or immunosuppressive effects in generic models of systemic inflammation.
First, we investigated the effect of mTer119 on systemic inflammation after the injection of lipopolysaccharide (LPS) or an agonistic anti-CD3 antibody by measuring plasma cytokines 4 hours after LPS injection and 3 hours after anti-CD3 antibody injection. In both experiments, hierarchical clustering analysis confirmed that mTer119 treatment had no systemic anti-inflammatory effect (figure 5A,B, online supplemental figure 8).

Anti-CD40 mAb-mediated systemic inflammation and antitumor activity are preserved with mTer119 treatment. (A) Experimental design of the LPS experiment: C57BL/6 mice were chronically treated with the antibody mTer119 or saline and injected i.p. with LPS (6 mg/kg). Blood was sampled before and 4 hours after the LPS injection to measure cytokine levels. Bottom left: Heatmap showing unsupervised hierarchical clustering analysis of plasma cytokine levels (blue=low concentration, red=high concentration). The clustering analysis classified animals into inflamed and noninflamed groups. Bottom right: Contingency tables summarizing the effects of mTer119 on inflammation status in saline- and LPS-treated animals; data were analyzed with Fisher’s exact test with a significance threshold of p≤0.05 (n.s.=not significant). (B) Experimental design of the agonistic anti-CD3 antibody experiment: C57BL/6 mice were chronically treated with the antibody mTer119 or saline and injected intravenous with an anti-CD3 antibody (100 µg). Four hours later, the animals were sacrificed, and blood was collected for proinflammatory cytokine measurement. Bottom left: Heatmap showing unsupervised hierarchical clustering analysis of plasma cytokines (blue=low concentration, red=high concentration). Bottom right: Contingency tables summarizing the effects of mTer119 on the inflammation status in saline- and anti-CD3-treated animals; data were analyzed with Fisher’s exact test with a significance threshold of p≤0.05 (n.s.=not significant). (C) Schematic representation of the adoptive transfer experiment. CD8+ and CD4+ T cells were isolated from the spleen of CD45.1 x OT-1 or CD45.1 x OT-2 mice, labeled with CFSE and injected intravenous into mTer119 or saline-treated mice. Two hours later, the mice were subcutaneously immunized with the ovalbumin (OVA) protein mixed with or without an anti-CD40 mAb. Three days later, the draining lymph nodes were collected, and the proliferation of transferred T cells was assessed by evaluating the degree of CFSE dilution by flow cytometry. Bottom: Cumulative data showing the proportion of proliferating cells within each division for each condition. The number of divisions was assessed by measuring the dilution of the CFSE signal. (D) Experimental design for mTer119+anti-CD40 mAb treatment of tumor-bearing mice: C57BL/6 J mice were treated with mTer119 (1.4 mg/kg, followed by 0.4 mg/kg daily) or saline for 7 days before s.c. injection of MC38 tumor cells into the flanks. The tumors were left to grow for seven more days while continuing daily mTer119 treatment before intravenous injection of an anti-CD40 mAb (20 mg/kg) for a first time, followed by a second intravenous injection on day 9. Tumor volume was measured 1 day before anti-CD40 mAb treatment (day 6) and every other day until the end of the experiment on day 15. Bottom: Line plot displaying MC38 tumor volume over time (days after tumor injection). Each dot represents the mean of five animals±95% CI (n=5). Each dot (C) or row (A, B) represents one mouse. CFSE, carboxyfluorescein succinimidyl ester; LPS, lipopolysaccharide.
Second, we evaluated antigen-specific CD8+ and CD4+ T-cell responses using OT-1 and OT-2 recombinant T cell receptor mouse models. The T cells of these mice recognize OVA protein presented in the context of MHC class I or II, respectively. CFSE-labeled CD8+ and CD4+ T cells from OT-1 and OT-2 CD45.1 mice, respectively, were transferred into mTer119- or saline-treated C57BL/6 CD45.2 mice by intravenous injection. The proliferation of CD45.1+ T cells in the draining lymph nodes was measured 3 days after subcutaneous administration of ovalbumin with or without anti-CD40 mAb treatment. The administration of ovalbumin combined with anti-CD40 mAb increased the proliferation of antigen-specific CD45.1+CD8+ or CD4+ T cells in the lymph nodes compared with that on the administration of ovalbumin alone, indicating that the anti-CD40 mAb is an excellent enhancer of antigen-specific T-cell stimulation in this model. mTer119 treatment did not attenuate this response (figure 5C, online supplemental figure 7C,D).
Finally, we assessed whether mTer119 treatment affects the antitumor effect of anti-CD40 mAb therapy using a mouse MC38 colon adenocarcinoma tumor. We subcutaneously injected tumor cells into saline- or mTer119-treated mice (day 1) and then administered two injections of anti-CD40 mAb on days 7 and 9; the tumor volume was measured at regular intervals up to day 14. We found that anti-CD40 mAb treatment significantly diminished cancer cell growth and that mTer119 did not abolish this beneficial treatment effect (figure 5D).
Collectively, these results suggest that the targeted erythrophagocytic transformation of liver macrophages induced by mTer119 treatment does not suppress innate or adaptive immune responses or antitumor immunity outside the liver.
Discussion
Immune-mediated liver toxicity has been recognized as a dose-limiting adverse effect of agonistic anti-CD40 mAbs.13 To decipher the mechanism of liver toxicity and rationally design a strategy to abrogate this off-target effect without blunting the antitumor efficacy, we performed a time-resolved scRNA-seq study, which delineated a sequence of initial Kupffer cell activation, followed by monocyte recruitment and the subsequent accumulation of neutrophilic granulocytes. In parallel, we observed progressive inflammatory endothelial cell activation consistent with widespread thrombotic liver ischemia. Subsequent experiments with CD40 conditional knockout mice revealed the decisive triggering function of Kupffer cells in this cascade. The precise pathophysiological framework derived from these studies suggested that a selective anti-inflammatory reprogramming strategy targeting Kupffer cells could disconnect the hepatic and extrahepatic immunostimulatory activities of high-dose anti-CD40 mAb treatment protocols. In the next step, we provide evidence that the tissue-specific function of liver macrophages to clear RBCs from the blood can be exploited to selectively induce a heme-driven anti-inflammatory pathway. Targeting host RBCs with a recombinant mAb protected mice against liver toxicity associated with high-dose administration of agonistic anti-CD40 mAbs. The same treatment protocol did not attenuate anti-CD40 mAb-induced systemic inflammation, peripheral antigen-specific immunity enhancement, or tumor control, suggesting that this approach uncouples the proinflammatory and anti-inflammatory macrophage signaling pathways of hepatic and extrahepatic macrophage populations.
Our therapeutic reprogramming strategy takes advantage of the unique function of resident liver macrophages to trap and phagocytose antibody-marked RBCs from the blood during hemolytic stress.34 37 Consistent with this model, we have presented the results from a number of experiments demonstrating that Ter119-IgG2-opsonized RBCs localized selectively to liver macrophages shortly after infusion and that repeated low-dose mTer119 administration induced a phenotypic switch in liver macrophages into anti-inflammatory erythrophagocytes, providing protection against high-dose anti-CD40 mAb-induced liver toxicity. Our scRNA-seq and fate mapping studies revealed that the phenotypically homogenous erythrophagocytes had a mixed ontogeny of phenotype-transformed Kupffer cells and peripheral blood monocytes most likely recruited via Ccl2-Ccr2 signaling. This is consistent with the previous observation that administration of a single large dose of the Ter119 antibody leads to rapid secretion of the monocyte-attracting chemokine CCL2, monocytosis in the blood, and subsequent recruitment of monocytes to the liver macrophage niche.30 This hematopoietic feedback loop rapidly expands erythrophagocyte capacity in the liver during hemolytic stress.
Induced erythrophagocytosis exploits a unique mode of action by delivering large doses of the endogenous metabolite heme into macrophages, where it evokes a pronounced anti-inflammatory effect via oxidative signaling and NRF2 activation.27 The liver-selective organ tropism provided by our erythrophagocytosis-based macrophage reprogramming strategy is essential. Heme could act as an oxidative toxin if hemolysis would be induced in a less specific way,31 38 and widespread activation of heme-NRF2 signaling in the hematopoietic compartment causes severe dysfunction in the myeloid lineage,39 resulting in deficient dendritic cell generation, impaired antigen presentation, and macrophage dysfunction.40 This has been observed in mouse models of sickle cell anemia and spherocytosis, both of which display intravascular hemolysis with systemic heme exposure and immunosuppression.40 Additionally, administration of a single large dose of Ter119 was shown to induce a transient anti-inflammatory state in mice via an unresolved mechanism.30 In light of these observations, we performed a thorough search for extrahepatic off-target effects of our treatment protocol. We not only investigated anti-CD40 mAb-induced systemic inflammation and antigen-specific immune augmentation, but also explored more generic inflammatory models induced by LPS or agonistic anti-CD3 antibody injection. None of these studies identified a signal of systemic immunosuppression by mTer119, supporting its liver specific activity. This might be a significant advantage over non-liver-selective macrophage targeting strategies (eg, by using CSF1 blocking agents), because tumoricidal macrophage activation induced by anti-CD40 antibodies seems to support therapeutic efficacy.2 41
While our model aims at selectively attenuating anti-CD40 antibody effects in the liver, alternative approaches aim to prevent liver toxicity by selectively enhancing CD40 activity in the tumor or subsets of immune cells driving antitumor effects. Such approaches have been expedited by the innovative design of bispecific antibodies targeting tumor-associated antigens or dendritic cell surface markers, in addition to CD40, or by selective delivery of CD40 agonists into the tumor tissue.42–48
The practical translation of our RBC-based macrophage reprogramming approach has to be defined in future preclinical studies focused on tolerability, safety, and efficacy. A significant parameter to be defined is how to reach a level of erythrophagocytosis in the liver sufficient to achieve consistent liver protection while avoiding severe hemolytic anemia. Potential strategies may include repeat low-dose antibody dosing, erythropoietic growth-factor support, or prophylactic retransfusion of antibody-coated autologous RBCs in patients undergoing anti-CD40 therapy. Ultimately, the clinical acceptance of any of these approaches will be determined by the magnitude by which clinical efficacy could be enhanced by applying high-dose antibody protocols with absent or significantly reduced liver toxicity.
Collectively, our experiments establish the fundamental concept that organ-specific reprogramming of macrophage phenotypes can fine-tune the response to systemic immunotherapy, uncoupling undesirable irAEs from antitumor activity. Such a prophylactic ‘conditioning’ strategy could significantly expand the safety margin of treatment protocols to allow use of higher and more effective doses of immunostimulatory antibodies. Beyond treating irAEs, selective anti-inflammatory reprogramming of liver macrophages could be a promising strategy to therapeutically approach a broader spectrum of inflammatory liver diseases, such as nonalcoholic fatty liver disease, alcoholic liver disease, and viral hepatitis.
Supplemental material
Data availability statement
Data are available in a public, open access repository. Data are available on reasonable request.
Ethics statements
Patient consent for publication
Acknowledgments
We thank Dr. Florent Ginhoux (SingHealth and Duke NUS, Singapore) for providing the Ms4a3Cre mice and CSL Behring (Jennifer Brasseit) for providing recombinant mTer119- antibody.
References
Supplementary materials
Supplementary Data
This web only file has been produced by the BMJ Publishing Group from an electronic file supplied by the author(s) and has not been edited for content.
Footnotes
MP and ILD contributed equally.
Contributors MP and ILD performed experiments, analyzed data, and wrote the paper. RMB and ED analyzed single cell data, NS-L, LB, KH and LI performed experiments. SK produced recombinant mTer119 antibody. DLR and TR performed the in vivo LPS experiment. RH performed experiments and designed the graphical abstract. DJS designed the study and wrote the paper. FV designed the study, analyzed data, and wrote the paper.
Funding This study was supported by the Swiss National Science Foundation: MD-PhD scholarship to MP, project 323530_183984, project grant 310030_207418 to TR, project grant 310030_197823 to DJS, and project grant 310030_201202/1 to FV), the Forschungskredit of the University of Zurich (project F-21- 031 to MP), the Fondation Carigest/Promex Stiftung für die Forschung (Geneva, Switzerland) to TR, and by the Vontobel Foundation (to FV).
Competing interests None declared.
Provenance and peer review Not commissioned; externally peer reviewed.
Supplemental material This content has been supplied by the author(s). It has not been vetted by BMJ Publishing Group Limited (BMJ) and may not have been peer-reviewed. Any opinions or recommendations discussed are solely those of the author(s) and are not endorsed by BMJ. BMJ disclaims all liability and responsibility arising from any reliance placed on the content. Where the content includes any translated material, BMJ does not warrant the accuracy and reliability of the translations (including but not limited to local regulations, clinical guidelines, terminology, drug names and drug dosages), and is not responsible for any error and/or omissions arising from translation and adaptation or otherwise.