Article Text

Abstract
Background The presence of a highly immunosuppressive tumor microenvironment has limited the success of immune checkpoint therapy (ICT). Immune suppressing myeloid cells with increased production of reactive oxygen species are critical drivers of this immunosuppressive tumor microenvironment. Strategies to limit these immune suppressing myeloid cells are needed to enhance response to ICT.
Methods To evaluate the contribution of myeloperoxidase (MPO), a myeloid lineage-restricted enzyme and a major source of reactive oxygen species, to mediating ICT response, we compared treatment outcome and immune composition in wild-type, MPO-deficient (MPO−/−), and MPO inhibitor-treated wild-type mice using established primary melanoma models.
Results Tumor growth and survival studies demonstrated that either host deficiency (MPO−/−) or pharmacological inhibition of MPO enhanced ICT response in two preclinical models of established primary melanoma in aged animals. The tumor microenvironment and systemic immune landscape underwent striking changes in infiltration of myeloid cells, T cells, B cells, and dendritic cells in MPO−/− mice; furthermore, a significant increase in myeloid cells was observed in ICT non-responders. The contribution of CD4+ T cells and NK cells during ICT response also changed in MPO−/− mice. Interestingly, MPO enzymatic activity, but not protein, was increased in CD11b+Ly6G+ myeloid cells isolated from marrow, spleen, and peritoneal cavities of mice bearing untreated melanoma, indicating systemic activation of innate immunity. Notably, repurposing MPO-specific inhibitors (verdiperstat, AZD5904) in combination with ICT pointedly enhanced response rates above ICT alone. Indeed, long-term survival was 100% in the YUMM3.3 melanoma model on treatment with verdiperstat plus ICT.
Conclusion MPO contributes to ICT resistance in established melanoma. Repurposing MPO-specific inhibitors may provide a promising therapeutic strategy to enhance ICT response.
- immunity, innate
- immunotherapy
- melanoma
Data availability statement
Data are available in a public, open access repository. All data relevant to the study are included in the article or uploaded as online supplementary information. All data relevant to the study are included in the article, uploaded as online supplementary information or have been deposited in the public, open access repository NCBI’s Gene Expression Omnibus and are accessible through GEO Series accession number GSE215005 (https://www.ncbi.nlm.nih.gov/geo/query/acc.cgi?acc=GSE215005).
This is an open access article distributed in accordance with the Creative Commons Attribution Non Commercial (CC BY-NC 4.0) license, which permits others to distribute, remix, adapt, build upon this work non-commercially, and license their derivative works on different terms, provided the original work is properly cited, appropriate credit is given, any changes made indicated, and the use is non-commercial. See http://creativecommons.org/licenses/by-nc/4.0/.
Statistics from Altmetric.com
WHAT IS ALREADY KNOWN ON THIS TOPIC
Specific enzymes expressed by immune suppressing myeloid cells, including myeloperoxidase (MPO), have emerged as contributors to immune checkpoint therapy (ICT) resistance. However, a deeper characterization of the mechanistic effects of MPO on the tumor microenvironment and how MPO contributes to ICT response is needed.
WHAT THIS STUDY ADDS
Combination ICT and verdiperstat, an FDA-registered MPO-specific inhibitor evaluated clinically to treat neurodegenerative disorders, demonstrated 100% long-term survival in the YUMM3.3 primary melanoma model.
Data indicated that the biochemical activity of MPO per se was enhanced in the presence of established melanoma, not simply content levels of MPO protein.
Regarding improved ICT outcome, the dependency of myeloid cell MPO deficiency and inhibition was observed only in aged 6-month-old mice.
HOW THIS STUDY MIGHT AFFECT RESEARCH, PRACTICE, OR POLICY
Pharmacological inhibition of MPO may be an effective adjuvant with immunotherapies to improve responses by limiting myeloid cell activity.
Aged mice may provide a better representation of the clinical course of melanoma and immunotherapy response.
Introduction
Immunotherapy has emerged as a standard of care in cancer therapy in the past decade. Although immune checkpoint therapy (ICT) has demonstrated durable response in a subset of patients with melanoma, the majority of patients do not respond.1–5 The presence of a highly immunosuppressive tumor microenvironment has limited the success of ICT.6–8 Myeloid-derived suppressor cells (MDSCs), representing pathologically activated immature myeloid cells, are critical drivers of this immunosuppressive tumor microenvironment, negatively correlating with ICT efficacy and contributing to ICT resistance.6–10 While there are several mechanisms that contribute to MDSC immunosuppression, an important mechanism of suppression by murine MDSCs is the increased production of reactive oxygen species (ROS).10–12 The myeloid lineage-restricted enzyme, myeloperoxidase (MPO), being expressed at high levels in MDSCs, is a major source of ROS.9–15 MPO is fundamental to the execution of the phagocytotic pathway in activated neutrophils and macrophages and is central to cellular innate immunity.16 We previously demonstrated that MPO activity per se mediated anti-tumor effects impacting early progression of B16F10 melanoma growth in aged mice.17
The role of innate immunity is well known to be context dependent where myeloid cells have been shown to both aid and inhibit tumor growth.17 18 Furthermore, in models ranging from traumatic brain injury to metabolic disease, phenotypes can also depend on the age of the organism at the time of the insult. Therefore, in this study, we focused on evaluating the contribution of MPO in the tumor microenvironment in established tumors in adult (aged) murine models of ICT, suggested to better capture human clinical phenotypes. We observed a clear context-dependent impact of MPO on treatment outcomes. Critically, in contrast to MPO during early progression, our findings in adult mice, in the context of ICT, demonstrated that MPO inhibition with both tool compounds and clinically translatable inhibitors enhanced CD8+-dependent ICT response in preclinical models of established melanoma.
Results
Genetic MPO deficiency enhances ICT efficacy
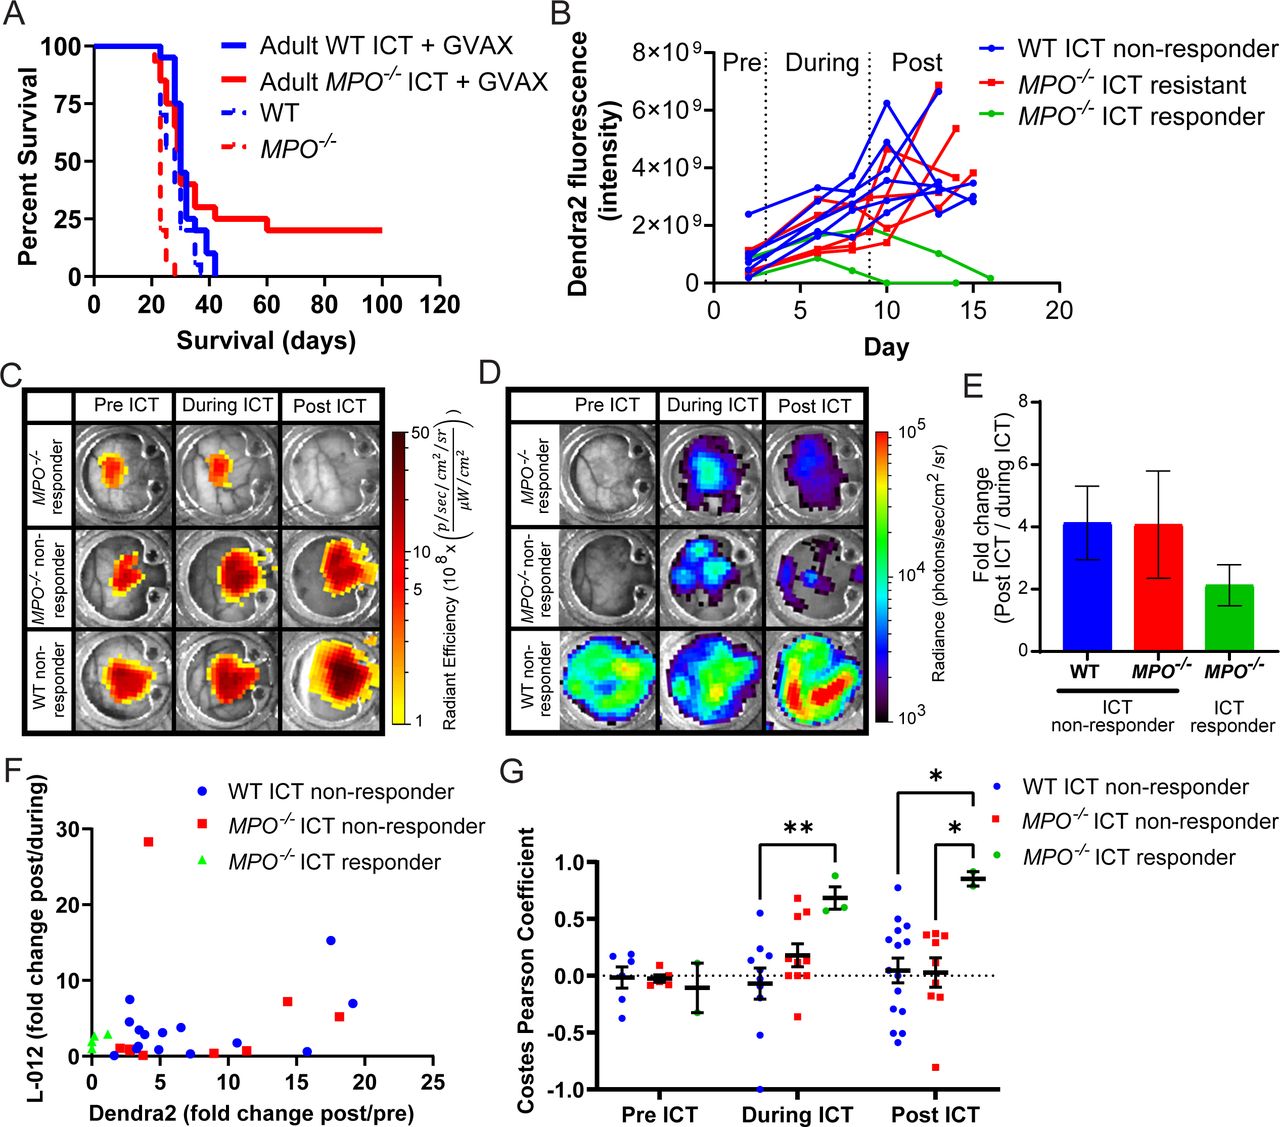
We evaluated how MPO activity impacted the response of established melanoma to ICT. Using a syngeneic immunocompetent orthotopic model, ICT efficacy was compared in wild-type C57BL/6 (WT) and age-matched syngeneic MPO-null (MPO−/−) animals using the B16F10 murine melanoma cell line. All studies were performed with adult 6-month-old animals to more accurately recapitulate human clinical experience.19 Long-term survival studies (non-palpable tumors at 90 days post–melanoma inoculation) with combination anti-PD-1 and anti-CTLA4 treatment (ICT) boosted with GVAX, a standard published protocol,20 showed that long-term survivors were only observed in MPO−/− animals, but not reaching statistical significance by standard analysis (figure 1A, online supplemental figure S1A, ICT with GVAX WT/MPO−/−: hazard ratio (HR)=1.32, p=0.34). By contrast, combination ICT plus GVAX demonstrated no long-term survivors in aged adult WT mice (figure 1A, online supplemental figure S1A). Using intravital imaging with skinfold window-chamber animal models, we evaluated in real time B16F10 tumor response and quantified both the MPO activity and ROS levels within the tumor microenvironment during ICT plus GVAX (figure 1B–G). B16F10 cells stably expressed a constitutively active cytomegalovirus (CMV)-driven dendra2 fluorophore to specifically assess tumor mass by dendra2 fluorescence. Similar to the subcutaneous tumor survival studies, ICT with GVAX response was only observed in MPO-deficient animals manifested by dendra2 fluorescence signals that disappeared in ICT responders compared with non-responders (figure 1B,C). Concurrently, L-012 bioluminescence imaging was used to assess enzymatic MPO activity and levels of ROS from any source within infiltrating innate immune cells in real time in vivo (figure 1D), and the fold-change of L-012 bioluminescence (post-ICT over during-ICT) was quantified. ICT plus GVAX non-responders demonstrated higher fold-change in L-012 compared with ICT responders (figure 1E). In WT ICT with GVAX non-responding mice, a positive correlation was observed using quantitative image analysis of fold-change L-012 bioluminescence with B16F10 tumor mass (figure 1F, p<0.05). These data suggested that ICT plus GVAX non-responders had increased levels of MPO activity and ROS in the tumor microenvironment. Of note, in ICT with GVAX responders, L-012 bioluminescence and tumor dendra2 fluorescence signals remained low. Furthermore, pixel intensity spatial co-localization of B16F10 cell-mediated dendra2 fluorescence and proximate L-012 bioluminescence was evaluated. MPO−/− ICT plus GVAX responders demonstrated Costes Pearson coefficients that approached 1, which were significantly different compared with ICT non-responders during and post-ICT (figure 1G), suggesting that ICT with GVAX response has increased non-MPO ROS sources co-localized (infiltrating) within the tumor.
Supplemental material

ICT with GVAX efficacy in WT and MPO−/− melanoma-bearing animals. (A) Survival studies of B16F10 tumor-bearing 6-month-old WT and MPO−/− animals treated with ICT and GVAX (n=20 adult WT and MPO−/− animals) or untreated (previously reported, n=15 WT and MPO−/− animals17); HR of ICT with GVAX WT/MPO−/− is 1.32 with log-rank (Mantel-Cox) test, p=0.34, comparing ICT with GVAX-treated WT and MPO−/− B16F10 tumor-bearing mice. (B) In B16F10 tumor-bearing skin window-chamber WT and MPO−/− animals, quantification of intravital imaging of B16F10 dendra2 fluorescence over time in each individual animal during ICT plus GVAX treatment (pre-ICT: day 2, during ICT: days 3–9, post-ICT: days 10–16); n=2 MPO−/− ICT responders, n=5 MPO−/− ICT non-responders, n=6 WT ICT non-responders. Each animal imaged several times (ICT WT non-responder images: n=6 pre, n=10 during, n=15 post; MPO−/− ICT non-responder images: n=5 pre, n=10 during, n=9 post; MPO−/− ICT responder images: n=2 pre, n=3 during, n=2 post). Representative macroscopic intravital images of the same skin window chamber in B16F10 melanoma-bearing WT and MPO−/− animals during ICT with GVAX treatment showing (C) B16F10 tumor dendra2 fluorescence and (D) L-012 bioluminescence. (E) L-012 bioluminescence quantification of fold change (post-ICT over during ICT). (F) For WT ICT with GVAX non-responders, positive correlation of fold change L-012 bioluminescence (post-ICT over during ICT) with fold change dendra2 fluorescence (post-ICT over pre-ICT), Pearson coefficient, r=0.49 (p<0.05). (G) Pixel intensity spatial colocalization quantification (Costes Pearson coefficient) of B16F10 cell-mediated dendra2 fluorescence and proximate L-012 bioluminescence of MPO activity and ROS. Two-way ANOVA followed by Tukey’s multiple comparison test; *p<0.05, **p<0.01. ICT, immune checkpoint therapy; MPO, myeloperoxidase; ROS, reactive oxygen species; WT, wild type.
Given the lack of response in WT adult mice treated with ICT and GVAX, combined with the fact that ICT treatment of melanoma in the clinic does not use GVAX,3–5 we mimicked the clinical setting and evaluated ICT treatment without the use of GVAX in all subsequent experiments. A subset of adult WT animals with established B16F10 tumors demonstrated long-term survival when treated with ICT alone, although in only 10% of animals. MPO−/− animals treated with ICT supported the trend of an increase in long-term survivors, although not statistically significant by standard analysis (figure 2A, online supplemental figure S1B, ICT WT/MPO−/−: HR=0.81, p=0.39). Using a second syngeneic immunocompetent orthotopic melanoma model, YUMM3.3, a stronger long-term ICT treatment response was observed (50%), and again, MPO deficiency trended toward an enhanced ICT response, but not reaching statistical significance by standard analysis (figure 2B, online supplemental figure S1C, ICT WT/MPO−/−: HR=1.60, p=0.51). However, given the trend that MPO deficiency consistently enhanced ICT long-term survival across multiple groups compared with WT, statistical significance was indeed observed when a Fisher exact test was used to evaluate differences across all groups (p=0.063, two-sided Fisher exact test; p=0.045, one-sided Fisher exact test). No differences in intrinsic YUMM3.3 tumor growth or animal survival were observed in untreated adult WT and MPO−/− animals (figure 2B, online supplemental figure S1C).

ICT efficacy in WT and MPO−/− melanoma-bearing animals. (A) Survival studies of B16F10 tumor-bearing 6-month-old WT and MPO−/− animals treated with ICT (n=33 adult WT animals, n=32 adult MPO−/− animals) or WT animals treated with IgG control (n=3), or untreated (previously reported, n=15 WT and MPO−/− animals17); HR of ICT WT/MPO−/− is 0.81 with log-rank (Mantel-Cox) test, p=0. 39, comparing ICT-treated WT and MPO−/− B16F10 tumor-bearing mice. (B) Survival studies of YUMM3.3 tumor-bearing adult WT and MPO−/− animals treated with ICT (n=10 animals WT and MPO−/− animals) or WT animals treated with IgG control (n=3), or untreated WT and MPO−/− animals (n=8 WT animals, n=7 MPO−/− animals); HR ICT WT/MPO−/− is 1.60 with log-rank (Mantel-Cox) test, p=0.51, comparing ICT-treated WT and MPO−/− YUMM3.3 tumor-bearing mice. Fisher exact test applied to differences across all tumor types and treatment groups comparing ICT-treated WT and MPO−/− animals (p=0.063, two-sided Fisher exact test; p=0.045, one-sided Fisher exact test). (C–F) In vivo depletion studies in B16F10 tumor-bearing (C) WT and (D) MPO−/− animals, and in YUMM3.3 tumor-bearing (E) WT and (F) MPO−/− animals treated with ICT (n=5 animals per treatment group; ICT alone groups replotted with animal numbers as indicated above). ICT, immune checkpoint therapy; MPO, myeloperoxidase; WT, wild type.
To identify the essential effector cells associated with ICT treatment responses, we systematically depleted CD8+ T cells, CD4+ T cells, or natural killer (NK) cells in WT and MPO−/− animals bearing B16F10 tumors (figure 2C,D, online supplemental figure S1D,E) or YUMM3.3 tumors (figure 2E,F, online supplemental figure S1F,G). Depletion of CD8+ T cells abolished ICT responses in WT and MPO−/− animals bearing either B16F10 or YUMM3.3 tumors (figure 2C–F, green line). Depletion of CD4+ T cells actually enhanced ICT response in WT animals bearing B16F10 tumors (figure 2C, purple), while ICT efficacy was lost when CD4+ T cells were depleted in MPO−/− animals bearing B16F10 tumors (figure 2D, purple). This suggested that MPO activity impacted the contributions of CD4+ T cells in B16F10 tumors mediating ICT responses, where depletion of CD4+ T cells in WT mice enhanced ICT outcome. However, when MPO was deficient, depletion of CD4+ T cells completely eliminated ICT responses. In YUMM3.3 tumors, CD4+ depletion partially limited ICT response in both WT and MPO−/− animals, suggesting that CD4+ T cells played a role that was contributory but more limited than CD8+ T cells in YUMM3.3 tumors (figure 2E,F, purple). NK cell depletion partially enhanced ICT efficacy in B16F10 tumors (figure 2C,D, light blue) regardless of MPO status. While depletion of NK cells demonstrated minimal effects on ICT efficacy in WT animals bearing YUMM3.3 tumors (figure 2E, blue line), NK cell depletion partially abrogated ICT in MPO−/− mice (figure 2F, blue line). Thus, depletion of NK cells affected survival differently between WT and MPO-null hosts bearing B16F10 and YUMM3.3 tumors, suggesting that NK1.1-expressing cell functions in ICT response were affected by both the melanoma model and MPO status.
Cytokine analysis was performed on plasma samples taken from both B16F10 and YUMM3.3 tumor-bearing ICT-treated animals on day 3 (prior to ICT treatment) and day 16 (1 week post–ICT treatment). On day 3 in B16F10 tumor-bearing animals, significantly decreased levels of CXCL5 were observed in WT ICT responders compared with MPO−/− ICT responders, while CXCL5 was significantly increased in WT ICT non-responders compared with MPO−/− ICT non-responders (online supplemental figure S2A). CXCL5 levels were significantly increased in WT ICT non-responders compared with WT ICT responders, while conversely, CXCL5 levels were significantly decreased in MPO−/− ICT non-responders compared with MPO−/− ICT responders (online supplemental figure S2A). At day 16, B16F10 tumor-bearing animals demonstrated significant increases in CXCL5 in WT ICT non-responders compared with MPO−/− ICT non-responders (online supplemental figure S2B). As should be noted, we previously reported that at day 3 and day 16, WT B16F10 tumor-bearing animals had increased CXCL5 levels compared with MPO−/− B16F10 tumor-bearing animals (online supplemental figure S2A,B).17 In YUMM3.3 tumor-bearing animals, significant increases in CXCL5 levels were observed on day 3 between MPO−/− ICT responders and non-responders, and WT and MPO−/− ICT non-responders (online supplemental figure S2C). In contrast to what was previously reported in B16F10 early progression tumor-bearing animals,17 MPO−/− YUMM3.3 established tumor-bearing animals had significantly increased CXCL5 levels compared with WT YUMM3.3 tumor-bearing animals at day 3 (online supplemental figure S2C). However, similar to ICT-treated B16F10 tumor-bearing animals, a significant decrease in CXCL5 levels was observed in MPO−/− YUMM3.3 tumor-bearing ICT non-responders compared with MPO−/− YUMM3.3 tumor-bearing ICT responders and WT YUMM3.3 tumor-bearing ICT non-responders at day 3 (online supplemental figure S2C). Other cytokine differences in YUMM3.3 tumor-bearing ICT-treated animals were also observed on day 3; CCL11 was significantly increased in WT ICT responders compared with MPO−/− ICT responders while IL-15 was significantly increased in MPO−/− ICT responders compared with WT ICT responders and MPO−/− ICT non-responders (online supplemental figure S2C). No significant differences in cytokine levels were observed in YUMM3.3 tumor-bearing animals at day 16 (online supplemental figure S2D).
MPO activity affects immune composition
To characterize the influence of MPO activity on the immune landscape, we performed time-of-flight mass cytometry (CyTOF) on melanoma tumors, peripheral blood, spleen, and bone marrow contents from WT and MPO−/− animals. Using Phenograph analysis, the tumor-immune composition was evaluated using unsupervised classification and tSNE plots generated to analyze cellular abundance and median marker expression in significantly altered clusters in B16F10 and YUMM3.3 tumor-associated cells from WT and MPO−/− animals (figure 3A–D). Regardless of the melanoma tumor line, the clusters that were significantly reduced in MPO−/− animals expressed surface markers consistent with myeloid cells, including CD11b and CD68 (figure 3E, cluster 9; figure 3F, cluster 7). Interestingly, MPO deficiency resulted in an increase in T cells (figure 3E, clusters 37, 38, and 40, CD3, CD8, and CD4) and B cells (figure 3E, clusters 39 and 48, CD19) in B16F10 tumors. A decrease in dendritic cells (figure 3F, clusters 4 and 5, CD11c) was observed in YUMM3.3 tumors when MPO was deficient. We used Astrolabe as a secondary method to analyze the CyTOF data using a predetermined immune hierarchy (online supplemental figure S5A). Similar to the Phenograph analysis when MPO was deficient, a significant increase in B and T cells was observed in B16F10 tumors (figure 3G) and a significant decrease in dendritic cells was observed in YUMM3.3 tumors (figure 3H). A significant increase in myeloid cells was observed in YUMM3.3 tumor-bearing WT animals compared with MPO−/− animals (figure 3H). Phenograph analysis of the blood, spleen, and bone marrow of both B16F10 and YUMM3.3 tumor-bearing WT and MPO−/− animals demonstrated changes in the systemic immune composition (online supplemental figures S3 and S4). Generally, clusters expressing myeloid cell surface markers (CD11b and CD68) that concurrently expressed markers consistent with neutrophils (Ly6G, Ly6C), polymorphonuclear MDSCs (PMN-MDSCs—Ly6G), and monocytic MDSCs (mMDSCs—Ly6C) were decreased in MPO−/− animals (online supplemental figure S3C, clusters 9, 10, 12, 19, and 21; online supplemental figure S4C, clusters 2, 4, and 14), while clusters expressing markers consistent with B cells (online supplemental figure S3C, clusters 17 and 22; online supplemental figure S4C, clusters 8, 15, 34, and 41) and dendritic cells (online supplemental figure S3C, clusters 1, 2, 6, and 27; online supplemental figure S4C, cluster 22) were increased in MPO−/− animals. Consistent with the Phenograph analysis, Astrolabe analysis demonstrated that myeloid cells as well as neutrophil and PMN-MDSCs were decreased in the blood and spleen of MPO−/− melanoma-bearing animals regardless of the melanoma tumor cell line (online supplemental figures S5B,C and E,F). Interestingly, myeloid cells were increased in the bone marrow of YUMM3.3 tumor-bearing MPO−/− animals (online supplemental figures S4B and S5G).

Tumor-immune composition of melanoma tumors. Representative tSNE plots of CyTOF analysis of (A) B16F10 tumors and (B) YUMM3.3 tumors in WT and MPO−/− animals. Corresponding quantification of CyTOF clusters of (C) B16F10 and (D) YUMM3.3 tumors and marker expression heatmap of significantly increased clusters in (E) B16F10 and (F) YUMM3.3 tumors in WT and MPO−/− animals. Cluster 2 in B16F10 and cluster 29 in YUMM3.3 are not shown as these clusters have no marker expression above median levels. Astrolabe analysis of (G) B16F10 and (H) YUMM3.3 tumor-immune composition (n=3 animals per group). Multiple comparison Student t-test; *p<0.05, **p<0.01, ***p<0.001, ****p<0.0001. MPO, myeloperoxidase; WT, wild type.

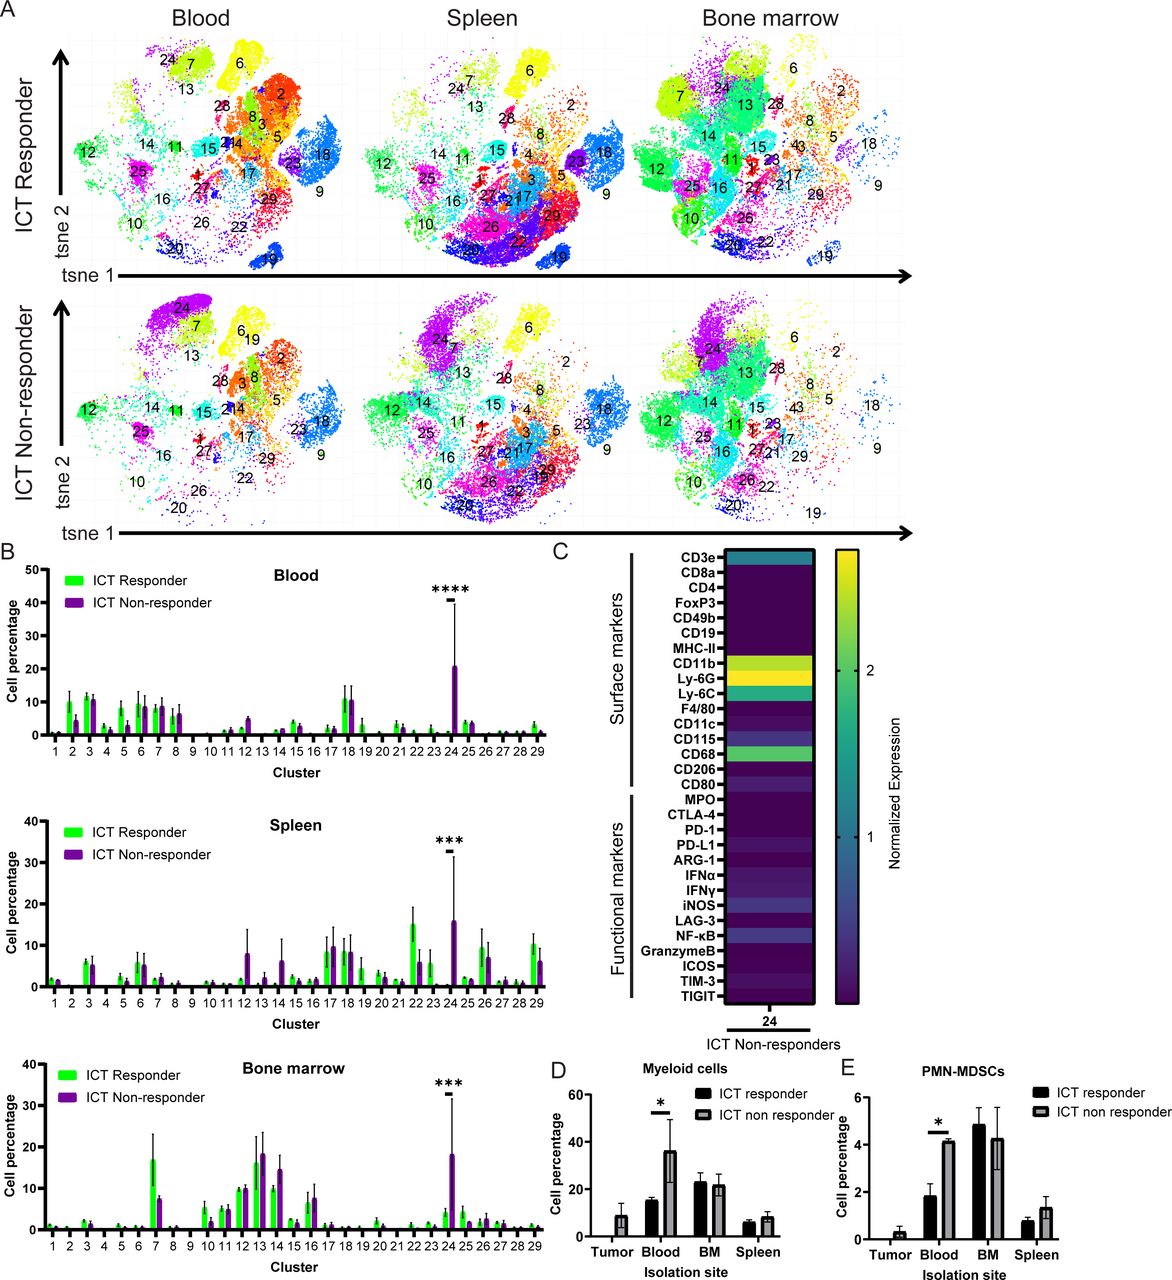
Immune composition of ICT responders and non-responders of YUMM3.3 WT animals. Representative (A) tSNE plot and corresponding (B) quantification of CyTOF clusters and (C) marker expression heatmap of significantly increased clusters composition of peripheral tissues (blood, bone marrow and spleen) comparing YUMM3.3 WT ICT responders and non-responders. Astrolabe analysis demonstrating significant increases in blood (D) myeloid cells and (E) PMN-MDSC in ICT non-responders compared with ICT responders (n=5 ICT responders, n=3 ICT non-responders). Multiple comparison Student t-test; *p<0.05. BM, bone marrow; ICT, immune checkpoint therapy; PMN-MDSC, polymorphonuclear myeloid-derived suppressor cell; WT, wild type.
The immune composition of ICT responders and ICT non-responders using YUMM3.3 tumor-bearing WT animals was evaluated using the peripheral tissues only (since ICT responders have no residual tumor). CyTOF analysis using Phenograph unsupervised clustering identified one cluster with significantly higher abundance in ICT non-responders with median marker expression consistent with myeloid cells, including CD11b, Ly6G, Ly6C, CD68, and CD115 (figure 4A–C). Similarly, CyTOF analysis using Astrolabe also demonstrated significantly higher frequency of myeloid cells (figure 4D), and within the myeloid cell subset, a significant higher abundance of PMN-MDSCs in the blood of ICT non-responders (figure 4E). These data suggested that host MPO activity affected both the immune population within the tumor microenvironment as well as systemically, wherein myeloid cells contributed to ICT resistance in both of these preclinical models of melanoma.
Melanoma tumor burden causes systemic changes to myeloid cells
RNA sequencing (RNASeq) analysis of isolated myeloid cells from the bone marrow and spleen of B16F10 and YUMM3.3 tumor-bearing WT animals compared with age-matched healthy controls demonstrated key differences in gene sets (figure 5, online supplemental figures S6–S12).21 A total of 8391 differentially expressed genes (DEGs) were identified comparing myeloid cells isolated from the bone marrow comparing B16F10 tumor-bearing, YUMM3.3 tumor-bearing, and healthy animals, while only 252 DEGs were identified comparing myeloid cells isolated from the spleen. There were 48 and 53 DEGs identified when comparing myeloid cells isolated from the bone marrow of B16F10 and YUMM3.3 tumor-bearing animals compared with healthy animals, while 4214 DEGs were identified comparing myeloid cells isolated from the bone marrow of B16F10 and YUMM3.3 tumor-bearing animals. Using a gene set enrichment analysis (GSEA), GO mitochondrial protein complex gene set was upregulated in bone marrow–isolated myeloid cells from melanoma-bearing animals compared with healthy animals (figure 5A,B). The GO mitotic nuclear division was upregulated in spleen-isolated myeloid cells from melanoma-bearing animals compared with healthy animals (figure 5C,D). Indeed, differential expression analysis demonstrated significant differences in many upregulated pathways identified in bone marrow–isolated and spleen-isolated myeloid cells comparing melanoma-bearing animals and healthy animals (online supplemental figures S6–S12). In vitro cytokine analysis of cell culture media of bone marrow–isolated myeloid cells from melanoma-bearing animals compared with healthy animals demonstrated an increase in MIP-1γ and MIP-2, and a decrease in CXCL11 and VEGFR1 (online supplemental figure S13). A decrease in VEGFR1 was also observed comparing cytokines in the cell culture media of spleen-isolated myeloid cells from melanoma-bearing animals compared with healthy animals (online supplemental figure S14).
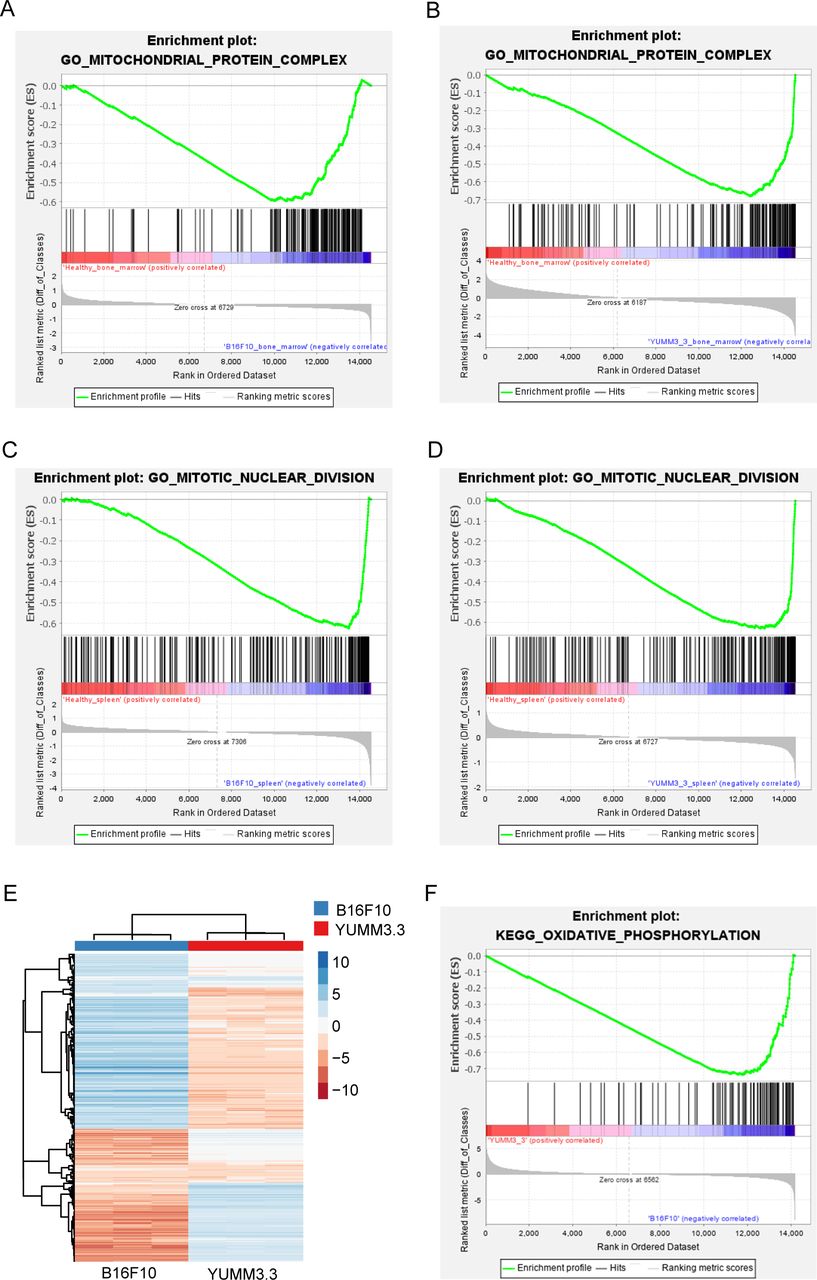
Bioinformatics analysis of isolated myeloid cell and melanoma cell RNASeq data using gene set enrichment analysis (GSEA). Increased mitochondrial protein complex gene set was identified in bone marrow–isolated myeloid cells comparing (A) B16F10 vs healthy, and (B) YUMM3.3 vs healthy while increased mitotic nuclear division gene set was identified in spleen-isolated myeloid cells comparing (C) B16F10 vs healthy and (D) YUMM3.3 vs healthy (n=3 B16F10 bone marrow isolated myeloid cells, healthy bone marrow isolated myeloid cells, n=2 B16F10 spleen isolated myeloid cells, YUMM3.3 bone marrow and spleen isolated myeloid cells, and healthy spleen isolated myeloid cells). (E) RNA-Seq heatmap of B16F10 and YUMM3.3 melanoma cells. (F) GSEA identified increased oxidative phosphorylation gene set in B16F10 melanoma cells compared with YUMM3.3 melanoma cells (n=3 samples per cell line).

MPO activity and expression in isolated CD11b+Ly6G+ myeloid cells. Representative bioluminescent image of (A) luminol and (B) L-012 and corresponding quantification of (C) luminol and (D) L-012 bioluminescence of isolated myeloid cells from the bone marrow, spleen, and peritoneal cavity comparing healthy and B16F10 tumor-bearing animals (n=3 animals per group). Representative bioluminescent image of (E) luminol and (F) L-012 and corresponding quantification of (G) luminol and (H) L-012 bioluminescence of isolated myeloid cells from the bone marrow, spleen, and peritoneal cavity comparing healthy and YUMM3.3 tumor-bearing animals (n=3 animals per group). Quantification of lucigenin bioluminescence in (I) isolated myeloid cells comparing healthy and B16F10 tumor-bearing animals and (J) isolated myeloid cells comparing healthy and YUMM3.3 tumor-bearing animals (n=3 animals per group). Quantification of (K) luminol and (L) L-012 of isolated CD11b+ myeloid cells from the bone marrow, spleen, and peritoneal cavity comparing healthy and B16F10 tumor-bearing adult animals (n=3 animals per group, each experiment performed in triplicate wells). Multiple comparison Student t-test; *p<0.05, **p<0.01, ***p<0.001, ****p<0.0001. (M) Representative Western blot of MPO protein levels and densiometric quantification of MPO protein levels normalized to β-tubulin protein levels from bone marrow–isolated CD11b+Ly6G+ myeloid cells comparing adult healthy to B16F10 tumor-bearing animals, and adult healthy to YUMM3.3 tumor-bearing animals (H, healthy; B, B16F10; Y, YUMM3.3; −, buffer only negative control; +, MPO protein positive control; n=3 blots, Student t-test p>0.05, ns—not significant). MPO, myeloperoxidase.
RNASeq analysis of B16F10 and YUMM3.3 melanoma cells identified differential enriched genes (figure 5E).21 GSEA demonstrated that oxidative phosphorylation was upregulated in B16F10 cells compared with YUMM3.3 cells (figure 5F). Differential expression analysis demonstrated significant differences in upregulated pathways between B16F10 and YUMM3.3 melanoma cells (online supplemental figure S15). The secreted cytokine profile of B16F10 and YUMM3.3 melanoma cells in vitro also demonstrated differences: CCL5 and TNFRI were secreted into the cell culture media at higher levels by B16F10 cells compared with YUMM3.3 cells (online supplemental figure S16). In contrast, CX3CL1, IGFBP-3, IFGBP-5, CXCL5, CCL2, MIP-1γ, CCL1, TIMP-1, TNF RII, TPO, VCAM-1, CXCL11, MMP-3, and osteopontin had increased secreted levels by YUMM3.3 cells compared with B16F10 (online supplemental figure S16).
MPO activity is increased in the presence of melanoma
We isolated CD11b+Ly6G+ myeloid cells (neutrophil-like) from the bone marrow, spleen, and peritoneal cavity of B16F10 and YUMM3.3 tumor-bearing WT animals compared with age-matched healthy WT controls. MPO functional activity was assessed using luminol and L-012 imaging17 22–26 of these isolated CD11b+Ly6G+ myeloid cells (figure 6A–H). Quantification of the bioluminescence demonstrated that isolated peritoneal CD11b+Ly6G+ myeloid cells from B16F10 tumor-bearing WT animals had increased MPO activity compared with matched healthy isolated CD11b+Ly6G+ myeloid cells (figure 6C,D). Isolated spleen and peritoneal CD11b+Ly6G+ myeloid cells from YUMM3.3 tumor-bearing WT animals also had increased MPO activity compared with matched healthy isolated CD11b+Ly6G+ myeloid cells (figure 6G,H). We assessed ROS levels using lucigenin imaging, which demonstrated that ROS levels were increased in the isolated peritoneal and spleen CD11b+Ly6G+ myeloid cells from melanoma-bearing animals compared with healthy isolated CD11b+Ly6G+ myeloid cells (figure 6I,J). We also isolated more broadly CD11b+ myeloid cells from the bone marrow, spleen, and peritoneal cavity of B16F10 and YUMM3.3 tumor-bearing WT animals compared with age-matched healthy WT controls. MPO activity was increased from CD11b+ myeloid cells isolated from B16F10-bearing animals compared with CD11b+ myeloid cells isolated from healthy WT controls (figure 6K,L), while quantification of lucigenin bioluminescence demonstrated no increase in general ROS levels of CD11b+ myeloid cells isolated from B16F10-bearing animals (online supplemental figure S17A). In contrast, MPO activity was decreased in CD11b+ myeloid cells isolated from YUMM3.3-bearing animals compared with CD11b+ myeloid cells isolated from healthy WT controls (online supplemental figure S17B,C). Similarly, a decrease in ROS levels were observed in CD11b+ myeloid cells isolated from YUMM3.3-bearing animals compared with healthy animals using lucigenin (online supplemental figure S17D). As a control, Western blots of cell lysates showed no obvious changes in normalized MPO protein levels in CD11b+Ly6G+ or CD11b+ myeloid cells isolated from various organs of tumor-bearing and age-matched healthy WT animals (figure 6M, online supplemental figure S17E,F). Overall, these data suggested that the MPO enzymatic activity per se, not protein levels, were systemically influenced by the presence of melanoma tumors.
Pharmacological inhibition of MPO enhances ICT response
To simulate clinical application, the efficacy of combination ICT and MPO inhibitors in WT animals bearing B16F10 or YUMM3.3 tumors was evaluated. We used three different MPO inhibitors: verdiperstat, AZD5904, and 4-aminobenzoic hydrazide (4-ABAH) in which treatment began 1 day prior to ICT treatment. In general, combination ICT treatment with MPO inhibition significantly improved long-term survival to levels equivalent or better than host MPO gene deficiency (figure 7 and online supplemental figure S18). Indeed, in B16F10 tumor-bearing animals, MPO inhibition increased ICT response greater than that observed in MPO−/− animals using all three inhibitors (figure 7A–C), wherein ICT combined with verdiperstat or AZD5904 significantly improved survival compared with the MPO inhibitors alone (verdiperstat/verdiperstat+ICT: HR=18.15, p<0.005; AZD5904/AZD5904+ICT: HR=7.93, p<0.05, respectively). In YUMM3.3 tumor-bearing animals, combination verdiperstat or AZD5904 MPO inhibition with ICT also increased ICT response equal to or greater than that observed in MPO-deficient animals (figure 7D,E). Remarkably, ICT in combination with verdiperstat resulted in 100% long-term survivors in YUMM3.3 tumor-bearing animals (figure 7D). ICT combined with verdiperstat demonstrated significantly improved survival compared with verdiperstat or ICT alone (verdiperstat/verdiperstat+ICT: HR=98.33, p<0.0001; verdiperstat+ICT/ICT: HR=0.1, p<0.05, respectively), while ICT combined with AZD5904 demonstrated significantly improved survival over AZD5904 treatment alone (AZD5904/AZD5904+ICT: HR=7.93, p<0.05). ICT combined with 4-ABAH did not demonstrate improvement in long-term survival above ICT alone (figure 7F).

Melanoma-bearing animals treated with combination ICT and MPO inhibitors. Survival curves of B16F10 tumor-bearing WT animals treated with ICT and MPO inhibitors (A) verdiperstat, (B) AZD5904, and (C) 4-ABAH (n=10 animals treated with AZD5904+ICT or verdiperstat+ICT, n=15 animals treated with 4-ABAH+ICT, n=5 animals treated with AZD5904 or verdiperstat alone, n=25 animals treated with 4-ABAH alone). HR of verdiperstat/verdiperstat+ICT is 12.05 with log-rank (Mantel-Cox) test, p=0.0083; HR of verdiperstat/ICT is 18.15 with log-rank (Mantel-Cox) test; p=0.0015; HR of verdiperstat+ICT/ICT is 0.66 with log-rank (Mantel-Cox) test, p>0.05; HR of AZD5904/AZD5904+ICT is 7.93 with log-rank (Mantel-Cox) test, p=0.016; HR of AZD5904/ICT is 3.27 with log-rank (Mantel-Cox) test, p>0.05; HR of AZD5904+ICT/ICT is 0.53 with log-rank (Mantel-Cox) test, p>0.05; HR of 4-ABAH/4-ABAH+ICT is 2.22 with log-rank (Mantel-Cox) test, p>0.05; HR of 4-ABAH/ICT is 1.87 with log-rank (Mantel-Cox) test, p>0.05; HR of 4-ABAH+ICT/ICT is 0.75 with log-rank (Mantel-Cox) test, p>0.05. Survival curves of YUMM3.3 tumor-bearing WT animals treated with ICT and MPO inhibitors (D) verdiperstat, (E) AZD5904, and (F) 4-ABAH (n=10 animals in all MPO inhibitor+ICT groups, n=5 animals in MPO inhibitor alone groups). HR of verdiperstat/verdiperstat+ICT is 98.33 with log-rank (Mantel-Cox) test, p<0.0001; HR of verdiperstat/ICT is 8.33 with log-rank (Mantel-Cox) test, p=0.011; HR of verdiperstat+ICT/ICT is 0.10 with log-rank (Mantel-Cox) test, p=0.012; HR of AZD5904/AZD5904+ICT is 10.60 with log-rank (Mantel-Cox) test, p=0.0069; HR of AZD5904/ICT is 5.71 with log-rank (Mantel-Cox) test, p=0.029; HR of AZD5904+ICT/ICT is 0.57 with log-rank (Mantel-Cox) test, p>0.05; HR of 4-ABAH/4-ABAH+ICT is 3.16 with log-rank (Mantel-Cox) test, p>0.05; HR of 4-ABAH/ICT is 5.64 with log-rank (Mantel-Cox) test, p=0.0084; HR of 4-ABAH+ICT/ICT is 1.17 with log-rank (Mantel-Cox) test, p>0.05. MPO expression in pathological human samples. (G) Representative histology of MPO expression in human melanoma and normal skin samples and (H) corresponding quantification of percent of cells with MPO expression; human tissue microarrays from US Biomax ME242c and T382c, n=22 melanoma, n=14 normal (includes normal, adjacent, or cancer adjacent skin tissues). Scale bar represents 100 µm; unpaired Student t-test, *p<0.05. ICT, immune checkpoint therapy; MPO, myeloperoxidase; WT, wild type.
MPO expression in pathological samples
MPO staining of two human melanoma tissue arrays demonstrated varying levels of MPO protein (figure 7G, online supplemental figure S19). In contrast, normal skin tissue (including adjacent normal skin tissue and cancer adjacent skin tissue) demonstrated minimal MPO staining. MPO expression was significantly increased in melanoma tissues compared with normal samples (figure 7H). These data demonstrated the presence of MPO in clinically relevant human melanoma tissues.
Discussion
In this study, we report that genetic deficiency and pharmacological inhibition of MPO enhanced ICT efficacy in two preclinical primary melanoma models in aged animals. All studies were performed with adult 6-month-old animals using combination anti-CTLA-4 and anti-PD-1 ICT treatment to more accurately recapitulate adult human clinical experience.19 Although beyond the scope of this paper, the effects of aging in ICT response is of interest for further evaluation. While others have evaluated 4-ABAH combined with anti-PD-1 treatment and demonstrated evidence of delayed tumor growth,13 long-term survival data were not shown. Our data now demonstrated long-term survival using combination 4-ABAH and ICT. However, because the clinical use of 4-ABAH is limited, the use of two other clinically relevant MPO-selective inhibitors, verdiperstat and AZD5904, was evaluated to set the stage for facile translation. Our data demonstrated equal or greater enhanced long-term survival using combination verdiperstat or AZD5904 with ICT, and promisingly, verified 100% long-term survivors in YUMM3.3 tumor-bearing adult WT animals using combination verdiperstat with ICT. The clinical use of verdiperstat or AZD5904 is feasible as both are under evaluation in clinical trials for neurodegenerative diseases.27–31 The safety, tolerability, and pharmacokinetics of these MPO inhibitors have been assessed and progression to phase III clinical trials for Parkinson’s disease, multiple system atrophy, and amyotrophic lateral sclerosis is underway.28–30 However, their effects in cancer have not been explored. These data provide a preclinical framework suggesting that MPO-selective inhibitors may have therapeutic repurposing potential in enhancing ICT response for the management of melanoma.
To delineate the possible mechanisms of MPO-mediated ICT enhancement, systemic depletion of known ICT effector cells demonstrated that, as expected, CD8+ T cells were essential to eliciting a durable response regardless of MPO status in both models. Thus, loss of host MPO enhanced the known mechanisms of ICT-induced therapy. While CD8+ T cell depletion was shared by both melanoma cell lines, other effector cells played a model-specific role. For example, depletion of CD4+ T cells differentially impacted ICT response in the melanoma models. Our data suggest a cell line–specific phenotypic switch of CD4+ T cells. In B16F10 tumor-bearing WT animals, CD4+ T cells limited ICT response, but when MPO was deficient, CD4+ T cells partially contributed to ICT efficacy, suggesting that in this model, CD4+ T cell functionality was affected by MPO. However, by contrast, in the YUMM3.3 melanoma model, CD4+ T cell depletion partially limited ICT response in both WT and MPO−/− animals, suggesting that CD4+ T cells appeared to be partial ICT effector cells independent of MPO, but in a more limited role compared with CD8+ T cells. How MPO-active myeloid cells interact with CD4+ T cells in these two models requires additional evaluation. It should be noted that differential responses were also unexpectedly observed with IgG isotype antibody treatment in ICT-treated YUMM3.3 tumor-bearing animals (figure 1B,E). The intent of these isotype-control antibody experiments was to confirm the null hypothesis, but instead, these data suggested that global engagement of Fc receptors by isotype antibodies in the proper context may actually contribute significantly to ICT responses (figure 1B,E); this warrants further study.
Plasma cytokine analysis of ICT-treated WT and MPO−/− animals highlighted the CXC chemokine CXCL5, a neutrophil chemoattractant and ligand for the neutrophil recruitment chemokine receptor CXCR2.32 Differences in IL-15 and CCL11 were observed in the YUMM3.3 melanoma model, suggesting that the recruitment of other immune cells, including NK cells, eosinophils, or basophils,33 34 may be one mechanism by which enhanced ICT response occurs in YUMM3.3 compared with the B16F10 melanoma model. Significant differences were primarily observed on day 3 prior to the start of ICT treatment, but whether CXCL5, IL-15, and CCL11 might serve as predictive markers for ICT response requires further evaluation. Comprehensive analysis of tumor samples and peripheral tissues (blood, spleen, and bone marrow) demonstrated that immune suppressing myeloid cells, such as MDSCs, were increased significantly in WT animals and in ICT non-responders. In line with the depletion studies, when MPO was deficient, increased numbers of CD4+ T cells were observed within B16F10 tumors by CyTOF analysis. Within the tumor microenvironment in WT animals, the YUMM3.3 model had a greater enrichment in dendritic cells (figure 3F, clusters 4 and 5), while the B16F10 model had a greater enrichment of myeloid cells. However, when MPO was deficient, the B16F10 tumor microenvironment was enriched for both T cells and B cells. Interestingly, B cells also were increased in the peripheral tissues of B16F10 and YUMM3.3 tumor-bearing MPO−/− animals. Whether B cells are essential ICT effector cells and how MPO-active immune suppressing myeloid cells interact with B cells requires additional evaluation. Our CyTOF data also demonstrated an inverse relationship in the prevalence of dendritic cells with MPO activity, which further support the observation that immune suppressing myeloid cells affect dendritic cells through MPO.13 Systemically, an interesting observation from the tSNE plots of the CyTOF data was that the immune composition of the blood provided insight into the composition of the spleen (online supplemental figures S3A and S4A).
RNASeq and cytokine profiles identified cell line–specific alterations and cell line–independent changes. Interestingly, over 8000 DEGs were identified in the comparison of bone marrow–isolated myeloid cells from healthy versus melanoma-bearing animals, while only 252 DEGs were identified in spleen-isolated myeloid cells. There was minimal overlap in the altered pathways comparing isolated myeloid cells from B16F10 and YUMM3.3 tumor-bearing animals, suggesting that melanoma tumor type–specific alterations occurred. However, the GO mitochondrial protein complex gene set was increased in bone marrow–isolated myeloid cells from melanoma-bearing animals compared with healthy animals, while the GO mitotic nuclear division gene set was increased in spleen-isolated myeloid cells from melanoma-bearing animals compared with healthy animals. These data suggested that in the presence of melanoma, myeloid cells upregulated mitochondrial protein complex and overall mitochondrial mass, which has been reported to be associated with immune suppression.9 35 The secreted cytokines from these same myeloid cells isolated from the bone marrow and spleen comparing melanoma-bearing animals and healthy animals suggested that in the presence of melanoma, increased secretion of myeloid cell chemoattractants MIP-1γ and MIP-2 occurred; interestingly, MIP-1γ has also been reported as a chemoattractant for dendritic cells.36 Myeloid cells in the presence of melanoma demonstrated a decrease in CXCL11, which has been reported as a chemoattractant for activated T cells.37 RNASeq analysis demonstrated that B16F10 and YUMM3.3 melanoma cells were enriched in completely different gene sets and had different in vitro cytokine expression profiles. The oxidative phosphorylation gene set was upregulated in B16F10 melanoma cells compared with YUMM3.3 cells, which may also partially contribute to the differences observed in ICT response in vivo. These data suggested that immune suppressing myeloid cells may express similar cytokines regardless of the intrinsic differences in the myeloid cells themselves and the melanoma models. Similarly, regardless of the melanoma model, MPO activity and ROS levels were increased in isolated CD11b+Ly6G+ myeloid cells from melanoma-bearing animals compared with healthy animals. Whether this increase in MPO activity resulted in increased immunosuppressive activity of these isolated CD11b+Ly6G+ myeloid cells is currently under evaluation. In the B16F10 model, CD11b+ myeloid cells also demonstrated increased MPO activity and ROS levels, but this was not observed in CD11b+ myeloid cells isolated from YUMM3.3 cells. This decrease in MPO activity in myeloid cells broadly in the YUMM3.3 model may contribute to the increased ICT response observed compared with the B16F10 model.
Overall, our findings support combination MPO inhibition and ICT as a new treatment approach for achieving enhanced durable responses in melanoma. Mechanistically, because MPO is a myeloid-lineage restricted enzyme, targeting MPO has built-in specificity for targeting immune suppressing myeloid cells broadly. The clinical manifestation of human MPO deficiency are usually asymptomatic to mild and generally do not have increased frequencies of infections38 39; thus, the use of MPO inhibitors should exhibit minimal on-target toxicities. We only evaluated a single treatment regimen for combination MPO inhibition with ICT, and future optimization of the dosing regimen of MPO inhibition may further improve combination immunotherapy response. Histological analysis of MPO staining in human tissue arrays demonstrated increased MPO expression in melanoma compared with normal skin tissues demonstrating that it is a clinically relevant target. Lastly, whether combination MPO inhibition with ICT is specific to melanoma or can be translated to other cancer types remains to be evaluated. For example, ICT has generally had little success in treating pancreatic cancers,40 41 which are highly infiltrated with immune suppressing myeloid cells,42 43 wherein MPO inhibition in particular may enhance ICT response. In conclusion, our work in adult mice with genetic knockouts, tool compounds, and two different clinically translatable MPO inhibitors demonstrated that MPO is a promising therapeutic target for enhancing ICT efficacy with potentially minimal side effects.
Materials and methods
Cells
B16F10 melanoma cells were purchased from the MD Anderson Cancer Center Cell core (originally from the American Type Culture Collection (ATCC, VA, USA)). Cells were cultured in DMEM supplemented with 10% heat-inactivated fetal bovine serum (FBS). YUMM3.3 cells were purchased from ATCC. Cells were cultured in DMEM:F12 supplemented with 10% heat-inactivated FBS and 1% NEAA. Cell cultures were grown at 37°C in a humidified 5% CO2 atmosphere. All cell lines tested negative for mycoplasma.
Reagents
Luminol (sodium salt), lucigenin (N,N′-dimethyl-9,9′-biacridinium dinitrate), phobol 12-myristate 13-acetate (PMA), G418, casein (from bovine milk, sodium salt), and 4-aminobenzoic hydrazide (4-ABAH, myeloperoxidase inhibitor-1; Calbiochem, EMD Millipore) were purchased from Sigma-Aldrich (Sigma-Aldrich, MO, USA). L-012 sodium salt was purchased from Wako Chemicals USA (Richmond, VA, USA). Verdiperstat, AZD5904, and hydroxypropyl-β-cyclodextrin (HP-β-CD) were purchased from MedChemExpress (NJ, USA). Anti-CTLA-4 (9D9), αPD-1 (RMP1-14), CD8α (2.43), CD4+ (GK1.5), NK1.1 (PR136), and polyclonal rat IgG control were obtained from Bio X cell (NH, USA). Luminol sodium salt was dissolved in sterile phosphate-buffered saline (PBS) to a final concentration of 50 mg/mL or 100 mg/mL and stored at −20°C. L-012 powder was dissolved in sterile double-distilled water (ddH20) to a final concentration of 20 mM and stored at −20°C. 4-ABAH was dissolved in sterile ddH2O heated to 65°C to a final concentration of 2 mg/mL.44 Verdiperstat and AZD5904 were dissolved in sterile DMSO to a final concentration of 10 mM and stored at −20°C; AZD5904—5% DMSO, 15% HP-β-CD w/v, 200 µL intraperitoneal injection daily. Verdiperstat—4% DMSO,15% HP-β-CD w/v, 300 µL intraperitoneal injection daily. Nine grams of casein was dissolved in 100 mL PBS, pH7.2 containing 0.9 mM CaCl2 and 0.5 mM MgCl2.45
In vivo subcutaneous tumor model
B16F10 cells (1×10⁴) or YUMM3.3 cells (1×10⁵) were injected subcutaneously on the right flank of female 6-month-old C57BL/6 (Taconic Biosciences, NY, USA) or 6-month-old age matched syngeneic C57BL/6 myeloperoxidase-deficient MPO−/− (MPOtm1Lus; The Jackson Laboratory, ME, USA) animals. Prior to tumor cell injection, the fur was removed on the right flank. Tumors were measured by calipers ever 3–4 days once palpable. Following institutional animal guidelines, animals were euthanized once tumors reached 1.5 cm in diameter or were ulcerated greater than 0.5 cm. Animals were treated with ICT (200 µg anti-CTLA-4 and 200 µg αPD-1 on day 3, and 100 µg anti-CTLA-4 and 100 µg αPD-1 on day 6 and day 9)20; rat IgG isotype antibody was used as a control. GVAX was made by irradiating 1×10⁶ gene-modified GVAX B16 cells with 150 Gy and were injected subcutaneously on the contralateral flank on day 3.20 For the immune cell depletion studies, antibodies against CD8+, CD4+, and NK1.1 were injected into animals (250 µg in 100 µL PBS intraperitoneally) twice weekly for 2 weeks beginning on day 2 post–tumor inoculation (1 day before ICT treatment).25 Rat IgG isotype antibody was used as a control. For MPO inhibition studies, animals were injected intraperitoneally with 40 mg/kg 4-ABAH twice daily,44 180 µmol/kg verdiperstat or 180 µmol/kg AZD5904 daily46 for 14 days beginning on day 2 post–tumor inoculation (1 day before ICT treatment). Blood draws from the saphenous vein occurred on day 3 and day 16 post–tumor inoculation. Blood was collected using EDTA-coated microvette tubes (Sarstedt, Nümbrecht, Germany) and centrifuged for 10 min at 1000×g. The plasma was collected for cytokine concentration analysis using a mouse cytokine magnetic bead panel at the Antibody-based Proteomics Core at Baylor College of Medicine (Luminex Technology, Millipore, MA, USA). ICT response was defined as mice with non-palpable tumors at or greater than day 90 post–tumor injection and considered long-term survivors. Survival curve statistical significance calculation was alpha-adjusted for multiple comparisons. Comparison of survival curves used the HR and log-rank (Mantel-Cox) analysis and Fisher exact test where indicated.
Intravital imaging
Skin window-chamber implantation, imaging, and analysis were previously described using 6-month-old female animals.17 23 24 Briefly, following skin window-chamber implantation and B16F10 dendra2 reporter melanoma cell inoculation, macro-imaging occurred prior to ICT treatment at day 2 post–implantation using the IVIS spectrum (Perkin Elmer, Waltham, MA). ICT with GVAX treatment occurred on days 3, 6, and 9 as described previously and macro-imaging occurred during ICT treatment. Post-ICT treatment, macro-imaging occurred between days 10 and 14. Fluorescence imaging of tumors stably expressing dendra2 was performed before L-012 bioluminescence imaging (25 mg/kg of body weight). Colocalization analysis was performed on ImageJ using JACoP47 plugin following reorientation and cropping using our previously described ImageJ macro.23
CyTOF
Table of antibodies used for CyTOF shown in online supplemental table S1. B16F10 and YUMM3.3 tumor-bearing WT and MPO−/− animals were processed for CyTOF at day 30 post–tumor inoculation. CyTOF processing of YUMM3.3 ICT non-responders occurred when tumors of ICT-treated animals reached greater than 1.5 cm. This was at day 30 (n=1) and day 45 (n=2) post–tumor inoculation, respectively. For ICT responders, n=3 ICT responders had no palpable tumors at the endpoint of the latest ICT non-responder at day 45 post–tumor inoculation and n=2 ICT responders with no palpable tumors were analyzed for CyTOF 13 days later at day 58 post–tumor inoculation. Peripheral blood was sampled by cardiocentesis using an intracardiac puncture with a 25G needle under anesthesia. Animals were then euthanized by carbon dioxide asphyxiation. Single-cell suspension of cells were harvested from tumors, spleen, and bone marrow. Samples were processed for CyTOF. CyTOF data were analyzed using Phenograph48 and Astrolabe. For Phenograph analysis, clusters with no marker expression above median were excluded. Myeloid cell populations identified by Phenograph and Astrolabe are consistent with those previously reported.49
Myeloid cell isolation
At 3 weeks post-B16F10 tumor inoculation and 4 weeks post-YUMM3.3 tumor inoculation, healthy age-matched and tumor-bearing animals were injected intraperitoneally with 1 mL casein solution. Approximately 16 hours later, a second 1 mL intraperitoneal injection of casein occurred. Approximately 3 hours after the second casein injection, cardiocentesis occurred using an intracardiac puncture with a 25G needle under anesthesia. Animals were then euthanized by carbon dioxide asphyxiation. Single-cell suspension of cells were harvested from the peritoneal cavity,45 spleen, and bone marrow.17 CD11b+ myeloid cells were isolated using a magnetic rack while CD11b+Ly6G+ were isolated using magnetic columns (Miltenyi Biotec, CA, USA) following labeling with a neutrophil isolation kit (Miltenyi Biotec); these cells were used for the MPO activity and Western blot studies. Myeloid cells were also isolated using a CD3e depletion kit (Miltenyi Biotec) following isolation with magnetic columns; these cells were used for in vitro cytokine array and RNASeq studies. CD11b+ and/ Ly6G+ myeloid cells were quantified by flow cytometry using CD11b-FITC (Miltenyi Biotec) and anti-Ly6G-APC (Miltenyi Biotec).
In vitro cytokine array and RNA sequencing
Cytokine array analysis was evaluated using a mouse cytokine array C1000 (RayBiotech, GA, USA). Cytokine analysis of myeloid cells used 1×10⁶ isolated myeloid cells from healthy animals, B16F10 tumor-bearing and YUMM3.3 tumor-bearing animals that were seeded in a T-75 cm flask in RMPI1640 with 10% FBS incubated at 37°C in a humidified 5% CO2 atmosphere overnight. The media was then collected in a 15 mL Falcon tube and centrifuged at 2000 rpm at 4°C for 10 min. The supernatant was removed and used for the cytokine array studies. Cytokine analysis of melanoma cell lines used 1×10⁶ B16F10 or YUMM3.3 cells that were seeded in a 100 mm cell culture plate. Four days later when cells were approximately 95% confluent, cell culture media was removed and replaced with 5 mL serum-free media and incubated at 37°C in a humidified 5% CO2 atmosphere for 5 hours. The media was collected in a 15 mL Falcon tube and centrifuged at 2000 rpm at 4°C for 10 min. The supernatant was removed and used for the cytokine array studies. RNA was isolated from the isolated myeloid cells, B16F10 and YUMM3.3 melanoma cells using an RNeasy Mini Kit (Qiagen, MD, USA). RNA sequencing and analysis was performed by Admera Health conducted by GenoHub (TX, USA). Differential expression analysis used DE-Seq; significantly differentially expressed genes comparing isolated myeloid cells from healthy and B16F10 tumor-bearing animals or healthy and YUMM3.3 tumor-bearing animals, and B16F10, and YUMM3.3 cells were defined as those with an adjusted p value <0.05. Functional analysis of significantly differentially expressed genes were identified using the Gene Ontology (GO) classification system. Separately, to identify DEGs, a t-test was used to find DEGs for comparisons of two groups and one-way ANOVA was used to find DEGs for comparison of three groups. The resulting p values were used to adjust for multiple hypothesis testing. For two-group comparisons, GSEA (https://www.gsea-msigdb.org/gsea/) was performed in order to identify significant enriched pathways. The gene sets with the highest normalized enrichment score were reported.
Myeloid cell MPO activity
MPO activity was assessed by luminol imaging22 of the isolated CD11b+Ly6G+ and CD11b+ myeloid cells; 1×10⁵ isolated myeloid cells were added to 100 mM luminol, 50 µM L-012, or 100 µM lucigenin in colorless DMEM media in a 96-well black walled plate. Cells were immediately imaged for 120 min using the IVIS 100 bioluminescence imaging system (Perkin Elmer/Caliper Life Sciences, MA, USA) at 37°C under 5% CO2 flow. Typical acquisition parameters were as follows: acquisition time, autoexposure; binning, 8; FOV, 15 cm; f/stop, 1; filter, open; image-image interval, 5 min; total number of acquisitions, 24. Bioluminescence photon flux (photons/s) data were analyzed by ROI measurements with background subtraction in Living Image 4.5 (Perkin Elmer/Caliper Life Sciences); these raw data were imported into Excel (Microsoft, WA, USA), averaged in each individual experiment if done in duplicate or triplicate wells. Total photon flux for each experiment subtracted the total photon flux of reporter alone controls at each time point. For the CD11b+ myeloid cells, the photon flux was normalized to 1000 CD11b+ cells quantified by FACS. For luminol, the area under the curve was calculated from images taken at 5–60 min. For L-012, the area under the curve was calculated from images taken at 5–90 min and lucigenin was quantified using images taken at 5–25 min. The area under the curve for each reporter was taken from n=3 independent isolation experiments.
Western blot
Western blot of MPO protein levels of isolated myeloid cells from healthy animals, B16F10 tumor-bearing animals, and YUMM3.3 tumor-bearing animals was as follows: 30 µg protein lysis was loaded a 4–20% precast gel, transferred to a PVDF membrane, and blocked in 5% non-fat milk at room temperature for 2 hours. Membrane was incubated with 1:3000 dilution of primary MPO antibody (MPO antibody, AF3667; R&D Systems, MN, USA) overnight. The membrane was washed with TBST buffer three times and incubated with 1:5000 diluted secondary anti-goat antibody (Sigma-Aldrich, MO, USA) at room temperature for 1 hour. After three washes, the membrane was incubated with enhanced chemiluminescence substrate (ECL, Bio Rad #1705061; Bio Rad, CA, USA) for 5 min, then imaged using the Azure c600 western blot imaging system (Azure Biosystems, CA, USA). The membrane was stripped and subsequently incubated with β-tubulin or β-actin at a dilution of 1:5000 or 1:100,000 as a loading control.
MPO staining of tissue microarrays
Human melanoma and skin tissue arrays, ME242c and T382c (US Biomax, MD, USA), were stained and quantified for MPO expression by Histowiz (NY, USA). Histowiz used the primary MPO antibody (Abcam 9535) and a 1:100 dilution of red chromagen secondary. MPO positive cell quantification was carried out by a Histowiz staff pathologist.
Statistical analyses
Graphs were made and statistical analyses were performed using GraphPad Prism (GraphPad Software, CA, USA). Data were expressed as mean±SEM. For analysis of three or more groups, analysis of variance (ANOVA) tests were performed with a Tukey’s multiple comparisons test. Standard comparison of survival curves used the HR and log-rank (Mantel-Cox) analysis. For multi-group survival analysis, the Fisher exact test was used. Analysis of differences between two normally distributed paired test groups were performed using a Student’s multiple t-test. P values were considered statistically significant if <0.05 and Benjamini-Hochberg false discovery rate50 less or equal to 0.1.
Data availability statement
Data are available in a public, open access repository. All data relevant to the study are included in the article or uploaded as online supplementary information. All data relevant to the study are included in the article, uploaded as online supplementary information or have been deposited in the public, open access repository NCBI’s Gene Expression Omnibus and are accessible through GEO Series accession number GSE215005 (https://www.ncbi.nlm.nih.gov/geo/query/acc.cgi?acc=GSE215005).
Ethics statements
Patient consent for publication
Ethics approval
The Institutional Animal Care and Use Committee at University of Texas MD Anderson Cancer Center approved all animal protocols (00001024 and 00001179).
Acknowledgments
We would like to thank Mollianne Murray, Department of Cancer Systems Imaging, for her assistance with the myeloid cell isolation studies. The Luminex data were supported by the Antibody-Based Proteomics Core at Baylor College of Medicine supported by a CPRIT Core Facility Award (RP170005) and the Cancer Center Support Grant (P30 CA125123); we would like to thank the core personnel, Shixia Huang, Ph.D., Core Director, Fuli Jia, Danli Wu, and Liping Dong, research staff. This study made use of the South Campus Flow Cytometry & Cell Sorting Core, which is supported by the UT MD Anderson Cancer Center Support Grant (P30 CA016672).
References
Supplementary materials
Supplementary Data
This web only file has been produced by the BMJ Publishing Group from an electronic file supplied by the author(s) and has not been edited for content.
Footnotes
Contributors TWL designed and performed all in vitro and in vivo experiments, quantified and analyzed the data, provided critical intellectual input, and wrote the manuscript. STG assisted with bioluminescence imaging analysis and statistical analysis, provided intellectual input, and edited the manuscript. PY performed the Western blot assays, and assisted with isolation studies and in vivo experiments. WM performed the bioinformatics analysis of the RNASeq data and edited the manuscript. JW performed the bioinformatics analysis of the RNASeq data and edited the manuscript. DP-W is the guarantor, supervised the study, guided the analysis, provided critical intellectual input, and edited the manuscript.
Funding This work was supported in part by a National Cancer Institute Molecular Imaging Center Grant P50 CA94056, a Department of Defense Peer Reviewed Cancer Research Program Career Development Award (W81XWH-10-1-0203) and a NIH/NIGMS CoBRE award (5P20GM121322).
Competing interests None declared.
Provenance and peer review Not commissioned; externally peer reviewed.
Supplemental material This content has been supplied by the author(s). It has not been vetted by BMJ Publishing Group Limited (BMJ) and may not have been peer-reviewed. Any opinions or recommendations discussed are solely those of the author(s) and are not endorsed by BMJ. BMJ disclaims all liability and responsibility arising from any reliance placed on the content. Where the content includes any translated material, BMJ does not warrant the accuracy and reliability of the translations (including but not limited to local regulations, clinical guidelines, terminology, drug names and drug dosages), and is not responsible for any error and/or omissions arising from translation and adaptation or otherwise.