Article Text

Abstract
Background Previous studies found that lung adenocarcinomas (LUAD) with EGFR-positive and ALK-positive were less responsive to immunotherapy, which may be associated with a suppressive tumor immune microenvironment (TIME). Given the discordance in the TIME between primary lung cancer and brain metastasis, it is urgent to explore the TIME in patients with EGFR/ALK-positive LUAD with brain metastases (BMs).
Methods The transcriptome feature of formalin-fixed and paraffin-embedded samples of BMs and paired primary LUAD from 70 patients with LUAD BMs was illustrated by RNA-sequencing. Six of them were available for paired sample analysis. Then, after excluding 3 co-occurring patients, we divided 67 BMs patients into 41 EGFR/ALK-positive and 26 EGFR/ALK-negative patients. The differences in immune profiling between the two groups were analyzed from three dimensions: TIME, T-cell receptor repertoire, and immunohistochemistry. Finally, the survival data of 55 patients were collected.
Results Compared with primary LUAD, BMs present an immunosuppressed TIME, manifested as: inhibition of immune-related pathways; low expression of immune checkpoint; decreased infiltration of CD8+T cells and cytotoxic lymphocyte; increased proportion of suppressive M2 macrophages. In different subgroups based on EGFR/ALK gene variation status, both EGFR-positive and ALK-positive tumors present a relatively immunosuppressive microenvironment, but the heterogeneity of tumor microenvironment may undergo different mechanisms. EGFR-positive BMs showed decreased CD8+T cells and increased regulatory T cells (Treg) cells, while ALK-positive BMs showed decreased CD8+T cells and increased M2 macrophages. Moreover, in the TCGA-LUAD cohort, EGFR-positive tumors showed reduced CD8+T cell infiltrations (p<0.001) and borderline significantly higher Tregs than EGFR/ALK-negative (p=0.072). In parallel, ALK-positive tumors had higher median M2 macrophages infiltrations than EGFR/ALK-negative (p=0.175), although there was no statistical significance. Collectively, there was a similar immunosuppressive milieu between EGFR/ALK-positive primary LUAD and BMs. Moreover, survival analysis uncovered higher CD8A expression, cytotoxic lymphocyte infiltration, and immune scores were significantly associated with better prognosis in both EGFR/ALK-positive and EGFR/ALK-negative groups.
Conclusion This study found that LUAD-derived BMs exhibited an immunosuppressive TIME and revealed that EGFR-positive and ALK-positive BMs exhibited different immunosuppressive characteristics. Meanwhile, EGFR-negative BMs showed a potential benefit to immunotherapy. These findings boost molecular and clinical understanding of LUAD BMs.
- Lung Neoplasms
- Brain Neoplasms
- Tumor Microenvironment
- Immunity, Cellular
Data availability statement
Data are available upon reasonable request. The raw sequence data reported in this paper have been deposited in the Genome Sequence Archive (Genomics, Proteomics & Bioinformatics 2021)62 in National Genomics Data Center (Nucleic Acids Res 2022),63 China National Center for Bioinformation / Beijing Institute of Genomics, Chinese Academy of Sciences (GSA-Human: HRA003286) that are publicly accessible at https://ngdc.cncb.ac.cn/gsa-human.
This is an open access article distributed in accordance with the Creative Commons Attribution Non Commercial (CC BY-NC 4.0) license, which permits others to distribute, remix, adapt, build upon this work non-commercially, and license their derivative works on different terms, provided the original work is properly cited, appropriate credit is given, any changes made indicated, and the use is non-commercial. See http://creativecommons.org/licenses/by-nc/4.0/.
Statistics from Altmetric.com
WHAT IS ALREADY KNOWN ON THIS TOPIC
Previous studies reported that brain metastases present a specific immunosuppressive tumor microenvironment, given the unique location of brain organs. In view of the low accessibility of brain metastases samples, the tumor immune microenvironment of brain metastases with EGFR/ALK-positive has not been explored.
WHAT THIS STUDY ADDS
EGFR/ALK-positive brain metastases showed a poorer CD8+T cell infiltration compared with EGFR/ALK-negative brain metastases. EGFR-positive and ALK-positive brain metastases may exhibit different immunosuppressive microenvironments characterized by high regulatory T cells infiltration and high M2-type macrophages infiltration, respectively.
HOW THIS STUDY MIGHT AFFECT RESEARCH, PRACTICE OR POLICY
These findings boost molecular and clinical understanding of lung adenocarcinoma brain metastases with EGFR/ALK-positive and EGFR/ALK-negative.
Introduction
Brain metastases (BMs) are common in patients with advanced non-small cell lung cancer (NSCLC), particularly patients with lung adenocarcinomas (LUAD),1 and are associated with significant mortality.2 Of note, patients with advanced EGFR-mutated or ALK-rearranged NSCLCs treated with tyrosine kinase inhibitors (TKIs) had a high initial and subsequent incidence, approximately 25%, of BM.3 The prognosis of untreated BMs patients is poor, with a median overall survival (OS) of 1–2 months.4
The traditional treatment approach for BMs includes neurosurgical resection, whole-brain radiation therapy, stereotactic radiosurgery/radiotherapy and systemic chemotherapy with a limited survival benefit.5 TKIs are used in patients with targetable oncogenic mutations and are of limited efficacy against BMs.6–8 Meanwhile, the tumor relapse and acquired resistance arose in almost all patients treated with TKIs eventually.9 Currently, immunotherapy with programmed death ligand-1 (PD-L1) inhibitor showed clinical efficacy and acceptable safety in advanced NSCLC (including BMs) and were novel treatment options,10–12 but EGFR/ALK-positive tumors show limited response to immune checkpoint inhibitors (ICIs) in patients with primary LUAD.13–18 This may be attributed to the heterogeneity of tumor immune microenvironment (TIME) among different driver gene states. Understanding the characterization of the TIME is the basis for the individualized immunotherapy of BMs. Previous studies suggested that the TIME of BMs was more immunosuppressed compared with primary lung tumor.8 19 More potential causes of ICIs primary resistance in patients with EGFR/ALK-positive NSCLC were as follow: low tumor mutational burden (TMB),20 low T-cell clonality,21 low PD-L1 expression,22 PD-L1 expression induced by intrinsic oncogenic signaling,18 high frequency of bystander CD39–CD8+tumor infiltrating lymphocytes (TILs),23 lack of CD8+TILs, inactivated TILs,24 and exosome of promoting CD8+T cell apoptosis.25 Patients with EGFR-positive and ALK-positive LUAD are often more prone to BMs.3 26 There was discordance in the response to ICIs between primary NSCLC and BMs,11 which may be attributed to the differences in the TIME. Therefore, the heterogeneity of TIME in BMs may also affect the response of ICIs. It is necessary to explore the heterogeneity of TIME of EGFR/ALK-positive and EGFR/ALK-negative LUAD BMs.
Herein, we evaluated the TIME in BMs and primary LUAD by applying RNA sequencing (RNA-seq) for 76 formalin-fixed and paraffin-embedded (FFPE) resectable tumors from EGFR-positive, ALK-positive and EGFR/ALK-negative advanced LUAD. We compared the TIME of BMs with paired primary lung tumors and then focus on the TIME between different oncogenic alteration status (EGFR-positive, ALK-positive, and EGFR/ALK-negative), which will help to clarify the impact of EGFR/ALK gene variants on the immune microenvironment of BMs and to lay a theoretical foundation for clinical translation and drug regimen evaluation.
Methods
Study cohort
Seventy patients with advanced LUAD with BMs were diagnosed and enrolled at the Xiangya Hospital Central South University between 2017 and 2021. Clinical characteristics were summarized in online supplemental tables S1-S3. In total, we included 6 primary LUAD and 70 BMs samples from 70 patients, including 12 paired primary LUAD and BMs samples from 6 patients at the Xiangya hospital. Primary LUAD and BMs were collected. Both our BMs and primary lung tumor samples were obtained from surgical resection. Moreover, previous studies observed that, in primary NSCLC, EGFR/ALK-positive patients had low response rates to ICIs compared with EGFR/ALK-negative patients17 . In the study about BMs, we classified the tumors harboring activating EGFR mutations as EGFR-positive, tumors harboring oncogenic ALK fusions as the ALK-positive, and categorized neither EGFR mutations or ALK fusions as EGFR/ALK-negative. Then, the variant status of EGFR and ALK was uesd as the grouping basis for this study, enrolling 41 EGFR/ALK-positive (32 EGFR-positive and 9 ALK-positive) and 26 EGFR/ALK-negative (table 1).
Supplemental material
Supplemental material
Supplemental material
Patient’s characteristics in EGFR/ALK-negative (n=26) and EGFR/ALK-positive (n=41)
Publicly available cohort data sets
The Cancer Genome Atlas (TCGA) data of the LUAD cohort: the RNA-seq data (COUNT) and clinical data (https://portal.gdc.cancer.gov/) were downloaded by using the TCGAbiolinks R package.27 Then, the COUNT values were transformed into transcripts per kilobase million values. Information on EGFR mutation and ALK fusion in the TCGA LUAD cohort was downloaded from the cBioPortal for Cancer Genomics (https://www.cbioportal.org). The TCGA LUAD cohort included 63 EGFR-positive, 5 ALK-positive and 446 EGFR/ALK-negative LUAD samples.
Gene mutation detection
Gene mutation status was determined by using next-generation sequencing (NGS) and quantitative PCR (qPCR) method. Forty-one samples were detected by using the NGS method. Germline genomic DNA was isolated from peripheral blood lymphocytes by operating the QIAamp DNA Blood Mini Kit (Qiagen). Matched tumor DNA was extracted from FFPE tumor tissue specimens by using the ReliaPrep FFPE gDNA Miniprep System (Promega). Tumor genomic and matched germline DNA libraries were built. The indexed libraries were sequenced using a 100 bp paired-end configuration on the Gene+Seq-2000 sequencing system (GenePlus-Beijing). Moreover, 29 samples without data of DNA targeted sequencing were detected by applying qPCR. DNA was extracted from corresponding cell pellets with tissue DNA kits (AmoyDx), and the EGFR, ALK and KRAS status was assessed with ADx-ARMS detection kits (AmoyDx).
RNA next generation sequencing (RNA-seq)
RNA extraction from FFPE tissue, constructing sequencing library, sequencing, and quality control for FASTQ data were performed following the protocol by Owens et al,28 then clean data were matched to the human genome (GRCh37) by operating STAR alignment tool (V.2.7.6a).29
T-cell receptor sequences assembled from the bulk RNA-seq data
T-cell receptor (TCR) repertoire tool (MiXCR) was applied to identify TCR CDR3 sequences in our RNA-seq data of LUAD BMs samples, applying it in single end mode to reads aligned to the human genome (GRCh37) via STAR19 (V.3.0.0). TCR sequences with less than six amino acids were excluded from the analysis.
In the study, CDR3 of the TCR β chain was recovered from the bulk RNA-seq. The CDR3 sequence was defined as the amino acids between the second cysteine of the V region and the conserved phenylalanine of the J region, according to the ImMunoGeneTics (IMGT) V, D, and J gene references.30 The CDR3 sequences were identified and assigned using the MiXCR software package with default parameters from FASTQ files31 and thereby analyze clonality metrics. Richness was calculated as the number of unique sequences in a repertoire.32
Shannon’s entropy (diversity) was calculated on the clonal abundance of all productive TCR sequences, scaled from 0 to 1, representing minimally diverse to maximally diverse, respectively.

where  is the frequency of clonotype i for the sample with n unique clonotypes. To determine the clonal characteristics of the TCR repertoire for each sample, clonality was calculated as the normalized Shannon’s entropy, which was determined by dividing Shannon’s entropy by the natural logarithm of the number of unique productive TCR sequences33:

The detailed results were included in the online supplemental table S4.
Supplemental material
Differentially expressed analysis and functional pathways analysis
Differential expressed genes (DEGs) were identified by using the DESeq2 R package. DEGs were screened by using a log2 fold change=1 and adjusted p<0.05 as the cut-off. Gene Ontology, Kyoto Encyclopedia of Genes and Genomesand Hallmark enrichment analysis based on gene set enrichment analysis (GSEA) by applying the cluster Profiler R package was used to explore biological processes and signaling pathways. The c5.bp.v7.4.symbols.gm, c2.cp.kegg.v7.4.symbols.gmt, and h.all.v7.4.symbols.gmt files were determined as the reference files.
RNA-seq data analysis according to TIME in LUAD BMs
The ESTIMATE R package was used to evaluate the general immune infiltration in BMs samples, which is a tool that can predict tumor purity by using gene signatures.34 Then, to estimate more detailed immune cell infiltrations, we used three independent algorithms, including CIBERSORT, MCP-COUNTER, and QUANTISEQ R packages. CIBERSORT can evaluate the proportions of 22 immune cells based on RNA-seq data by applying a deconvolution algorithm.35 MCP-COUNTER is able to calculate 8 immune-cell lineage scores.36 Moreover, the single sample gene set enrichment analysis (ssGSEA) algorithm was used to estimate the infiltration of 28 immune cells based on previously published gene sets from Charoentong et al study.37 The R package of ImmuCellAI was applied to estimate the infiltrations of induced regulatory T cells (iTregs) and natural Tregs (nTregs).38 In addition, a pan-cancer T cell-inflamed score was developed by Ayers et al, including 18 inflammatory genes, which could be an inflammatory biomarker and predict the clinical response of ICIs.39 Here, we calculated the T cell-inflamed score as described previously.40
Immunohistochemistry
All tumor slides were stained with antibodies against CD8 (Cat. ab209775, 1:2000, Abcam), Foxp3 (Cat. ab215206, 1:500, Abcam), and CD163 (ZA-0428 Ready-to-Use, ZSGB-BIO). The average from five independent areas containing the greatest abundance of CD8+ cells was calculated as the density of CD8+T cells under 200× magnification. To evaluate PD-L1 tumor proportion score (TPS), the PD-L1 immunohistochemistry (IHC) 22C3 pharmDx kit (Dako) was used.
Statistical analysis
Non-parametric paired Mann-Whitney U test was used to compare gene expression level or immune cells abundance among primary LUAD and paired BMs. Mann-Whitney test was used between EGFR/ALK-positive and EGFR/ALK-negative holding unpaired data. The multiple hypothesis correction was conducted when comparing multiple groups. The false discovery rate method was used to adjust the p value for multiple comparisons. Comparing the proportion of each TMIT (tumor microenvironment immune types) type based on categorical variables was analyzed by Fisher’s exact test. The correlation was analyzed by using the Spearman correlation test. The prognostic significance of the clinical and molecular factors was evaluated by using Kaplan-Meier plots (log-rank test). For numerical variables, the maximally selected rank statistics of the survminer R package was used to identify the optimal cut-offs.
Results
Tissue characteristics of patients
In total, we enrolled 70 BMs patients in our study from the Xiangya hospital, with a median age of 58 years old (range 31–76) and with more men (64.3%) than women (35.7%). Demographic and clinical characteristics of all BMs patients (n=70) were summarized in online supplemental tables S1-S3. The study included three patients with co-occurring LUAD BMs excluded from the molecular subgroup analysis (online supplemental figure S1). We identified 41 EGFR/ALK-positive BMs patients with 32 EGFR-positive and 9 ALK-positive (table 1). Meanwhile, we identified 26 EGFR/ALK-negative BMs patients as a comparator population, all of which were EGFR-negative and ALK-negative. The most common molecular alterations identified in this comparator cohort were KRAS mutations, found in 10 (38.5%) BMs patients.
Supplemental material

Brain metastases show an immunosuppressive tumor microenvironment. (A) Differentially expressed genes (n=417) are depicted in the heat map. Rows denote genes, and columns define samples (upregulated: red; downregulated: blue). Tissue types are shown in the accompanying legend (brain metastases: BM; primary tumor, PT). (B) GSEA analysis was carried out based on Gene Ontology gene list (BM vs PT); (C) GSEA analysis was carried out based on KEGG gene list (BM vs PT); (D) Immune cells are depicted in the heat map. Rows denote immune cells, and columns define samples (upregulated: red; downregulated: blue). Tissue types and EGFR mutation status are shown in the accompanying legend. (E) Comparison of immune cell infiltrations between PT and paired BM; (F) Comparison of PD-L1 mRNA expression between PT and paired BM. (G) The correlation between PT and BM in the mRNA expression of PD-L1; (H) Contingency table for PD-L1 expression of tumor cells by using immunohistochemical analysis. GSEA, gene set enrichment analysis; KEGG, Kyoto Encyclopedia of Genes and Genomes; mRNA, messenger RNA; PD-L1, programmed death ligand-1.
Suppressive TIME in LUAD BMs
We conducted paired differential expression analysis in the 12 paired sample to explore transcriptomic difference between the primary LUAD and the BMs. A total of 417 DEGs (online supplemental table S5), including 115 upregulated genes and 302 downregulated genes, can differentiate BMs from primary LUAD completely by conducting clustering analysis (figure 1A). GSEA analysis revealed that various immune-related biological process and pathways were enriched in primary LUAD compared with the BMs, such as T-cell activation, antigen processing and presentation, cytokine–cytokine receptor interaction, natural killer (NK) cell mediated cytotoxicity and TCR signaling pathway, interferon-γ (IFN-γ) response, inflammatory response (normalized enrichment score (NES) <−1, adjust p<0.05), while tumor metabolic pathways (glycolysis, oxidative phosphorylation, purine metabolism, pyrimidine metabolism) and tumor proliferation pathways (cell cycle, E2F targets, G2M checkpoint, MYC targets V1, MYC targets V2) were enriched in BMs (NES >1, adjust p<0.05) (figure 1B,C; online supplemental figure S2A,B). Then, we explored the expression of immune markers in BMs and paired primary tumor (PT). We found that markers of T cells (CD3E), CD8+T cells (CD8A), and CD4+T cells (CD4) were downregulated in BMs (online supplemental figure S3A). Meanwhile, we evaluated the infiltration abundance of immune cells between BMs and matched PT based on three independent algorithms. BMs showed a lower infiltration score of activated CD8+T cell (p=0.063), effector memory CD8+T cell (p=0.031), activated B cell (p=0.031), immature B cell (p=0.031), and T helper cells (Th)1 cell (p=0.031) than PT based on ssGSEA (figure 1D,E). The CD8+T cells and plasma cells were significantly lower in BMs than paired LUAD according to CIBERSORT (online supplemental figure S4B). The cytotoxic lymphocyte (CTL) (p=0.031), monocyte (p=0.031), T cells (p=0.063) and B cells (p=0.063) also were lower in BMs than paired LUAD applying MCP-COUNTER (online supplemental figure S4A). Furthermore, in all primary lung tumor (n=6) and BMs samples (n=70), various immune cells, including activated B cell, activated CD8+T cell, CD8+effector memory T Cell (Tem), immature B cell, mast cell and Th1 cell, were higher in primary LUAD than BMs based on ssGSEA method (p<0.05), while a significantly increased levels of immunosuppressive M2-macrophages was shown in BMs (p<0.05, online supplemental figure S5). In general, our findings revealed that BMs have the inhibition of immune-activated pathways, reduced activated immune cell infiltration (CD8+T cells, CTL and B cells), and increased proportions of immunosuppressive M2-polarized macrophages, suggesting the BMs may show a more immunosuppressed status than the primary LUAD.
Supplemental material
Supplemental material
Supplemental material
Supplemental material
Supplemental material

Differences of tumor immune microenvironment between EGFR/ALK-positive and EGFR/ALK-negative in Xiangya cohort. (A) Immune cells are depicted in the heat map. Rows denote immune cells, and columns define samples (high infiltration: red; low infiltration: blue). Molecular alterations group, EGFR mutation site, age, and smoking history are shown in the accompanying legend; (B) Comparison of the infiltration levels of four immune cells (CD8+T cell, T follicular helper cell, and NK cell) between EGFR/ALK-positive and EGFR/ALK-negative tumors; (C,D) Comparison of the messenger RNA expression of CD8A, CD8B and PD-L1 between EGFR/ALK-positive and EGFR/ALK-negative; (E) The proportion of TMIT between EGFR/ALK-positive and EGFR/ALK-negative is compared. NK, natural killer; ns, no significant;/, not applicable; PD-L1, programmed death ligand-1; TMIT, tumor microenvironment immune types; TPM, transcripts per kilobase million; *p<0.05, **p<0.01, ***p<0.001, ****p<0.0001.

Differences of tumor immune microenvironment between EGFR-positive, ALK-positive and EGFR/ALK-negative in Xiangya cohort. Comparison of the CD8+T cell, M2 Macrophages, and Treg cell between EGFR-positive, ALK-positive and EGFR/ALK-negative by applying the MCP-COUNTER (A) CIBERSORT (B) and QUANTISEQ (C); (D) Comparison of the infiltration levels of immune cells between KRAS-mutation and the remaining groups. ns, no significant. The p values were corrected by the false discovery rate method. Tfh, follicular helper T cell; CTL, cytotoxic lymphocyte; Treg, regulatory T cells; *p<0.05, **p<0.01, ***p<0.001, ****p<0.0001.
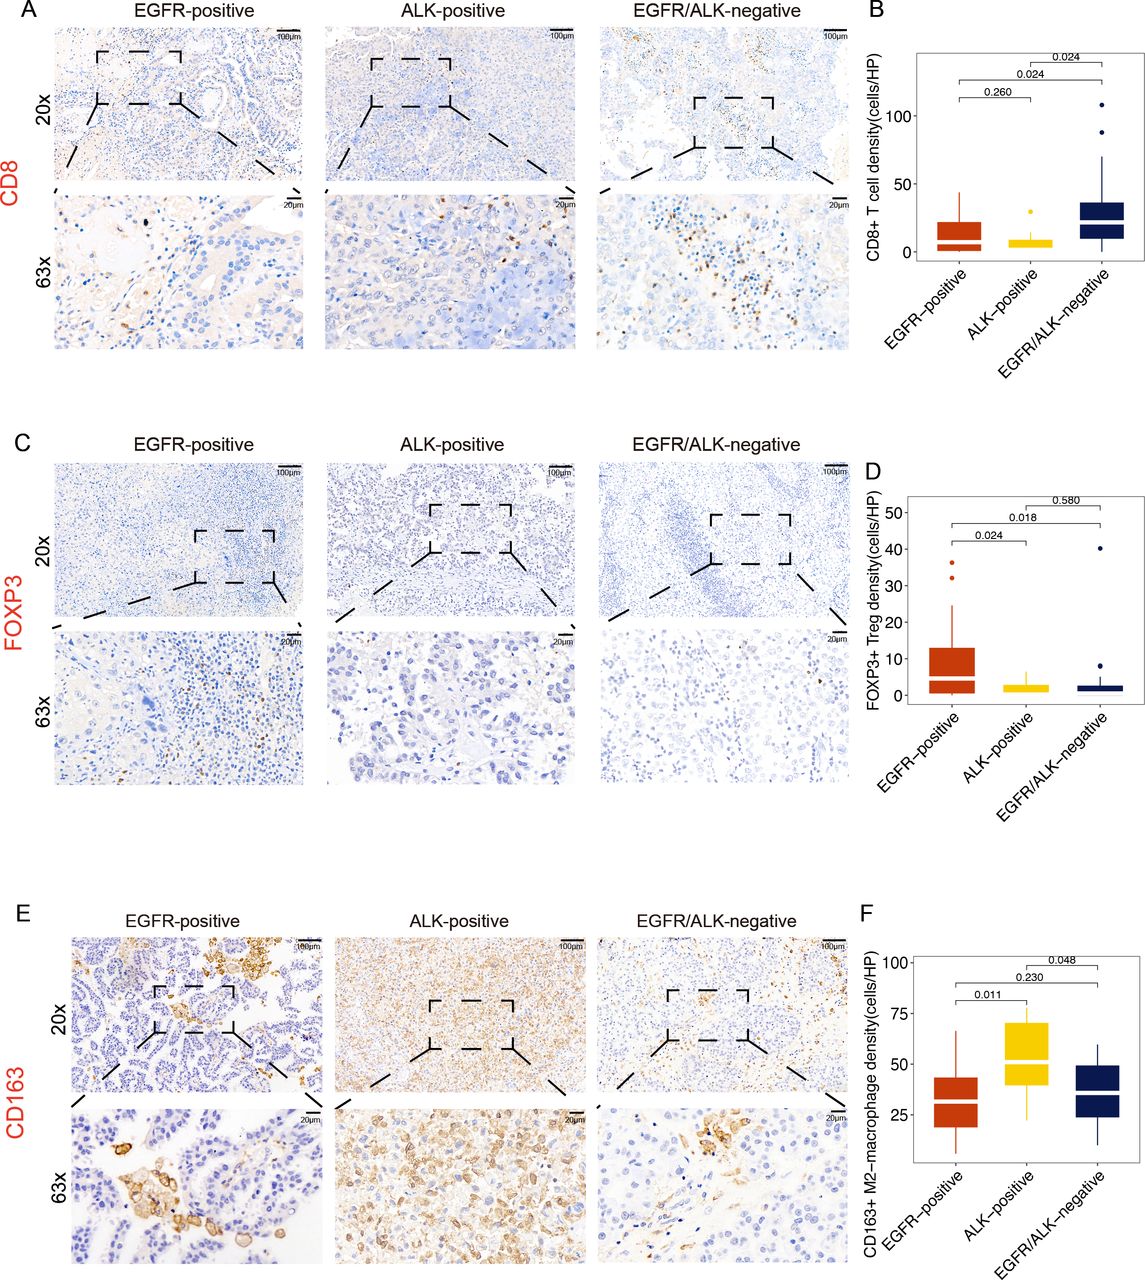
Immunohistochemistry method evaluates the infiltration level of CD8+T cells (A, B) Foxp3+Treg cells (C, D) and CD163+M2-macrophage (E, F) under 200× magnification. HP, high power. The p values were corrected by the false discovery rate method. Treg, regulatory T cells.
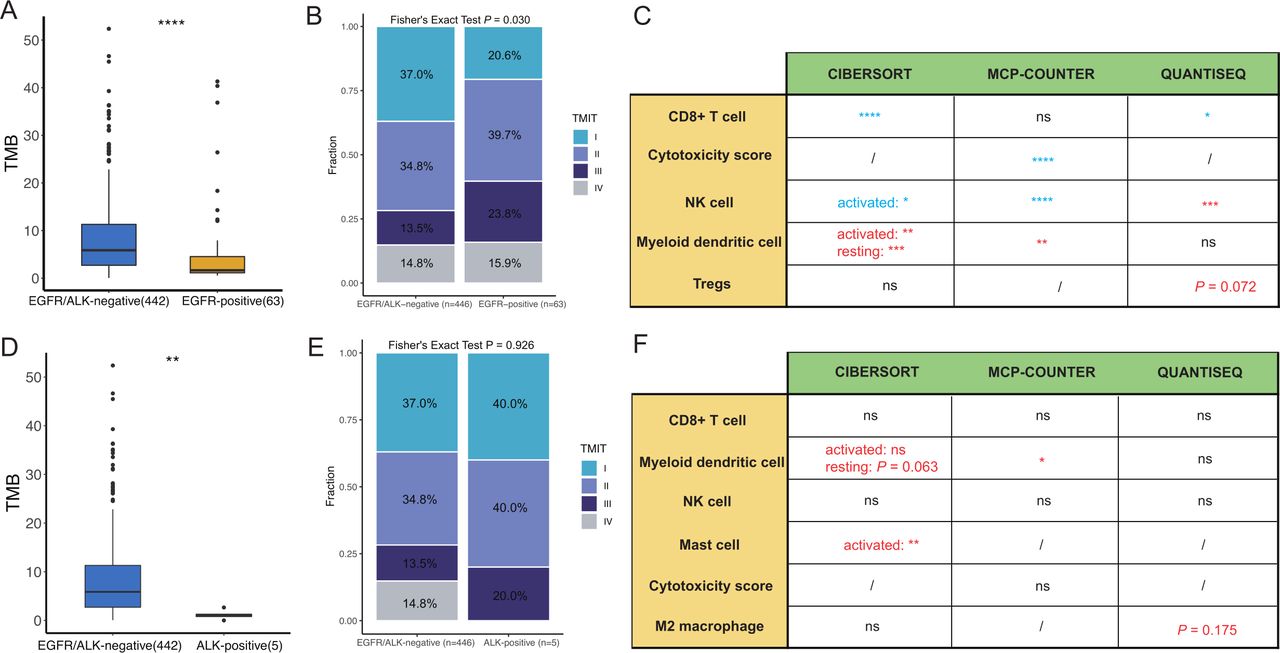
The immune landscape in the The Cancer Genome Atlas lung adenocarcinomas cohort between EGFR/ALK-positive and EGFR/ALK-negative tumors was compared. (A) Comparison of the TMB between EGFR/ALK-negative and EGFR-positive; (B) Comparison of the infiltration levels of five immune cells (CD8+T cell, myeloid DC, NK cell, mast cell and CTL) between EGFR-positive and EGFR/ALK-negative tumors. (EGFR-positive > -negative: red; EGFR-positive < -negative: blue); (C) The proportion of TMIT between EGFR-positive and EGFR/ALK-negative is compared. (D) Comparison of the TMB between EGFR/ALK-negative and ALK-positive; (E) Comparison of the infiltration levels of five immune cells (CD8+T cell, myeloid DC, NK cell, mast cell and CTL) between ALK-positive and EGFR/ALK-negative tumors. (ALK-positive > -negative: red; ALK-positive < -negative: blue); (F) The proportion of TMIT between ALK-positive and EGFR/ALK-negative is compared. CTL, cytotoxic lymphocyte; DC, dendritic cell; NK, natural killer; ns, no significance;/, not applicable; TMB, tumor mutational burden; TMIT, tumor microenvironment immune types; *p<0.05, **p<0.01, ***p<0.001, ****p<0.0001.
Moreover, the immune checkpoint molecules, including programmed cell death protein-1 (PD-1), cytotoxic T-lymphocytes-associated protein 4 (CTLA-4), and T cell immunoreceptor with Ig and ITIM domains (TIGIT), were lower expression in BMs than in matched PT (p<0.05, online supplemental figure S3B). However, there was an equivalent level in messenger RNA (mRNA) expression of PD-L1 between BM and paired PT (Wilcoxon paired test, p=1.000, figure 1F). Besides, the consistency of PD-L1 expression in tumor cells between primary LUAD and paired BMs was high (4/5) using IHC, and most of the patients were negative PD-L1 expression (figure 1H). The correlation in PD-L1 mRNA expression between PT and BM was 0.6 (p=0.24, figure 1G). Meanwhile, we also explored the correlation between immune markers and PD-L1 expression. In PT, CD4 expression (r=1, p=0.0028) and CD8A expression (r=0.43, p=0.42) were positively correlated with PD-L1 mRNA expression (online supplemental figure S3C). However, we did not follow these correlations in BMs lesions (online supplemental figure S3D). BMs also showed a lower IFN-γ signature score than PT (online supplemental figure S3E). Therefore, the PD-L1 expression of BMs may derive less from the secretion of IFN-γ induced by TILs.
Differences of TIME between EGFR-positive, ALK-positive and EGFR/ALK-negative
Previous study reported that patients with EGFR/ALK-positive indicated low infiltration of CD8+T cell, low PD-L1 expression and unfavorable response to anti-PD-L1 therapy in primary NSCLC. However, it is not known whether the concordant results occur in the context of BMs. Thus, we compared the TIME of LUAD BMs in the EGFR/ALK-positive tumors with that in the EGFR/ALK-negative tumors. The immune infiltration profiling of 70 BMs was shown in figure 2A. Intriguingly, the EGFR/ALK-positive group had lower CD8+T cells than the EGFR/ALK-negative group based on three immune evaluation algorithms (figure 2B). As expected, the lower mRNA expression of CD8A and CD8B also was found in the EGFR/ALK-positive (figure 2C), but there was no significant difference in PD-L1 expression between the two groups (figure 2D). As previous studies reported,41 42 we categorized the TIME of LUAD BMs into four TMIT based on the median expression value of CD8A and PD-L1. Type I tumors (CD8A-high/PD-L1-high) may benefit from anti-PD-L1/PD-1 therapies, while Type II tumors (CD8A-low/PD-L1-low) rarely benefit from anti-PD-L1/PD-1 therapies. We found that EGFR/ALK-positive tumors had lower proportion of TMIT I and higher proportion of TMIT II than EGFR/ALK-negative (p<0.05, figure 2E). In total, the above results meant that EGFR/ALK-positive tumors display TIME of poorer CD8+T cell infiltration compared with EGFR/ALK-negative tumors.
Then, we divided EGFR/ALK-positive tumors into the EGFR-positive subgroup and ALK-positive subgroup to further reveal the specific TIME of the two subgroups. There was no significant difference in the immune score and the proportion of CD45+leukocyte cells calculated by the study of Newman et al43 between EGFR-positive, ALK-positive, and EGFR/ALK-negative group (online supplemental figure S5), however, the EGFR-positive tumors had higher Tregs, including iTregs and nTregs, infiltration than ALK-positive and EGFR/ALK-negative by using QUANTISEQ and immuCellAI methods (figure 3A–C; online supplemental figure S7). Meanwhile, the highest infiltration of M2-macrophage was found in the ALK-positive group by applying CIBERSORT and QUANTISEQ algorithm, compared with EGFR-positive and EGFR/ALK-negative (figure 3A–C). Therefore, the overall immune background was not responsible for the difference in CD8+T cell, Treg cell, and M2 macrophage infiltrations among the three groups.
Supplemental material
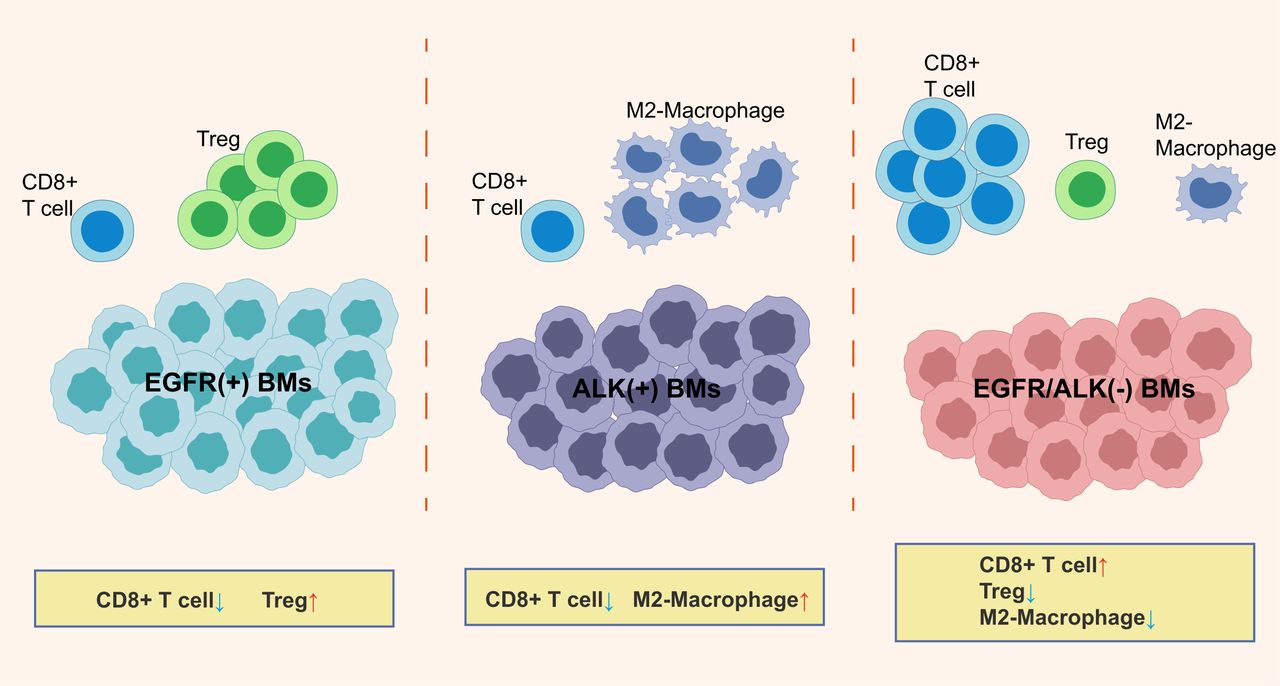
A schematic outlining the major findings of the study. BMs, brain metastases; Treg, regulatory T cells.
In the comparator population (EGFR/ALK-negative), we identified 10 (38.5%) KRAS mutant BMs patients. A previous study reported that KRAS mutant tumors had an immune-activated phenotype in primary NSCLC. Therefore, we hypothesized that the activated immunophenotype of KRAS mutant BMs led to a high proportion of immune-activating cells in the comparator population. Then, we split the comparator population into KRAS-positive tumors (n=10) and EGFR/ALK/KRAS-negative tumors (n=16) to explore the immune features of KRAS-positive tumors. We found that KRAS-positive patients had the highest infiltrations of activated immune cell, including CD8+T cells, follicular helper T cell (Tfh) and CTLs, and the lowest infiltration of immunosuppressed M2 macrophage compared with EGFR-positive, ALK-positive and EGFR/ALK/KRAS-negative (figure 3D; online supplemental figure S8). Therefore, these results validated our speculation.
Supplemental material
Next, the infiltration density of CD8+TILs, Foxp3+Tregs, and CD163+M2 macrophages in different subgroups was analyzed using IHC (online supplemental table S6). Meanwhile, we divided BMs samples into three immune phenotypes (‘infiltrated’, ‘excluded’, and ‘desert’), based on the spatial localization of the CD8+T cells in tumors (online supplemental figure S9A). These included the ‘Infiltrated’: CD8+T cells located in the tumor nests; the ‘Excluded’: CD8+T cells located in the stroma surrounding the tumor but not in tumor nests; and the ‘Desert’: the absence of CD8+T cells in both tumor nests and stroma. Consistent with the RNA-seq results, both the EGFR-positive and ALK-positive had lower CD8+TILs, lower proportion of ‘infiltrated phenotype, and higher proportion of ‘desert’ phenotype than the EGFR/ALK-negative (p<0.05, figure 4A,B; online supplemental figure S9B). Meanwhile, the EGFR-positive BMs had higher density of Foxp3+Tregs than other groups (p<0.05, figure 4C and D), and the ALK-positive BMs had a higher density of CD163+M2 macrophages than other groups (p<0.05, figure 4E,F). Moreover, the KRAS-positive tumors hold the highest infiltration level of CD8+TILs (online supplemental figure S10A).
Supplemental material
Supplemental material
Supplemental material
Furthermore, to explore the consistency of the TIME of EGFR/ALK-positive tumors between primary LUAD and BMs, we also analyzed the TIME in EGFR-positive, ALK-positive, and EGFR/ALK-negative in the TCGA-LUAD cohort. The TMB was lower in the EGFR-positive and ALK-positive groups than in the EGFR/ALK-negative group, respectively, (p<0.01, figure 5A,D). For immune cell infiltrations, the EGFR-positive tumors had lower infiltrating levels of activated immune cells, including CD8+T cells, NK cells, and cytotoxic score, and higher suppressive myeloid dendritic cells than EGFR/ALK-negative group with identical results in the CIBERSORT and MCP-COUNTER R algorithm (figure 5C). Moreover, we found a borderline significant higher infiltration of Tregs in EGFR-positive tumors (p=0.072). Inconsistent with the results of BMs, a significantly lower CD8+T cells in the ALK-positive group was not observed in the TCGA LUAD cohort. Still, the result was heavily underpowered with only five ALK-positive patients available (figure 5F). The abundance of activated mast cell and myeloid dendritic cells were higher in the ALK-positive group, compared with the EGFR/ALK-negative group (p<0.05; figure 5F). Meanwhile, the ALK-positive group had higher median infiltrations of M2 macrophages than the EGFR/ALK-negative group (p=0.175), although there was no statistical significance. Furthermore, EGFR-positive had lower TMIT I tumors and higher TMIT II tumor than EGFR/ALK-negative (p=0.030, figure 5B). At the same time, there was no significant difference in TMIT between ALK-positive and EGFR/ALK-negative (p=0.926, figure 5E). Overall, EGFR-positive tumors showed a suppressive TIME, which may be the potential reason for the poor efficacy of immunotherapy in LUAD.
TCR characteristics in LUAD BMs
The above results from RNA-seq showed that CD8+T cells were the main differences in tumor microenvironment (TME) features between molecular subgroups. To further study the specific characteristics of T-cell repertoire in LUAD BMs, we extracted TCR CDR3 sequences from RNA-seq data and assembled them into TCR repertoire data.
TCR clonality and richness in primary lung tumors and BMs were compared. We found that T-cell clonality was higher in BMs (p=0.063), while T-cell richness (p=0.44) was lower in BMs (online supplemental figure S11A), although there is no statistical difference due to possibly small sample size. Furthermore, we explored the TCR repertoires between EGFR/ALK-positive and EGFR/ALK-negative. There were no statistically differences in clonality among the three groups (EGFR-positive, ALK-positive, and EGFR/ALK-negative; online supplemental figure S11B). However, T-cell richness was lower in the ALK-positive group compared with EGFR-positive and EGFR/ALK-negative (adjust p=0.054, online supplemental figure S11B).
Supplemental material
In parallel, we explored the CDR3 between EGFR/ALK-positive and EGFR/ALK-negative. Both CASSGRVLNTEAFF (p<0.05) and CASSLWSSSNEKLFF were higher in EGFR/ALK-negative group compared with EGFR/ALK-positive (online supplemental figure S11C).
In addition, we analyzed the association of TCR repertoires with clinical outcomes in the Xiangya BMs cohort (n=55). High clonality patients had longer OS than low clonality patients (log-rank p=0.031, online supplemental figure S11D). On the contrary, a longer median OS was found in the low richness group than in the high group (log-rank p=0.39, online supplemental figure S11D), although there was no statistical significance.
Clinical significance of the immune features in EGFR/ALK-positive and -negative BMs
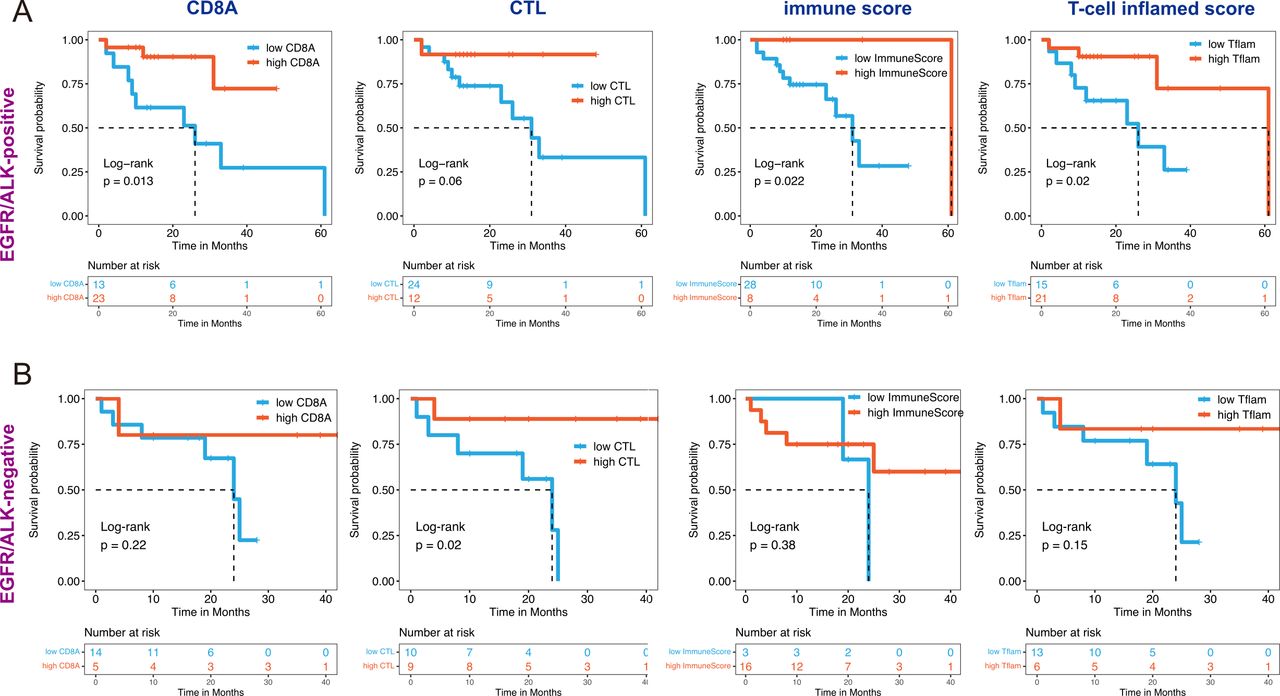
We explored the correlation between several immune factors and OS of patients with LUAD BMs. Considering the impact of driver gene mutation on a treatment option, KM survival analysis with a log-rank test was performed in EGFR/ALK-positive and EGFR/ALK-negative BMs, respectively. We observed that tumors with high immune factors (including high CD8A expression, CTL infiltration, immune score, and T-cell inflamed score) are associated with increased OS in both EGFR/ALK-positive and EGFR/ALK-negative patients (figure 6).

Association of immune features with outcomes of brain metastase in EGFR/ALK-positive and EGFR/ALK-negative group. All features divided into two categories: CD8A (high/low), CTL (high/low), ImmunScore (high/low), and T-cell inflamed score (high/low) were performed Kaplan-Meier survival analysis with statistically significance (log-rank p<0.05) in EGFR/ ALK-positive group (A) and EGFR/ALK-negative group (B). CTL, cytotoxic lymphocyte; Tflam, T-cell inflamed score.
Discussion
Owing to the exclusionary nature of the blood-brain barrier to peripheral effector immune cells and the immunosuppressive effects in the central nervous system (CNS), BMs hold a suppressive TIME characterized by reduced immune activated T cells and increased immunosuppressive cells compared with primary lung tumors.8 44 45 In this study, we explored the difference of immunologic landscape, including CD8+TILs, checkpoint molecules expression, and TCR repertoires, between primary LUAD and BMs and between different EGFR/ALK variation status. The prognostic significance of the clinical and immune molecular factors also was analyzed. To our knowledge, this is the first study to report the TIME based on different oncogenic alteration status (EGFR-positive, ALK-positive, and EGFR/ALK-negative) in BMs patients with LUAD. Figure 7 is a schematic representation of the findings presented in this study.
We depicted an immunosuppressed TIME in BMs compared with LUAD, exemplified by inhibition of T cell/B-cell activation and cytokine–cytokine receptor interaction as well as a low infiltrating abundance of CD8+T cells, CTLs, B cells, and Th1 cells and reduced IFN-γ signature score. Besides, the expression level of PD-1, CTLA-4, T cell immunoglobulin-3 (TIM-3), and TIGIT was reduced in BMs, while there was no significant difference in PD-L1 expression between BMs and matched LUAD despite lower infiltration level of CD8+TILs in BMs. It indicated that BMs possess a biological molecular basis to treat with anti-PD-L1 therapy. There were two mechanisms involved in the PD-L1 expression of tumor cells. First, TILs secrete IFN-γ to upregulate PD-L1 expression, thereby leading to adaptive immune evasion.42 46 Thus, there was a positive correlation between PD-L1 expression and the existence of TILs under the mechanism. Second, the expression of PD-L1 is upregulated by a constitutive oncogenic pathway.47 48 Consistent with the previous study,45 we found that PD-L1 expression was positively correlated with TILs markers (CD4 and CD8A) in primary LUAD, and no correlation was uncovered in BMs. Meanwhile, a lower IFN-γ signature score was observed in BMs compared with matched LUAD (p<0.05). Therefore, PD-L1 expression in BMs may be upregulated via the constitutive oncogenic pathway or other pathways, while less dependent on the secretion of IFN-γ induced by TILs.
Tumor infiltrating CD8+T cells and PD-L1 expression are key factors to access the TIME across solid tumor. In primary LUAD, the density of CD8+T cells is positively associated with antitumor activity and a good prognosis,49 which is thought to be the dominant effector cells following anti-PD-L1 therapy.50 PD-L1 expression is a more reproducible clinical biomarker used to evaluate the response to immunotherapy compared with TMB with multiple Phase III trials in NSCLC.51 Previous research with primary LUAD has shown reduced density of CD8+T cells and PD-L1 expression in EGFR/ALK-positive patients. In our study with BMs, 67 LUAD BMs samples (41 EGFR/ALK-positive and 26 EGFR/ALK-negative tumors) were included. Consistent with the result from primary LUAD, EGFR/ALK-positive BMs had lower CD8A expression and CD8+T cells infiltrations than EGFR/ALK-negative BMs by using RNA-seq and immunohistochemical analysis. However, there was no significant difference in PD-L1 expression between the two group. A previous study proposed four types of TME based on the TILs and PD-L1 expression, providing new insights for promoting the precision treatment of tumor immunology.42 Subsequently, Ock et al revealed four TMIT, including TMIT I tumor (high CD8A/high PD-L1), TMIT II tumor (low CD8A/low PD-L1), TMIT III tumor (low CD8A/high PD-L1), and TMIT IV tumor (high CD8A/low PD-L1), based on the mRNA expression of CD8A and PD-L1.41 Our study with BMs indicated that the EGFR/ALK-positive tumors had lower proportion of TMIT I and higher proportion of TMIT II than the EGFR/ALK-negative tumors. In addition, we found that EGFR/ALK-positive tumors had a significant higher proportion of TMIT III (low CD8A/high PD-L1) than EGFR/ALK-negative tumors (26.8% vs 7.7%), suggested that the upregulation of PD-L1 in EGFR/ALK-positive BMs might be more dependent on constitutive oncogenic pathways. TMIT III patients may have a low responsivity to anti-PD-L1 therapy, as the scarcity of effector cells may restrict the antitumor immune response, even in this scenario of high PD-L1 expression. For TMIT II and TMIT III patients, recruiting T lymphocytes into tumors might be needed. Of note, EGFR/ALK-negative tumor had a significantly higher proportion of TMIT IV (high CD8A/low PD-L1) than EGFR/ALK-positive tumor (34.6% vs 9.8%). Other suppressive pathways might be dominant in TMIT IV tumors.
Previous study found that both the EGFR-positive and ALK-positive LUAD indicated immunosuppressive TIME, but the characteristic is different.52 In our BMs cohort, 67 LUAD BMs samples were included for molecular subgroup analysis; the results similar to primary LUAD have been observed. Subsequently, we compared the TIME characteristics in LUAD or BMs between different EGFR/ALK status groups in detail. The activated T cells infiltrating in BMs are mainly derived from peripheral trafficking.53 We put forward a plausible hypothesis that low T-cell infiltration in EGFR/ALK-positive extracranial tumors may lead to a decreased T-cell trafficking into the brain. As expected, a concordant low infiltration of CD8+T cells was observed in EGFR/ALK-positive primary LUAD and BMs. In LUAD, elevated Treg cell infiltrations are exhibited in EGFR-mutant tumors compared with EGFR wild-type, in which EGFR mutations can persistently activate the JNK/cJun pathway to promote the recruitment of Treg cells.54 Similarly, we observed EGFR-positive LUAD had a borderline significantly higher Tregs infiltrations than others in the TCGA cohort. Consistent with results of primary LUAD, the EGFR-positive BMs indicated a TIME characterized by depleted CD8+TILs and elevated Treg cells (iTregs and nTregs). This finding is supported at both the mRNA and protein levels. Treg cells are one of the suppressive immune cells that promote tumor progression and the failure of antitumor immunity, and infiltration of Treg cells into tumor foci may elicit suppression of effector T cells.55 Thus, Tregs may play a major role in causing EGFR-positive BMs to exhibit immunosuppressive TME. In addition, in the TCGA LUAD cohort, the ALK-positive tumors had higher median infiltrations of M2 macrophages than the EGFR/ALK-negative group (p=0.175), although there was no statistical significance. Unanimously, in our study with BMs, the ALK-positive BMs showed a TIME marked by reduced CD8+TILs and raised M2-type macrophages at both the mRNA and protein levels. In BMs, most tumor-associated macrophages were derived from bone marrow-derived macrophages, while less from microglia.56 57 Macrophages/microglia can be polarized to M1-like and M2-like phenotypes based on functional differences. M1 polarization is defined as a proinflammatory phenotype. M2 macrophages/microglia contribute to immunosuppression, angiogenesis and tumor growth promotion.58 Consequently, both the EGFR-positive and the ALK-positive BMs indicated a TIME of diminishing activated immune cells and augmenting numbers of immunosuppressive cells. Importantly, the immunosuppressive characteristics of the two groups are different. Of note, KRAS-mutant tumors showed a marked immune activation status in LUAD BMs, exemplified by an elevated abundance of CD8+T cells, CTLs, and Tfh, and reduced immunosuppressed M2-macrophage. Similar to our result from BMs, in primary lung cancer, a retrospective study found KRAS-mutant tumors had a significantly higher PD-L1 expression, high CD8+T cells infiltration and higher TMB than EGFR-mutant tumors.17 59 A meta-analysis revealed that ICIs prolonged OS in the KRAS-mutant patients (HR=0.65; 95% CI: 0.44 to 0.97), but not in the KRAS wild-type patients (HR=0.86; 95% CI: 0.67 to 1.11) in advanced NSCLC.60 Therefore, the high response rate of KRAS-positive tumors to immunotherapy may be related to the activated immune microenvironment. Overall, our data spotlight the importance of detailed dissection of TIME to identify potential targets for different oncogene-driven BMs subgroups.
Due to the inaccessibility of BMs samples, there are still few studies on immune markers for postoperative prognosis in patients with BMs. A previous retrospective study suggested that CD8+TILs and T-cell clonality are potential prognostic biomarkers in patients with lung cancer with BMs.19 A limitation of the result is the too-small sample size with survival data (n=27). Another study showed that the protein level of CD3, TIM3, and LAG3 was positively correlated with OS in lung cancer-associated BMs.45 In our study, we found that high clonality had a longer OS than low clonality (log-rank p<0.05) and that high diversity had a borderline significant shorter OS than low diversity (log-rank p>0.05). Previous pilot studies revealed that tumor-infiltrated T-cell clonality could predict the response to ICIs therapy.61 Thus, our study supplemented the prognostic value of T-cell clonality and diversity in LUAD BMs. In addition, high infiltration level of CTL and high expression level of CD8A had a prolonged OS in BMs patients with LUAD, suggesting that the cytotoxic killing activity of the CD8+T cells plays an essential role in the prognosis of BMs patients.
This study has several limitations. The retrospective nature of our study restricts the range of our results. Additionally, our Xiangya BMs cohort was not an immunotherapy cohort, limiting the ability to evaluate the response to ICIs in different oncogene-driven BMs. Our paired sample size is too small, which limits the further expansion of the research. In addition, the data integrity of the treatment information in this study is insufficient, which limits the convincing power of the survival analysis results.
In summary, this study found that LUAD-derived BMs may exhibit an immunosuppressive TME. Besides, our study represents one of the first comprehensive TIME characterizations dedicated to EGFR/ALK-positive LUAD BMs. We revealed that EGFR-positive and ALK-positive BMs may exhibit different immunosuppressive characteristics; EGFR/ALK-negative BMs had relatively activated immunophenotype, showing higher CD8+T cells infiltrations, lower immunosuppressed M2-macrophages and Tregs, and a higher proportion of TMIT I tumor, and may be a potential population benefiting from ICIs. These findings boost molecular and clinical understanding of LUAD BMs.
Supplemental material
Supplemental material
Data availability statement
Data are available upon reasonable request. The raw sequence data reported in this paper have been deposited in the Genome Sequence Archive (Genomics, Proteomics & Bioinformatics 2021)62 in National Genomics Data Center (Nucleic Acids Res 2022),63 China National Center for Bioinformation / Beijing Institute of Genomics, Chinese Academy of Sciences (GSA-Human: HRA003286) that are publicly accessible at https://ngdc.cncb.ac.cn/gsa-human.
Ethics statements
Patient consent for publication
Ethics approval
All tissues were collected with the approval of the ethics committee of Xiangya Hospital, Central South University (No.202207391). All patients gave informed consent to participate in the study before taking part.
Acknowledgments
We thank the investigators and research staff involved in this study.
References
Supplementary materials
Supplementary Data
This web only file has been produced by the BMJ Publishing Group from an electronic file supplied by the author(s) and has not been edited for content.
- Data supplement 1
- Data supplement 2
- Data supplement 3
- Data supplement 4
- Data supplement 5
- Data supplement 6
- Data supplement 7
- Data supplement 8
- Data supplement 9
- Data supplement 10
- Data supplement 11
- Data supplement 12
- Data supplement 13
- Data supplement 14
- Data supplement 15
- Data supplement 16
- Data supplement 17
- Data supplement 18
Footnotes
Contributors Study conception and design: RZ, GX. The guarantor of this study: RZ. Sample and clinical data acquisition: ZL, LC, XW, DX. Data analysis: GX, LL, XG. Staining: GT, GX. Drafting of the manuscript: GX. Providing critical comments and suggestions for the manuscript: XG, LL, RZ, XfX. All authors read and approved the final manuscript.
Funding Research reported in this publication was supported by Beijing Xisike Clinical Oncology and Research Foundation (Y-HR2019-0185), Advanced Lung Cancer Research Fund for targeted therapy in China (CTONG-YC20210303) and National Multidisciplinary Cooperative Diagnosis and Treatment Capacity Building Project for Major Diseases of China (Lung Cancer, z027002).
Competing interests None declared.
Provenance and peer review Not commissioned; externally peer reviewed.
Supplemental material This content has been supplied by the author(s). It has not been vetted by BMJ Publishing Group Limited (BMJ) and may not have been peer-reviewed. Any opinions or recommendations discussed are solely those of the author(s) and are not endorsed by BMJ. BMJ disclaims all liability and responsibility arising from any reliance placed on the content. Where the content includes any translated material, BMJ does not warrant the accuracy and reliability of the translations (including but not limited to local regulations, clinical guidelines, terminology, drug names and drug dosages), and is not responsible for any error and/or omissions arising from translation and adaptation or otherwise.