Article Text

Abstract
Background Myeloid-derived suppressor cells (MDSCs) are a heterogeneous population of cells in tumor microenvironment, which suppress antitumor immunity. Expansion of various MDSC subpopulations is closely associated with poor clinical outcomes in cancer. Lysosomal acid lipase (LAL) is a key enzyme in the metabolic pathway of neutral lipids, whose deficiency (LAL-D) in mice induces the differentiation of myeloid lineage cells into MDSCs. These Lal-/- MDSCs not only suppress immune surveillance but also stimulate cancer cell proliferation and invasion. Understanding and elucidating the underlying mechanisms of MDSCs biogenesis will help to facilitate diagnosis/prognosis of cancer occurrence and prevent cancer growth and spreading.
Methods Single-cell RNA sequencing (scRNA-seq) was performed to distinguish intrinsic molecular and cellular differences between normal versus Lal-/- bone marrow–derived Ly6G+ myeloid populations in mice. In humans, LAL expression and metabolic pathways in various myeloid subsets of blood samples of patients with non-small cell lung cancer (NSCLC) were assessed by flow cytometry. The profiles of myeloid subsets were compared in patients with NSCLC before and after the treatment of programmed death-1 (PD-1) immunotherapy.
Results scRNA-seq of Lal-/- CD11b+Ly6G+ MDSCs identified two distinctive clusters with differential gene expression patterns and revealed a major metabolic shift towards glucose utilization and reactive oxygen species (ROS) overproduction. Blocking pyruvate dehydrogenase (PDH) in glycolysis reversed Lal-/- MDSCs’ capabilities of immunosuppression and tumor growth stimulation and reduced ROS overproduction. In the blood samples of human patients with NSCLC, LAL expression was significantly decreased in CD13+/CD14+/CD15+/CD33+ myeloid cell subsets. Further analysis in the blood of patients with NSCLC revealed an expansion of CD13+/CD14+/CD15+ myeloid cell subsets, accompanied by upregulation of glucose-related and glutamine-related metabolic enzymes. Pharmacological inhibition of the LAL activity in the blood cells of healthy participants increased the numbers of CD13+ and CD14+ myeloid cell subsets. PD-1 checkpoint inhibitor treatment in patients with NSCLC reversed the increased number of CD13+ and CD14+ myeloid cell subsets and PDH levels in CD13+ myeloid cells.
Conclusion These results demonstrate that LAL and the associated expansion of MDSCs could serve as targets and biomarkers for anticancer immunotherapy in humans.
- myeloid-derived suppressor cells
- immunotherapy
- tumor biomarkers
Data availability statement
All data relevant to the study are included in the article or uploaded as supplementary information.
This is an open access article distributed in accordance with the Creative Commons Attribution Non Commercial (CC BY-NC 4.0) license, which permits others to distribute, remix, adapt, build upon this work non-commercially, and license their derivative works on different terms, provided the original work is properly cited, appropriate credit is given, any changes made indicated, and the use is non-commercial. See http://creativecommons.org/licenses/by-nc/4.0/.
Statistics from Altmetric.com
WHAT IS ALREADY KNOWN ON THIS TOPIC
Lysosomal acid lipase (LAL) is well established for treating patients with LAL deficiency (LAL-D) (Wolman disease and cholesteryl ester storage disease). LAL-D in mice induces the differentiation of myeloid lineage cells into myeloid-derived suppressor cells (MDSCs) and promotes tumor growth and metastasis.
WHAT THIS STUDY ADDS
The study revealed a new mechanism by which LAL suppresses the differentiation and homeostasis of MDSCs in both animal models and humans. Based on this study, LAL can be repurposed for treating patients with cancer alone or in combination with programmed death ligand 1 checkpoint immunotherapy. In addition, LAL, metabolic enzymes, and elevated numbers of MDSCs can be used as biomarkers to predict lung cancer occurrence using blood samples.
HOW THIS STUDY MIGHT AFFECT RESEARCH, PRACTICE OR POLICY
New biomarker standards can be formulated for lung cancer diagnosis and prognosis. New immunotherapies can be developed to save human life.
Introduction
Myeloid-derived suppressor cells (MDSCs) are a heterogeneous population of cells generated during various pathological conditions, including cancer. In mice, MDSCs are defined as CD11b+Gr-1+ (Ly6-C/G) myeloid populations, while in humans, they are characterized as CD11b+/CD13+, CD14+, CD15+, CD33+/HLA-DR- myeloid populations.1–5 Clinical studies have shown a positive correlation of MDSC numbers in peripheral blood with cancer stage and tumor burden in multiple cancer types. Elevated numbers of MDSCs in circulation are also correlated with poor outcomes and reduced survival.4 MDSCs can also be used in predicting the response to various cancer therapies, which numbers are correlated with the response to chemotherapy, radiotherapy, and vaccine therapy.4 5 Inhibition of MDSCs during immunotherapy increases therapeutic effect in mouse tumor models.6–8 In tumor immunology, MDSCs are divided into two categories: tumor-induced MDSCs and pretumor MDSCs. It is vital to eliminate pre-existing MDSCs in the protumor microenvironment and tumor-induced MDSCs in the tumor microenvironment to prevent tumor growth and spreading. Understanding and elucidating the underlying mechanisms of MDSC biogenesis will help to achieve this goal.
Lysosomal acid lipase (LAL) hydrolyzes cholesteryl esters and triglycerides in lysosomes to generate free cholesterol and free fatty acids.9 As we reported previously, deficiency of LAL (LAL-D) plays critical role in MDSC differentiation and homeostasis, which induces the differentiation of normal myeloid lineage cells into MDSCs in LAL knockout (Lal-/-) mice.10 These pretumor MDSCs not only suppress immune surveillance11–13 but also directly stimulate cancer cell proliferation, progression, and invasion.14 15 In humans, it has been reported that heterozygote carriers of LAL mutations altered subsets of human MDSCs,16 and mutations in the LAL gene were linked to carcinogenesis.17 Patients (ages ranging from 11 to 58 years) with LAL-D without enzyme replacement therapy of Sebelipase alfa (or Kanuma, commercial name for recombinant human LAL) developed hepatocellular carcinoma, cholangiocarcinoma, and hepatocellular cholangiocarcinoma,18 suggesting that LAL serves as an attractive cancer therapy target.19 Our recent study further supported the idea that human cancer xenotransplants were able to grow in Lal-/- mice.20 Expression of human LAL in multiple organs of Lal-/- mice successfully corrected CD11b+Ly6G+ MDSC expansion and T-cell suppression.13 21 22
To distinguish intrinsic molecular and cellular differences between normal versus Lal-/- CD11b+Ly6G+ myeloid populations, two distinct clusters with differential gene expression patterns were identified using single-cell RNA sequencing (scRNA-seq). Further analysis revealed a major metabolic shift towards glucose utilization and reactive oxygen species (ROS) overproduction in Lal-/- MDSCs. Pyruvate dehydrogenase (PDH) in the glycolytic pathway played an important role in controlling Lal-/- MDSCs’ functions and ROS production. Programmed death ligand-1 (PD-L1) upregulation was also observed in Lal-/- MDSCs. In human patients with non-small cell lung cancer (NSCLC), LAL expression was significantly decreased in CD13+/CD14+/CD15+/CD33+ myeloid cell subsets, accompanied by significant expansion of these MDSC subsets and upregulation of PDH in MDSCs, which are similar to the observations made in mice. Programmed death-1 (PD-1) checkpoint inhibitor treatment in patients with NSCLC partially reversed the increased CD13+/CD14+ myeloid cell subsets and PDH. These studies demonstrate that LAL and associated MDSC expansion could serve as biomarkers for diagnosis and prognosis of NSCLC, which in turn serve as targets for cancer immunotherapy treatment in humans.
Materials and methods
Animals and cell lines
Wild-type (Lal+/+) and Lal−/− mice of the FVB/N background were bred inhouse.23 24 Both male and female mice aged 3–5 months were used, and all the mice have been backcrossed for more than 10 generations. All scientific protocols involving the use of animals have been approved by the Institutional Animal Care and Use Committee of Indiana University School of Medicine (no 22047) and followed guidelines established by the Panel on Euthanasia of the American Veterinary Medical Association. Animals were housed under Institutional Animal Care and Use Committee–approved conditions in a secured animal facility at Indiana University School of Medicine.
The murine B16 melanoma cell line and Lewis lung carcinoma (LLC) cell line (ATCC, Manassas, Virginia, USA) were cultured in Dulbecco's Modified Eagle Medium (DMEM) supplemented with 10% fetal bovine serum (FBS) (Gibco) in a 37°C incubator with 5% CO2.
Human blood samples
The human blood samples of normal subjects and patients with NSCLC (at stage III–IV) were obtained from Indiana Biobank and Simon Cancer Center of Indiana University School of Medicine, respectively (see online supplemental table 8 for blood donor characteristics). Patients with NSCLC were selected by screening with PD-L1 Tumor Proportion Score (TPS) ≥10%. Both normal subjects and patients with NSCLC include men and women, White and African American. To inhibit LAL activity, human blood cells from healthy participants had the red cells removed with lysis buffer (BioLegend, San Diego, California, USA), washed with phosphate-buffered saline (PBS) by centrifugation at 240×g for 5 min at room temperature, and then incubated with 10 µM LAL inhibitor Lalistat2 (Cayman, Ann Arbor, Michigan, USA) for 24 hours. As a control, human blood cells were incubated with dimethyl sulfoxide (DMSO). All protocols involving the use of human blood have been approved by the Institutional Biosafety Committee of Indiana University School of Medicine (no 1908650279), and written informed consent was received prior to participation.
Supplemental material
Isolation of bone marrow Ly6G+ cells
Ly6G+ cells were isolated by magnetic bead sorting as we previously described.15 For CPI-613 treatment, freshly isolated Ly6G+ cells were pretreated with DMSO or 10 µM CPI-613 at 37°C for 1 hour, and then cocultured with CD4+ T cells or coinjected with B16 melanoma cells for further analysis.
Single-cell RNA sequencing and data analysis
Ly6G+ cells were sorted from the bone marrow of Lal+/+ and Lal−/− mice. Cells sorted from six Lal+/+ mice and six Lal−/− mice were pooled together and mixed well. The number and viability of Ly6G+ cells were 1100 cells/µL and >95%, respectively. Immediately after sorting, Ly6G+ single cells were run on the 10X Chromium (10X Genomics) and then through library preparation by the Center for Medical Genomics at Indiana University School of Medicine following the recommended protocol for the Chromium Single Cell 3′ Reagent Kit. Libraries were run on the NovaSeq S1 for Illumina sequencing. CellRanger 3.0.2 (http://support.10xgenomics.com/) was used to process the raw sequence data generated, and data were analyzed as previously described.25
Western blot analysis
Western blot analysis was performed as previously described26 using antibodies against hexokinase 1 (HK1), HK2, HK3, glucose-6-phosphate dehydrogenase (G6PD), PDH, lactate dehydrogenase A (LDHA), LDHB, and glutamate dehydrogenase (GLUD) (rabbit monoclonal antibodies, 1:1000; Cell Signaling). Antibody against β-actin (rabbit monoclonal antibody, 1:2000; Cell Signaling) was used as a loading control. For detection, the membrane was incubated with anti-rabbit IgG secondary antibody conjugated with horseradish peroxidase (1:2000, Cell Signaling). Bands were visualized using SuperSignal West Pico Chemiluminescent substrate (Thermo Scientific Pierce).
Measurement of glucose, pyruvate, and α-ketoglutarate levels
Measurement of glucose, pyruvate, and α-ketoglutarate levels was performed using the glucose assay kit (Sigma, catalog no GAHK20), pyruvate assay kit (Sigma, catalog no MAK071), and α-ketoglutarate assay kit (Sigma, catalog no MAK054), respectively. Briefly, samples were prepared from freshly isolated Ly6G+ cells according to the assay kits’ instructions. Lysates were then incubated with reaction mix for a designated time and ready for the absorbance measuring.
Flow cytometry analysis
For analyses of percentages of CD11b+Ly6G+ and Ly6G+Ly6C+ cells, single cells harvested from the bone marrow of Lal+/+ and Lal-/- mice were stained with APC eFluor 780-conjugated anti-Ly6G antibody (1A8-Ly6g, catalog no 47-9668-82), fluorescein isothiocyanate-conjugated anti-CD11b antibody (M1/70, catalog no 11-0112-82), and PE-conjugated anti-Ly6C antibody (HK1.4, catalog no 12-5932-82) (eBioscience, San Diego, California, USA) at 4°C for 15 min. For the analysis of PD-L1 expression in Ly6G+ cells, cells were stained with APC eFluor 780-conjugated anti-Ly6G antibody, PE-conjugated anti-CD11c antibody (N418, catalog no 12-0114-82) (eBioscience), and PE-Cy7-conjugated anti-PD-L1 antibody (10F.9G2, catalog no 124314) (BioLegend) at 4°C for 15 min. Cells were washed with PBS and then were ready for flow cytometry analysis.
For flow cytometry analysis of human blood samples, human blood cells had the red cells removed, washed with PBS, and stained with APC-eFluor 780-conjugated anti-CD11b antibody (ICRF44, catalog no 47-0118-42), FITC-conjugated anti-CD13 antibody (WM15, catalog no 11-0138-42), PE-conjugated anti-CD14 antibody (61D3, catalog no 12-0149-42), APC-conjugated anti-CD15 antibody (MMA, catalog no 17-0158-42), PE-conjugated anti-CD33 antibody (HIM3-4, catalog no 12-0339-42), and PE-Cy7-conjugated anti-human leukocyte antigen-DR isotype antibody (L243, catalog no 25-9952-42) (eBioscience) at 4°C for 15 min. Cells were then washed with PBS, fixed with 1% paraformaldehyde and prepared for flow cytometry analysis. To analyze LAL levels, cells were further fixed and permeabilized using BD Cytofix/Cytoperm Fixation/Permeabilization Kit and incubated with non-fluorescence conjugated anti-LAL antibody27 at 4°C overnight. To analyze metabolic enzyme levels, cells after fixation and permeabilization were incubated with non-fluorescence-conjugated antibodies against metabolic molecules including G6PD (D5D2, catalog no 12 263S), LDH (C28H7, catalog no 3558S), PDH (catalog no 2784S), and GLUD (D9F7P, catalog no 12 793S) (Cell Signaling, Beverly, Massachusetts, USA) at 4°C overnight. On the next day, cells were washed and stained with APC-conjugated or FITC-conjugated anti-rabbit IgG antibody at 4°C for 30 min and then washed for flow cytometry analysis. For flow cytometry analysis, ≥50 000 cells were acquired and scored using an LSRII machine (mouse samples) or Fortessa (human samples) (BD Biosciences). Data were processed using BD CellQuest Pro software (V.19.f3fcb) and FlowJo (V.10.6.1) (BD Biosciences).
T-cell proliferation assay
CD4+ T cells were isolated from the spleen and labeled with carboxyfluorescein succinimidyl ester (CSFE) as previously described.28 CFSE-labeled CD4+ T cells were cocultured with Ly6G+ cells in 96-well plates precoated with anti-CD3 monoclonal antibody (mAb) (2 µg/mL) (145-2 C11, catalog no 553057) and anti-CD28 mAb (5 µg/mL) (37.51, catalog no 553295) (BD Biosciences) at 37°C, 5% CO2 for 4 days. The ratio of Ly6G+ cells to CD4+ T cells was 1:5. Proliferation of CD4+ T cells was evaluated as CFSE dilution by flow cytometry analysis.
ROS measurement
The ROS level in Ly6G+ cells was measured by flow cytometry as previously described.26 Ly6G+ cells from Lal+/+ and Lal-/- mice with or without CPI-613 pretreatment were collected and stained with APC eFluor 780-conjugated anti-Ly6G antibody, FITC-conjugated anti-CD11b antibody, and 2 µmol/L 2′, 7′-dichlorofluorescein diacetate (Invitrogen, Carlsbad, California, USA) at 37°C for 30 min. After PBS washing, the ROS level in Ly6G+ cells was analyzed using an LSRII machine.
Subcutaneous injection of tumor cells into Lal+/+ mice
To study the effect of Ly6G+ cells on tumor growth, isolated Ly6G+ cells (1×10⁶) from Lal+/+ or Lal-/- mice were pretreated with DMSO or 10 µM CPI-613 for 1 hour, mixed with B16 melanoma cells (2×10⁵), and the cell mixture was injected subcutaneously at the flank region of Lal+/+ recipient mice. The tumor growth was monitored twice a week. The tumor volume (mm3) was estimated by measuring the maximal length (L) and width (W) of a tumor and calculated using the formula: (length×width2)/2. For tumor-bearing MDSC experiments, Lal+/+ or Lal-/- mice were injected with 1×10⁶ B16 melanoma cells at flank sites on two sides. Fourteen days later, the mice were sacrificed. Tumor tissues were harvested, digested for single cell preparation, and stained for flow cytometry analysis of the CD11b+Ly6G+ cells.
In vitro coculture of Ly6G+ and tumor cells
B16 melanoma or LLC cells were harvested, resuspended, and adjusted to density at 5×10⁴ cells/mL. Isolated Ly6G+ cells with or without 10 µM CPI-613 pretreatment were prepared at the cell density of 5×10⁶ cells/mL. One hundred microliter of Ly6G+ cells and 100 µL of B16 melanoma/LLC cells were mixed and seeded into a well of 96-well plates in DMEM supplemented with 10% FBS. Seventy-two hours later, unattached Ly6G+ cells were removed by washing with PBS, and the number of attached B16 melanoma/LLC cells was counted. Morphologically, Ly6G+ cells are much smaller than B16 melanoma/LLC cells for exclusion.
Small interfering RNA transfection
Before transfection, Ly6G+ cells were seeded into 96-well plates at a density of 1×10⁶ cells/well. For small interfering RNA (siRNA)-mediated gene knockdown, 50 nmol/L of PDH siRNA (containing a mixture of three independent siRNAs targeting different regions of PDH) or control siRNA was transfected into Ly6G+ cells with DharmaFECT Transfection Reagent I (Dharmacon) according to the manufacturer’s protocol. After 24 hours of transfection, cells were harvested for further analysis.
Statistics
Data are expressed as mean±SD. Differences between two treatment groups were compared by two-tailed Student’s t-test. When more than two groups were compared, one-way analysis of variance (ANOVA) with post hoc Newman-Keul’s multiple comparison test was used. When the data were entered into a grouped table with subcolumns, two-way ANOVA with multiple comparison test was used. A p value less than 0.05 was considered statistically significant. All analyses were performed with GraphPad Prism 8.4.1 (GraphPad, San Diego, California, USA).
Results
Characteristics of Lal-/- versus Lal+/+ Ly6G+ cells by scRNA-seq
Unlike classical monocytic (M)-MDSCs (CD11b+Ly6C+) and polymorphonuclear (PMN)-MDSCs (CD11b+Ly6G+) in tumor-infiltrating MDSCs, LAL-D-induced MDSCs are both Ly6G high and Ly6C high (>76%–80% double positive) in the blood and bone marrow (online supplemental figure 1A,B). Collectively, they are defined as LAL-D MDSCs and purified using Ly6G antibody. This agrees with our previous observations.13 15 In comparison to blood and bone marrow LAL-D MDSCs, tumor-infiltrating CD11b+Ly6G+ cells were not increased in Lal-/- mice after tumor transplantation, which is probably due to overburden and pool exhaustion as the myeloid compartment is already significantly expanded (online supplemental figure 1C). Since the bone marrow LAL-D CD11b+Ly6G+ cells are the source for MDSC expansion, which have been reported to have immunosuppressive and tumor-stimulatory functions to facilitate tumor growth and metastasis,13 15 they are chosen for further analyses. To better reveal the underlying mechanisms and get a more comprehensive understanding of Lal-/- versus Lal+/+ Ly6G+ cells, scRNA-seq was performed. Ly6G+ cells were isolated from the bone marrow of Lal+/+ and Lal-/- mice for scRNA-seq analysis. The volcano plot of gene differential expression and the heat maps of top 50 upregulated and downregulated genes were presented in figure 1A. Further analysis of the T-stochastic neighbor embedding (tSNE) plot identified two major distinctive cellular clusters of Ly6G+ cells: (1) clusters 1, 2, 3 (referred to as cluster 123 hereafter) with increased cellular numbers and (2) clusters 0, 4, 6, 8 (referred to as cluster 0468 hereafter) with decreased cellular numbers in Lal-/- Ly6G+ cells versus Lal+/+ Ly6G+ cells (figure 1B). Both cluster 123 and cluster 0468 demonstrated the neutrophil feature (online supplemental table 1). The top upregulated genes and downregulated genes in cluster 123 and cluster 0468 of Lal-/- Ly6G+ cells can be categorized into three groups: (1) those expressed by an increased number of cells in cluster 123 with no change in cluster 0468 (figure 1C); (2) those expressed by an increased number of cells in cluster 123 and a decreased number in cluster 0468 (figure 1D) and (3) those expressed by an increased number of cells in both cluster 123 and cluster 0468 (figure 1E). Log fold change, gene expression and cellular numbers of the top 50 upregulated and downregulated genes among all clusters, cluster 123, and cluster 0468 are presented in online supplemental tables 2-7.
Supplemental material

Identification and gene expression of Lal-/- versus Lal+/+ Ly6G+ cell clusters by scRNA-seq. (A) The volcano plot and heat maps of top 50 upregulated/downregulated genes. (B) The tSNE plot of Ly6G+ cell clusters from Lal-/- versus Lal+/+ mice. Each dot represents a single cell colored by cluster assignment. Clusters 1, 2, and 3 have increased cellular numbers in Lal-/- versus Lal+/+ Ly6G+ cells (cluster 1: 2935 vs 1888; cluster 2: 2065 vs 973; cluster 3: 1722 vs 811), and clusters 0, 4, 6, and 8 have decreased cellular numbers in Lal-/- versus Lal+/+ Ly6G+ cells (cluster 0: 2388 vs 3808; cluster 4: 392 vs 1040; cluster 6: 336 vs 501; cluster 8: 121 vs 446). The dotted blue line circles cluster 123, and the dotted red line circles cluster 0468. (C) Percentages of cells for expressed genes were increased in cluster 123 and relatively unchanged in cluster 0468 of Lal-/- versus Lal+/+ Ly6G+ cells. The percentage was calculated using the number of expressed cells for the gene divided by the number of cells for this sample. (D) Percentages of cells for expressed genes were increased in cluster 123 but decreased in cluster 0468 of Lal-/- versus Lal+/+ Ly6G+ cells. (E) Percentages of cells for expressed genes were increased in both clusters 123 and 0468 of Lal-/- versus Lal+/+ Ly6G+ cells. DEGs, differentially expressed genes; KO, knockout; MDSC, myeloid-derived suppressor cell; scRNA-seq, single-cell RNA sequencing; tSNE, T-stochastic neighbor embedding; WT, wild type.
Metabolic reprogramming in Lal-/- Ly6G+ cells
During pathway analysis of scRNA-seq, we noticed that genes involved in glycolysis and the citrate cycle were upregulated in cluster 123 (green colored) and downregulated in cluster 0468 (red colored) of Lal-/- Ly6G+ cells versus Lal+/+ Ly6G+ cells (figure 2A,B). Similarly, when the expression of genes responding to ROS (selected from the MGI database) was compared between these two clusters, there was a significant shift from cluster 0468 to cluster 123, with increased expression in cluster 123 of Lal-/- Ly6G+ cells versus Lal+/+ Ly6G+ cells (figure 2C). The above observations were confirmed by western blot assay, in which protein expressions of HK1, HK2, HK3, and PDH in the glycolytic pathway, G6PD in the pentose phosphate pathway, and LDH in the anaerobic glycolysis were all increased in Lal-/- Ly6G+ cells (figure 2D). Additionally, the concentrations of glucose (the entry substrate of glycolysis) and pyruvate (the end product of glycolysis) were measured in bone marrow Ly6G+ cells. Results showed that both glucose flux and pyruvate level were increased in Lal-/- Ly6G+ cells versus Lal+/+ Ly6G+ cells (figure 2E), an indication of increased glycolysis. GLUD in the glutamine pathway also showed upregulation in Lal-/- Ly6G+ cells versus Lal+/+ Ly6G+ cells at the protein level, accompanied by an increased α-ketoglutarate level (figure 2D,E). Taken together, these results suggest a metabolic switch to glucose and amino acid utilization in Lal-/- Ly6G+ cells.
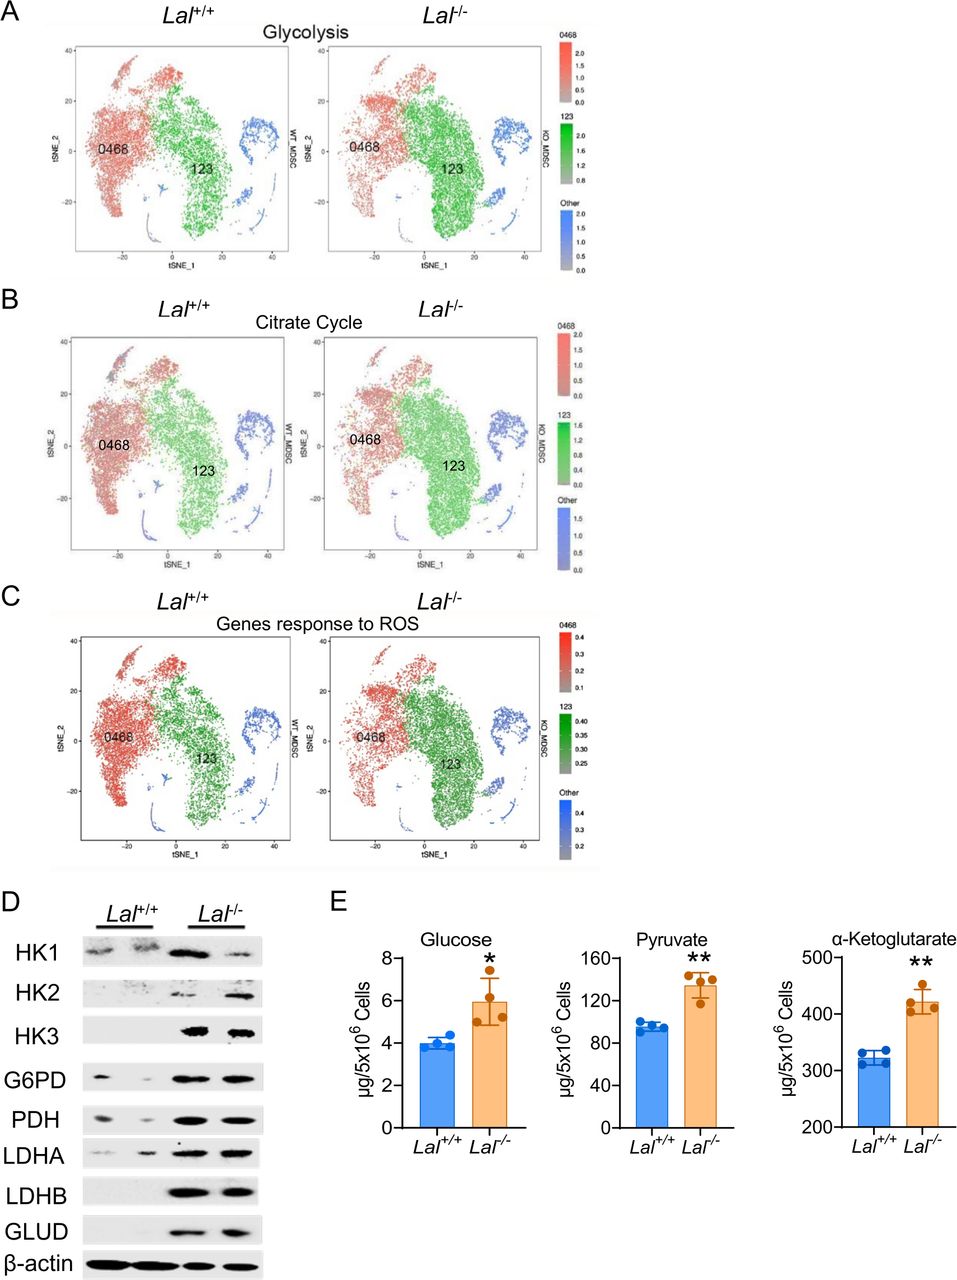
Metabolic reprogramming in Lal-/- Ly6G+ cells. (A) The tSNE plot of genes involved in glycolysis in Lal-/- versus Lal+/+ Ly6G+ cells. (B) The tSNE plot of genes involved in the citrate cycle in Lal-/- versus Lal+/+ Ly6G+ cells. (C) The tSNE plot of genes responding to ROS in Lal-/- versus Lal+/+ Ly6G+ cells. In (A), (B) and (C), green dots represent cluster 123, red dots represent cluster 0468, and blue dots represent other clusters. (D) Expressions of metabolic enzymes in Lal-/- versus Lal+/+ Ly6G+ cells by western blot analysis. (E) Levels of glucose, pyruvate, and α-ketoglutarate in Lal-/- versus Lal+/+ Ly6G+ cells. Data are expressed as mean±SD; experiments were independently repeated, n=4. *p<0.05, **p<0.01. G6PD, glucose-6-phosphate dehydrogenase; GLUD, glutamate dehydrogenase; HK, hexokinase; KO, knockout; LDHA, lactate dehydrogenase A; LDHB, lactate dehydrogenase B; MDSC, myeloid-derived suppressor cell; ROS, reactive oxygen species; tSNE, T-stochastic neighbor embedding; WT, wild type.
Inhibition of PDH reversed overproduction of ROS, suppression of T-cell proliferation, and stimulation of tumor cell proliferation in Lal-/- Ly6G+ cells
PDH is a key mitochondrial enzyme that acts as the entry point for pyruvate entering the TCA cycle (citric acid cycle) by transforming into acetyl-CoA, whose expression was upregulated in Lal-/- Ly6G+ cells versus Lal+/+ Ly6G+ cells (figure 2D). To assess the functional relevance of PDH upregulation, PDH inhibitor CPI-613 was used to block glycolysis in Lal-/- Ly6G+ cells. Injection of CPI-613 into mice reduced CD11b+Ly6G+ cells cells in LAL-/- mice (figure 3A). In addition, CPI-613 significantly reversed the overproduction of ROS in CD11b+Ly6G+ cells versus Lal+/+ Ly6G+ cells (figure 3B). The effect of PDH inhibition on Lal-/- Ly6G+ cells’ functions was further investigated. To evaluate if CPI-613 treatment of Lal-/- Ly6G+ cells affect suppression on T cells, CFSE-labeled T cells were cocultured with Lal+/+ or Lal-/- Ly6G+ cells that were pretreated with CPI-613 or DMSO. Results showed that inhibiting PDH with CPI-613 reversed the Lal-/- Ly6G+ cells’ suppressive activity on T-cell proliferation versus Lal+/+ Ly6G+ cells (figure 3C). Next, Lal+/+ or Lal-/- Ly6G+ cells after CPI-613 pretreatment were in vitro cocultured with B16 melanoma or LLC cells or in vivo coinjected with B16 melanoma cells subcutaneously into Lal+/+ recipient mice. CPI-613 pretreated Lal-/- Ly6G+ cells showed reduced capabilities in promoting tumor cell proliferation when cocultured with B16 melanoma and LLC cells in vitro (figure 3D) and stimulating tumor growth when coinjected with B16 melanoma cells in vivo (figure 3E). Since CPI-613 also blocks α-ketoglutarate dehydrogenase in the TCA cycle, a specific siRNA knockdown of PDH was performed, which was shown in figure 3F. Similar to the effects of CPI-613, the knockdown of PDH in Lal-/- Ly6G+ cells not only decreased their ROS production (figure 3G) but also reduced their ability in stimulating tumor cell proliferation (figure 3H). Interestingly, PD-L1 expression was upregulated in bone marrow–derived Lal-/- Ly6G+ cells by western blot analysis versus Lal+/+ Ly6G+ cells (figure 3I). Similar to the metabolic enzyme genes involved in glycolysis and the citrate cycle, the PD-L1 gene (Cd274) was upregulated in cluster 123 (green colored) and downregulated in cluster 0468 (red colored) of Lal-/- Ly6G+ cells versus Lal+/+ Ly6G+ cells (figure 3J). In vivo CPI-613 treatment effectively reduced PD-L1 expression by flow cytometry in Lal-/- Ly6G+ cells versus Lal+/+ Ly6G+ cells (figure 3K).
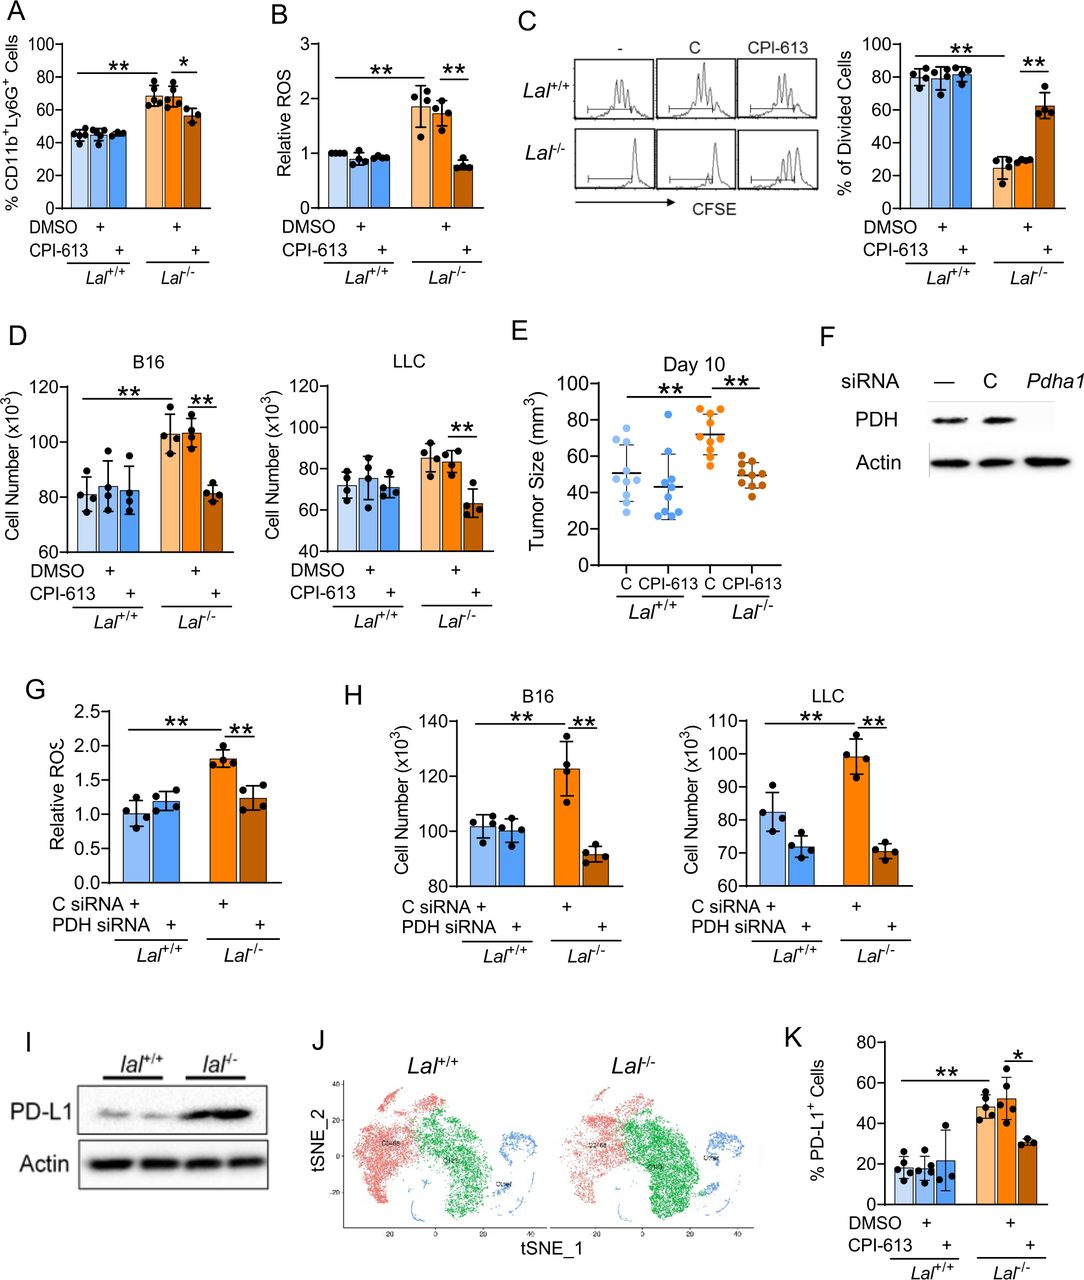
PDH inhibition of CD11b+Ly6G+ cells. (A) Mice received 5 mg/kg CPI-613 on days 0, 2, 4, and 7. On day 8, the CD11b+Ly6G+ population in the bone marrow was determined by flow cytometry. (B) ROS production in Lal+/+ and Lal-/- Ly6G+ cells after CPI-613 treatment in vivo. (C) T-cell proliferation after cocultured with CPI-613-pretreated Lal+/+ or Lal-/- Ly6G+ cells. Peaks represent cell division cycles. PBS was used as a negative control. A representative CFSE dilution by flow cytometry is on the left. Statistical analyses of % of divided CD4+ T cells is on the right. (D) Proliferation of B16 melanoma and LLC cells after cocultured with CPI-613-pretreated Lal+/+ or Lal-/- Ly6G+ cells in vitro for 72 hours. (E) Tumor burden of B16 melanoma cells after coinjection with CPI-613-pretreated Lal+/+ or Lal-/- Ly6G+ cells in vivo. The tumor size was measured at 10 days. (F) siRNA knockdown of PDH protein expression in Lal-/- Ly6G+ cells by western blot. (G) ROS production in Lal+/+ and Lal-/- Ly6G+ cells after transfected with PDH siRNA for 24 hours. (H) Proliferation of B16 melanoma and LLC cells after cocultured with PDH siRNA-transfected Lal+/+ versus Lal-/- Ly6G+ cells in vitro. (I) PD-L1 expression in Lal-/- versus Lal+/+ Ly6G+ cells by western blot. (J) The tSNE plot of CD274 in Lal-/- Ly6G+ versus Lal+/+ Ly6G+ cells by scRNA-seq. (K) Mice received 5 mg/kg CPI-613 on days 0, 2, 4, and 7. On day 8, the percentage of PD-L1+ cells in Ly6G+CD11c+ cells was measured by flow cytometry analysis. Data are expressed as mean±SD. Experiments were independently repeated. n=4 for (A)–(D), (F)–(H), and (J), n=10 for (E). *p<0.05, **p<0.01. LLC, Lewis lung carcinoma; PBS, phosphate-buffered saline; PD-L1, programmed death ligand-1; PDH, pyruvate dehydrogenase; ROS, reactive oxygen species; scRNA-seq, single-cell RNA sequencing; siRNA, small interfering RNA; tSNE, T-stochastic neighbor embedding.
Decrease of LAL expression in myeloid subsets of patients with NSCLC
In the Lal-/- mouse model, expansion of MDSCs is a pre-existing condition in favor of tumor growth. We recently reported the downregulation of LAL gene expression in various human cancer forms by data mining analyses of the TCGA database, and in the whole blood cells of patients with NSCLC versus healthy subjects by flow cytometry.25 It is very inconvenient to use tumor-infiltrating MDSCs for diagnosis/prognosis purposes without going through biopsy for patients with lung cancer. In comparison, it is relatively easy to obtain blood samples from patients for diagnosis/prognosis. Here, we further assessed LAL expression in various blood myeloid subsets of patients with NSCLC by flow cytometry. The LAL protein level was downregulated in blood CD13+, CD14+, CD15+, and CD33+ myeloid subsets from patients with NSCLC versus healthy subjects (figure 4A,B). Further analyses demonstrated the downregulation of the LAL protein level in CD11b+HLA-DR− double-gated myeloid cells and in CD11b+CD13+HLA-DR−, CD11b+CD14+HLA-DR−, CD11b+CD15+HLA-DR−, and CD11b+CD33+HLA-DR− triple-gated myeloid subsets of patients with NSCLC versus healthy subjects (figure 4A,B). The percentages of LAL+ cells were also reduced in the above myeloid subsets (figure 4C). Therefore, the levels of LAL protein expression in CD13+/CD14+/CD15+/CD33+ myeloid subsets can be used as potential negative biomarkers for the diagnosis and prognosis of NSCLC.

Expressions of LAL in NSCLC versus healthy subjects. (A) A representative gating strategy of LAL+ cells in CD11b+HLA-DR-, CD13+, CD14+, CD15+, CD33+, CD11b+CD13+HLA-DR-, CD11b+CD14+HLA-DR-, CD11b+CD15+HLA-DR-, and CD11b+CD33+HLA-DR- cells. (B) Statistics of MFI of LAL in the whole blood and myeloid subsets of patients with NSCLC versus healthy subjects. (C) Statistical analysis of percentages of LAL+ cells in the whole blood and myeloid subsets of patients with NSCLC versus healthy subjects. Data are expressed as mean±SD; experiments were independently repeated, n=6–8. *p<0.05, **p<0.01. LAL, lysosomal acid lipase; NSCLC, non-small cell lung cancer.
Changes of myeloid subsets in patients with NSCLC
Not only LAL serves as a biomarker, various myeloid subsets in the blood can also serve as potential indicators for diagnosis and prognosis of NSCLC. MDSCs in the human blood are a heterogeneous population (HLA-DR-/ CD11b+, CD13+, CD14+, CD15+, CD33+, CD11c+, etc).29 Figure 5A,B showed that the percentages of CD11b+HLA-DR−, CD13+, CD14+, and CD15+ myeloid cells were all increased in patients with NSCLC versus healthy subjects. The percentages of CD33+ myeloid cells did not change obviously in the leucocytes (figure 5A,B). Furthermore, in CD11b+HLA-DR− double-gated myeloid cells, the percentages of CD11b+CD13+HLA-DR−, CD11b+CD14+HLA-DR−, and CD11b+CD15+HLA-DR− MDSC subsets were all significantly increased in patients with NSCLC, while there was no change in the percentages of CD11b+CD33+HLA-DR− MDSC subset (figure 5C,D). Therefore, CD13+/CD14+/CD15+ myeloid subsets serve as potential indicators for diagnosis and prognosis of patients with NSCLC. The percentages of CD13+ and CD14+ cells were also increased in the blood and bone marrow of Lal-/- mice (online supplemental figure 2). To definitively show whether LAL blockade induces differentiation of human myeloid cells, leucocytes from healthy subjects were treated with LAL-specific inhibitor Lalistat2 for flow cytometry analysis. Results showed that blocking the LAL activity indeed increased the percentages of CD11b+CD13+HLA-DR− and CD11b+CD14+HLA-DR− MDSC subsets. The induction of CD11b+CD15+HLA-DR− MDSC subset did not reach statistical significance (figure 5E).
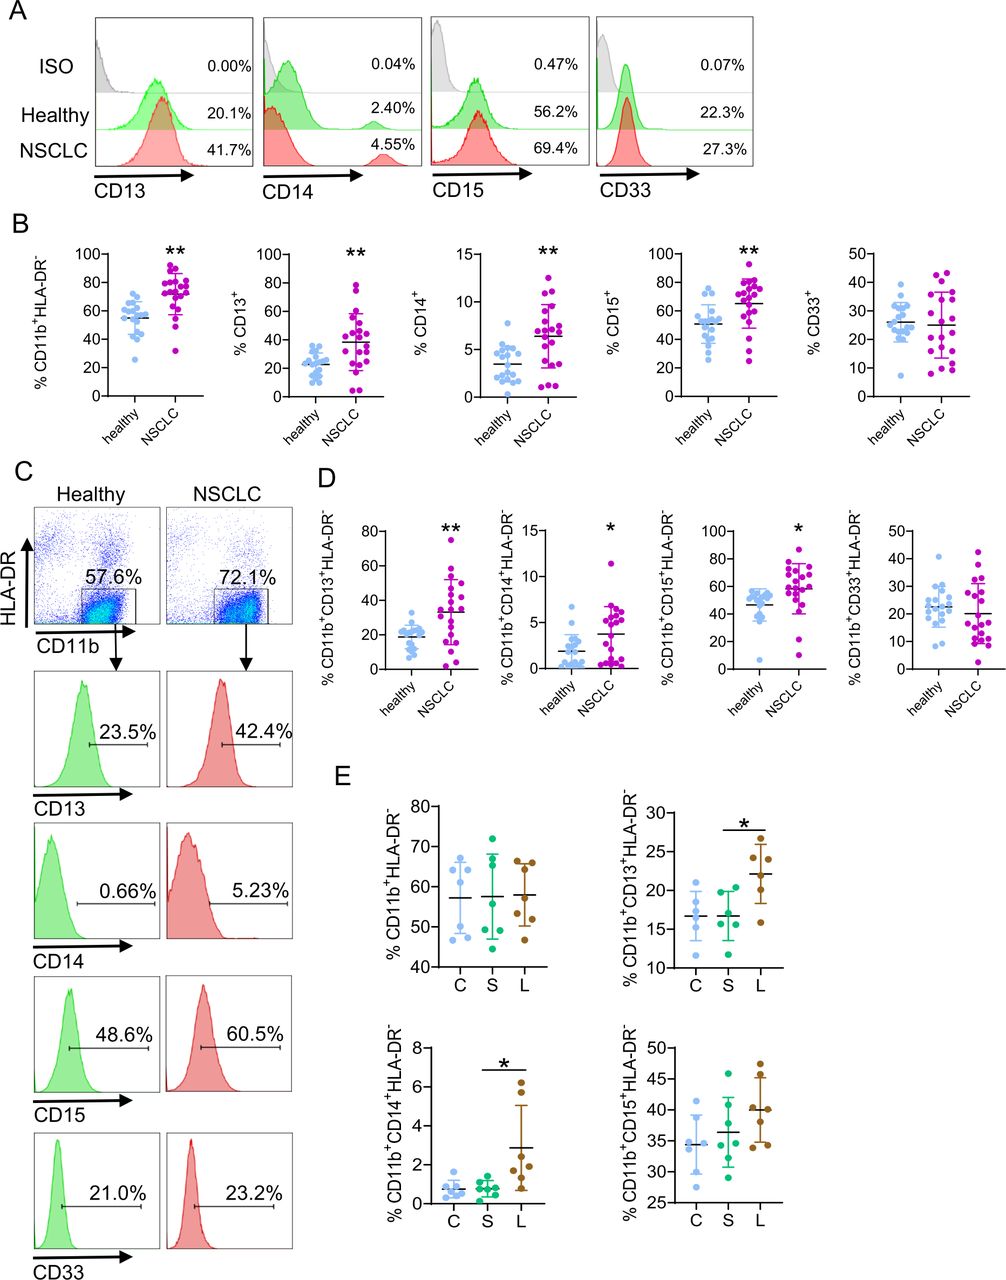
Profiles of myeloid subsets in NSCLC versus healthy subjects. (A) A representative gating strategy of CD13+, CD14+, CD15+, and CD33+ cells in the leucocytes. (B) Statistical analysis of percentages of CD11b+HLA-DR-, CD13+, CD14+, CD15+, and CD33+ cells in the leucocytes. (C) A representative gating strategy of CD13+, CD14+, CD15+, and CD33+ cells in CD11b+HLA-DR- cells. (D) Statistical analysis of percentages of CD13+, CD14+, CD15+, and CD33+ cells in CD11b+HLA-DR- cells. (E) Human leucocytes from healthy individuals were incubated with 10 µM Lalistat2 (L) or DMSO (S) for 24 hours. The percentages of CD11b+HLA-DR-, CD11b+CD13+HLA-DR-, CD11b+CD14+HLA-DR-, and CD11b+CD15+HLA-DR- cells were analyzed by flow cytometry. C is the control without treatment. Data are expressed as mean±SD; experiments are independently repeated, n=19–20 for (B) and (D), n=6–7 for (E). *p<0.05, **p<0.01. NSCLC, non-small cell lung cancer.
Upregulation of metabolic enzymes in patients with NSCLC
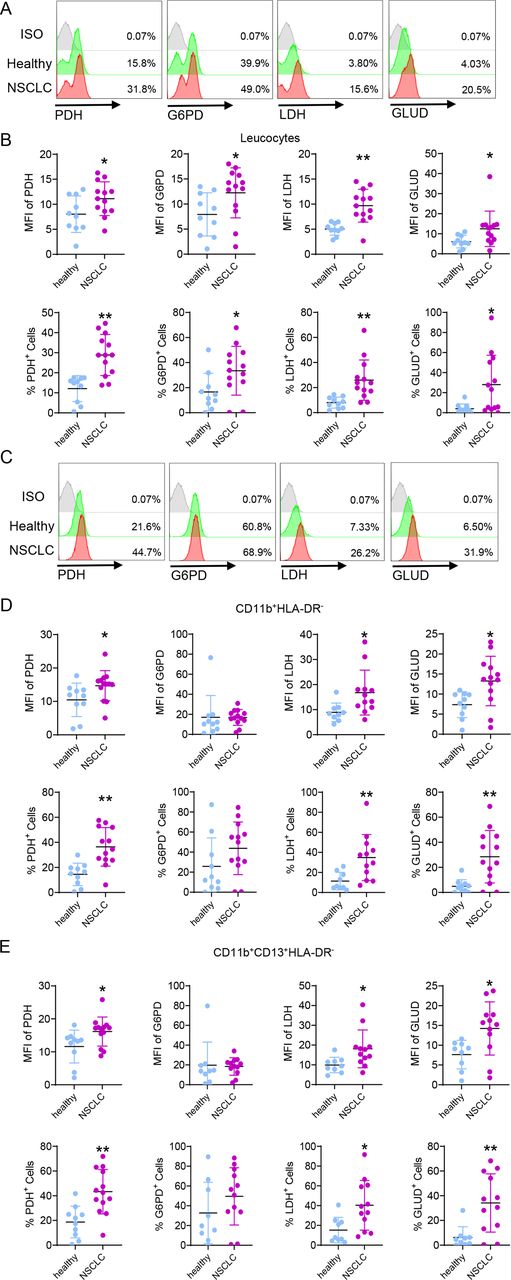
As demonstrated in mice, LAL deficiency causes MDSC expansion through metabolic reprogramming as a mechanism (figures 2 and 3). To expand this observation into the human, increased mean fluorescent intensity (MFI) and percentage of glucose metabolic enzymes PDH, G6PD, and LDH were observed in the leucocytes of patients with NSCLC versus healthy subjects (figure 6A,B). Among amino acid pathways, GLUD was also increased in the leucocytes of patients with NSCLC versus healthy subjects (figure 6A,B). Both MFI and percentages of PDH+, LDH+, and GLUD+ cells were upregulated in CD11b+HLA-DR− and CD11b+CD13+HLA-DR− myeloid subsets (figure 6C–E), except G6PD+ cells, confirming a metabolic shift towards glucose and amino acid utilization in myeloid subsets of patients with NSCLC versus healthy subjects. Therefore, metabolic enzymes serve as potential biomarkers for NSCLC diagnosis and prognosis.

Expressions of metabolic enzymes in NSCLC versus healthy subjects. (A) A representative gating strategy of PDH+, G6PD+, LDH+, and GLUD+ cells in the whole blood cells. (B) MFI and percentages of PDH+, G6PD+, LDH+, and GLUD+ cells in the leucocytes of patients with NSCLC versus healthy individuals. (C) A representative gating strategy of PDH+, G6PD+, LDH+, and GLUD+ cells in blood CD11b+HLA-DR- cells. (D) MFI and percentages of PDH+, G6PD+, LDH+, and GLUD+ cells in blood CD11b+HLA-DR- cells of patients with NSCLC versus healthy individuals. (E) MFI and percentages of PDH+, G6PD+, LDH+, and GLUD+ cells in blood CD11b+CD13+HLA-DR- cells of patients with NSCLC versus healthy individuals. Data are expressed as mean±SD; experiments were independently repeated, n=9–13. *p<0.05, **p<0.01. G6PD, glucose-6-phosphate dehydrogenase; GLUD, glutamate dehydrogenase; LDH, lactate dehydrogenase; NSCLC, non-small cell lung cancer; PDH, pyruvate dehydrogenase.
Checkpoint inhibitor treatment in patients with NSCLC
In Lal-/- mice, increased expression of PD-L1 was observed in Ly6G+ cells that function as immune suppression and tumor stimulation (figure 3I–K). Antibody-based therapeutics targeting PD-1/PD-L1 have shown clinical benefits in multiple tumor types in human.30 31 To see which myeloid subsets respond to the treatment of PD-1 checkpoint blockade, the profiles of myeloid subsets were compared in patients with NSCLC with PD-L1 TPS ≥10%. Figure 7A showed that the PD-L1 level was decreased in the leucocytes of patients with NSCLC after anti-PD-1 treatment. The percentages of CD13+ and CD14+ myeloid cells, but not CD15+, CD33+, or CD11b+HLA-DR- cells, were reduced significantly after anti-PD-1 treatment (figure 7B). Moreover, in CD11b+HLA-DR− double-gated myeloid subsets, anti-PD-1 treatment downregulated the percentages of CD11b+CD13+HLA-DR− and CD11b+CD14+HLA-DR− myeloid subsets (figure 7C). Therefore, CD13+ and CD14+ myeloid subsets responded to the anti-PD-1 treatment in patients with NSCLC. When metabolic enzymes were examined in myeloid subsets, expression of PDH, G6PD, LDH, and GLUD were all decreased in the leucocytes of patients with NSCLC versus healthy subjects after treatment (figure 7D). With limited patients available, the CD13+ myeloid subset was chosen for further analysis. In CD11b+HLA-DR− and CD11b+CD13+HLA-DR− myeloid subsets, the MFI of PDH expression was downregulated while others were inconclusive after anti-PD-1 treatment (figure 7E,F). PDH in blood myeloid cells can be used as a potential biomarker for diagnosis and prognosis of NSCLC. The clinical outcomes of this trial cohort showed seven patients with partial responses (tumor shrunk for some period), two patients with stable condition (tumor neither grew nor shrunk), while one patient with progression after two cycles of anti-PD-1 treatment.

Checkpoint inhibitor treatment. (A) Statistical analysis of percentages of PD-L1+ cells in leucocytes of patients with NSCLC before versus after treatment. (B) Statistical analysis of percentages of CD11b+HLA-DR-, CD13+, CD14+, CD15+, and CD33+ cells in the leucocytes of patients with NSCLC before versus after treatment. (C) Statistical analysis of percentages of CD13+, CD14+, CD15+, and CD33+ cells in CD11b+HLA-DR- cells of patients with NSCLC before versus after treatment. (D) MFI of PDH+, G6PD+, LDH+, and GLUD+ cells in the leucocytes of patients with NSCLC before versus after treatment. (E) MFI of PDH+, G6PD+, LDH+, and GLUD+ cells in blood CD11b+HLA-DR- cells of patients with NSCLC before versus after treatment. (F) MFI of PDH+, G6PD+, LDH+, and GLUD+ cells in blood CD11b+CD13+HLA-DR- cells of patients with NSCLC before versus after treatment. Data are expressed as mean±SD; experiments were independently repeated, n=5–9. *p<0.05, **p<0.01. G6PD, glucose-6-phosphate dehydrogenase; GLUD, glutamate dehydrogenase; LDH, lactate dehydrogenase; NSCLC, non-small cell lung cancer; PD-L1, programmed death ligand-1; PDH, pyruvate dehydrogenase.
Discussion
MDSCs are well known for their ability to directly stimulate tumor cell proliferation/progression and suppress antitumor immunity and are closely associated with poor clinical outcomes in cancer. Therefore, MDSCs serve as targets of anticancer immunotherapy. Effective therapies can aim at targeting MDSCs by blocking their differentiation, inhibiting their migration to the affected tissues, or by manipulating the tissue microenvironment.4 LAL has been reported to play a critical role in controlling the differentiation, migration, and functions of MDSCs.10 32 LAL-D induced MDSC expansion from hematopoietic progenitors in the bone marrow, alteration of endothelial permeability, infiltration into multiple organs, suppression of T-cell proliferation and function, and stimulation of tumor growth and invasion.12 13 15 26
As MDSCs are a heterogeneous population that share surface markers with conventional myeloid cell populations, it is necessary to depict and characterize intrinsic differences and features at the molecular level to better define MDSCs. The powerful tools such as scRNA-seq will provide more comprehensive insights into phenotypic, morphological, and functional heterogeneity of MDSCs. In the present study using the Lal-/- mouse model, the scRNA-seq approach identified multiple clusters which can be grouped into two major cellular clusters by tSNE clustering analysis (cluster 123 and cluster 0468) of bone marrow Ly6G+ cells, which are the origin of MDSCs. Compared with Lal+/+ Ly6G+ cells, Lal-/- Ly6G+ cells showed increased cellular number in cluster 123 and decreased cellular number in cluster 0468 (figure 1B). Differential gene expression further defined characteristics and differences between these two clusters of Lal-/- Ly6G+ cells versus Lal+/+ Ly6G+ cells (figure 1C–E and online supplemental tables 2–7). Interestingly, expression of genes involved in glycolysis, citrate cycle, and ROS response was significantly increased in cluster 123 and decreased in cluster 0468 of Lal-/- Ly6G+ cells (figure 2A–C). After exiting the bone marrow, CD11b+Ly6G+ myeloid progenitor cells (account for 40%–50% bone marrow progenitor cells in wild-type mice) differentiate into professional immune cells in the blood and distal organs, such as dendritic cells, macrophages, and neutrophils. We have recently reported that CD11c+ (surface marker for dendritic cells) myeloid cells in the Lal-/- blood inherit this two-cluster trait with distinctive gene expression patterns versus Lal+/+ mice by scRNA-seq. Similar to bone marrow Lal-/- Ly6G+ cells, blood Lal-/- CD11c+ cells possess strong T-cell suppression and tumor stimulation through metabolic reprogramming.25
Metabolic regulation is important for myeloid differentiation and function.33–37 MDSCs sense the environmental change and respond by selecting the most efficient metabolic pathways to sustain their suppressive and protumorigenic functions.5 During LAL-D, which causes the absence of the regular energy supply of fatty acids, cells inevitably use alternative energy consumption pathways to fuel oxidative phosphorylation (OXPHOS). This metabolic switch was first observed by transcriptome microarray analysis of Lal-/- Ly6G+ cells, in which gene expression of metabolic enzymes in glycolysis, anaerobic glycolysis, pentose phosphate pathway, and citric acid cycle was all increased.38 These observations were further confirmed by western blot analysis with the increased protein levels of several key enzymes for glucose downstream metabolism (HK1, HK2, HK3, PDH, G6PD, LDH) and GLUD (figure 2D), which were accompanied with the increased levels of glucose, pyruvate, and α-ketoglutarate in Lal-/- Ly6G+ cells (figure 2E). tSNE clustering of the scRNA-seq showed a major shift of gene upregulation from 0468 cluster to 123 cluster in glycolysis and the citrate cycle in Lal-/- Ly6G+ cells versus Lal+/+ Ly6G+ cells (figure 2A,B). Importantly, blood Lal-/- CD11c+ cells showed the similar characteristic of metabolic reprogramming.25 Inhibition of PDH, a key enzyme linking glycolysis and the TCA cycle, by the pharmacological inhibitor CPI-613 or PDH siRNA not only reduced the population of Lal-/- Ly6G+ cells and their ROS production (figure 3A,B) but also reversed their capabilities in suppression of T cells and stimulation of tumor cell proliferation and growth (figure 3C–H). Taken together, these results suggest that Lal-/- Ly6G+ cells experienced a metabolic switch to overuse glucose and amino acids as their energy source.
Since LAL-D and MDSCs formulate a protumor microenvironment, it would be intriguing to use them as biomarkers for NSCLC diagnosis and prognosis. As we reported recently, LAL expression was downregulated in multiple forms of human cancers by data mining of the TCGA database.25 There is an advantage in using blood samples versus the tumor tissue without going through a biopsy. Here in the blood samples of patients with NSCLC, the LAL level was downregulated in all MDSC subsets, including CD13+, CD14+, CD15+, CD33+, CD11b+CD13+HLA-DR−, CD11b+CD14+HLA-DR−, CD11b+CD15+HLA-DR−, and CD11b+CD33+HLA-DR− myeloid cells by flow cytometry analysis (figure 4A–C), which were associated with increased populations of CD11b+HLA-DR−, CD13+, CD14+, CD15+, CD11b+CD13+HLA-DR−, CD11b+CD14+HLA-DR−, and CD11b+CD15+HLA-DR− myeloid subsets (figure 5A–D). Furthermore, the inhibition of LAL activity in the blood cells of healthy subjects increased the percentages of CD11b+CD13+HLA-DR− and CD11b+CD14+HLA-DR− subsets (figure 5E), suggesting that LAL protects antitumor immunity by blocking the formation of unwanted myeloid populations. Therefore, the decreased LAL level serves as an attractive immune biomarker for cancer prediction and therapy. Our study is consistent with an observation that circulating human MDSC subsets have a differential expansion with more PMN-MDSC than M-MDSC.39 In the tumor microenvironment, the tumor cells and their surrounding immune cells reprogram to sustain a high-energy demand. As demonstrated in figures 2 and 3, increased glycolysis is a feature of MDSCs in mice. We tested if metabolic enzymes in myeloid subsets can be used as biomarkers for NSCLC prediction. Indeed, the expression of PDH+, LDH+ and GLUD+ cells was upregulated in CD11b+HLA-DR− and CD11b+CD13+HLA-DR− myeloid subsets in the blood of patients with NSCLC (figure 6C–E).
Immune checkpoint inhibitors targeting PD-1/PD-L1 have substantially improved the outcomes of patients with many types of cancer.40 Nevertheless, even in tumor types for which PD-1/PD-L1 blockade is now an approved therapy such as NSCLC, only a fraction of patients show objective clinical responses.41 Therefore, PD-1/PD-L1 immunotherapy has its limit and is only effective in certain patients. It is critical to find prognosis biomarkers to assess the treatment. In the present study, anti-PD-1 treatment in patients with NSCLC with positive PD-L1 TPS not only reduced the percentages of CD11b+CD13+HLA-DR− and CD11b+CD14+HLA-DR− MDSC subsets in the blood (figure 7C) but also downregulated PDH levels in CD11b+CD13+HLA-DR− MDSC subsets (figure 7F). This observation provides a potential approach to predict the effectiveness of PD-1/PD-L1 immunotherapy.
Taken together, as blocking MDSCs in the tumor microenvironment enhances the efficacy of antitumor immunity, two conclusions can be drawn from the current studies: (1) enhancing the LAL activity and blocking the metabolic enzyme activities in MDSCs provide new targets to effectively block MDSC development and functions as a single immunotherapy or in combination with checkpoint inhibitor therapy and (2) expression of LAL and metabolic enzymes in myeloid cells, and expansion of pathogenic myeloid cells can serve as authentic biomarkers for diagnosis and prognosis in patients with NSCLC.
Data availability statement
All data relevant to the study are included in the article or uploaded as supplementary information.
Ethics approval
This study involves human participants and was approved by Institutional Biosafety Committee of Indiana University School of Medicine (reference no: 1908650279). Participants gave informed consent to participate in the study before taking part.
References
Supplementary materials
Supplementary Data
This web only file has been produced by the BMJ Publishing Group from an electronic file supplied by the author(s) and has not been edited for content.
Footnotes
Twitter @tzhao0401, @xinchun
Contributors TZ performed experiments, analyzed the data, and wrote the manuscript. JW and SL analyzed and interpreted the scRNA-seq data. NHH and SJ provided the human NSCLC blood samples and designed clinical protocols. XD performed western blot. HD and CY designed experiments, analyzed and interpreted the data, and wrote the manuscript. CY is responsible for the overall content as the guarantor.
Funding This work was supported by NIH Grant CA225108 (CY and HD). The human samples from healthy subjects were made possible with support by the Indiana Biobank and the Indiana Clinical and Translational Sciences Institute, funded in part by UL1TR002529 from the National Institutes of Health, National Center for Advancing Translational Sciences, and Clinical and Translational Sciences Award. The bioinformatics analysis and Flow Cytometry Facility were supported by IU Simon Comprehensive Cancer Center, funded in part by NCI Grant P30CA082709.
Competing interests None declared.
Provenance and peer review Not commissioned; externally peer reviewed.
Supplemental material This content has been supplied by the author(s). It has not been vetted by BMJ Publishing Group Limited (BMJ) and may not have been peer-reviewed. Any opinions or recommendations discussed are solely those of the author(s) and are not endorsed by BMJ. BMJ disclaims all liability and responsibility arising from any reliance placed on the content. Where the content includes any translated material, BMJ does not warrant the accuracy and reliability of the translations (including but not limited to local regulations, clinical guidelines, terminology, drug names and drug dosages), and is not responsible for any error and/or omissions arising from translation and adaptation or otherwise.