Article Text

Abstract
Allogeneic hematopoietic stem cell transplantation (allo-HSCT) represents the only curative treatment option for a number of hemato-oncological disorders. In fact, allo-HSCT is considered as one of the most successful immunotherapies as its clinical efficacy is based on the donor T-cells’ capacity to control residual disease. This process is known as the graft-versus-leukemia (GvL) reaction. However, alloreactive T-cells can also recognize the host as foreign and trigger a systemic potentially life-threatening inflammatory disorder termed graft-versus-host disease (GvHD). A better understanding of the underlying mechanisms that lead to GvHD or disease relapse could help us to improve efficacy and safety of allo-HSCT. In recent years, extracellular vesicles (EVs) have emerged as critical components of intercellular crosstalk. Cancer-associated EVs that express the immune checkpoint molecule programmed death-ligand 1 (PD-L1) can suppress T-cell responses and thus contribute to immune escape. At the same time, it has been observed that inflammation triggers PD-L1 expression as part of a negative feedback network.
Here, we investigated whether circulating EVs following allo-HSCT express PD-L1 and tested their efficacy to suppress the ability of (autologous) T-cells to effectively target AML blasts. Finally, we assessed the link between PD-L1 levels on EVs to (T-)cell reconstitution, GvHD, and disease relapse.
We were able to detect PD-L1+ EVs that reached a peak PD-L1 expression at 6 weeks post allo-HSCT. Development of acute GvHD was linked to the emergence of PD-L1high EVs following allo-HSCT. Moreover, PD-L1 levels correlated positively with GvHD grade and declined (only) on successful therapeutic intervention. T-cell-inhibitory capacity was higher in PD-L1high EVs as compared with their PD-L1low counterparts and could be antagonized using PD-L1/PD-1 blocking antibodies. Abundance of T-cell-suppressive PD-L1high EVs appears to also impact GvL efficacy as patients were at higher risk for relapse. Finally, patients of PD-L1high cohort displayed a reduced overall survival.Taken together, we show that PD-L1-expressing EVs are present following allo-HSCT. PD-L1 levels on EVs correlate with their ability to suppress T-cells and the occurrence of GvHD. The latter observation may indicate a negative feedback mechanism to control inflammatory (GvHD) activity. This intrinsic immunosuppression could subsequently promote disease relapse.
- Transplantation Immunology
- Immune Evation
- T-Lymphocytes
Data availability statement
Data are available on reasonable request.
This is an open access article distributed in accordance with the Creative Commons Attribution Non Commercial (CC BY-NC 4.0) license, which permits others to distribute, remix, adapt, build upon this work non-commercially, and license their derivative works on different terms, provided the original work is properly cited, appropriate credit is given, any changes made indicated, and the use is non-commercial. See http://creativecommons.org/licenses/by-nc/4.0/.
Statistics from Altmetric.com
Introduction
Allogeneic hematopoietic stem cell transplantation (allo-HSCT) represents the only curative treatment option for a number of hematological malignancies. The therapeutic principle is based on the donors’ T-cells ability to recognize and to eliminate residual malignant cells, which is termed graft-versus-leukemia (GvL) reaction.1 However, the same alloreactive T-cells can target the host’s healthy tissue especially skin, liver, and intestine that results in potentially life-threatening graft-versus-host disease (GvHD).2 Separating the GvL effect from GvHD is a long-sought-after goal. GvHD and GvL are both regulated by multiple factors including immunoregulatory cells (eg, myeloid-derived suppressor cells, regulatory and T-cells or B-cells), antigen presenting cells, and immune checkpoints such as the well-known programmed death ligand 1 (PD-L1)/programmed death-1 (PD-1) axis.1 Binding of PD-L1 to its cognate receptor PD-1 on T-cells leads to T-cell exhaustion and apoptosis.3
In fact, there are several preclinical studies and also case series demonstrating the successful use of PD-1/PD-L1 blockade can foster GvL efficacy while PD-L1 can ameliorate murine GvHD.4–6 At the same time several systemic factors in cancer patients have been reported to impact response toward PD-1/PD-L1 blockade. Extracellular vesicles (EVs) that express PD-L1 on their surface represent one of such factors as recently shown in melanoma, lung, and prostate cancer by directly suppressing T cell activation and/or sequestering anti-PD-L1 antibodies.7 Circulating EVs are small particles with a bilayered lipid membrane. According to their size, EVs are divided into exosomes (30–150 nm) and larger microvesicles (50–1000 nm). Virtually all cell types can release EVs that carry bioactive biomolecules (eg, chemokines, cytokines, mRNA, and receptor ligands) from their parent cells being important facilitators of intercellular communication.8 In fact, their biological effects depend on their cargo, so they can have both activating and inhibitory effects on immune responses as detailed in a recent review.9
In this study, we investigated expression of PD-L1 on patient-derived circulating EVs following allo-HSCT (n=39 patients) to determine whether PD-L1+ possess T-inhibitory properties and whether their presence is associated with GvHD or immune escape.
Material and methods
Patient material
Patient samples were retrieved at day +30, +45, +60, +75, +90, and +120 following allo-HSCT.
Cell lines
The AML cell lines MOLM-13 and OCI-AML were acquired from DSMZ (Braunschweig, Germany) and Jurkat T-cells (Clone E6-1) from ATCC (Manassas, Virginia, USA). Venor GeM Classic Mycoplasma Detection Kit (Minerva Biolabs, Berlin, Germany) was used to regularly check for Mycoplasma contamination. It was used according to the manufacturer’s instructions.
Particle quantification
Purified EVs were diluted 1:1000. Particles were quantified using the commercially available ZetaView particle tracker from ParticleMetrix (Inning, Germany).
ELISA
PD-L1 expression on EVs was quantified using a sandwich ELISA (Abcam, Cambridge, UK). Briefly, EV samples (50 µL) containing 40 µg protein/mL were incubated for 1 hour with 50 µL of an antibody mix (ie, capture and detection antibodies). After the addition of a TMB reagent followed by a stop solution 20 min later, optical density was measured at 450 nm.
T-cell isolation
Peripheral blood mononuclear cells (PBMCs) were isolated using Ficoll-Paque (GE Healthcare, Braunschweig, Germany). MACS Pan T-cell Isolation Kit (Miltenyi Biotec, Bergisch-Gladbach, Germany) was used according to the manufacturer’s instructions purify CD3+ T-cells.
FACS staining
After isolation EVs were lysed using 50 µL RIPA buffer (Sigma Aldrich, St. Louis, Missouri, USA) per 100 µL EVs, containing the Halt Protease/Phosphatase Inhibitor Single-Use Cocktail (Thermo Fisher Scientific, Waltham, Massachusetts, USA). Following 15 min incubation and centrifugation, the protein-containing supernatant was collected. A 20 µg protein lysate was incubated with 10 µL of 4 µm aldehyde/sulfate latex beads (Thermo Fischer Scientific) for 15 min at room temperature and subsequently rotated at 4°C overnight. The reaction was stopped by adding 1 mol/L glycine. After several washing steps, EV preparations were stained by adding conjugated antibodies for 30 min at 4°C.
For cell stainings viability was assessed using the Aqua Fixable Viability Kit (BioLegend, San Diego, California, USA). After incubation with an Fc receptor Blocking reagent (BioLegend), cells were stained with fluorochrome-coupled antibodies at 4°C. For intracellular cytokine detection, the first staining step was followed by fixation with BD Cytofix and permeabilization with BD PermWash (both BD Biosciences, Heidelberg, Germany) before fluorochrome-coupled antibodies were added for 30 min at room temperature. Measurements were performed on a BD FACSCanto II Cytometer (BD Biosciences) and FlowJo V.10 Software (FlowJo, Asland, Oregon, USA) was used. All antibodies are listed in online supplemental table 1.
Supplemental material
t-SNE analysis
Analysis was performed for downscaled (3.000 events/sample) PBMCs of patient samples collected on time point 2 (day 45) using the build-in function of FlowJo V.10 software (FlowJo). 11 PD-L1hi and 11 PD-L1lo patient/HD pairs were chosen based on gate conformities. Two separate staining panels (panel 1: CD3, CD4, CD8, CPT1a, HK2; panel 2: CD3, CD4, CD8, CD69, CD137) were analyzed using the opt-SNE toolkit for t-SNE (t-distributed Stochastic Neighbor Embedding) parameter selection which allows a nonlinear dimensionality reduction as previously described.10
T-cell activation assay
T-cells were cultured in 96-well UpCell Plates (Thermo Fisher Scientific) in RPMI1640 Medium (+ 10% ultracentrifuged FCS, + 2 mM L-glutamine, + 40 U/mL Penicillin/Streptomycin) (Thermo Fisher Scientific). FCS ultracentrifugation was performed to remove contaminating EVs. In indicated experiments, 300,000 T-cells were treated with 5 µg EVs. Prior to cytokine staining T-cells were stimulated with plate-bound CD3 (Invitrogen, Waltham, Massachusetts, USA), soluble CD28 (BioLegend),±EVs for 24 hours, and subsequently, treated with Ionomycin (Sigma Aldrich), PMA (Sigma Aldrich), and Golgi Plug (BD Bioscience) for additional 4 hours.
Calcein release assay
Calcein-AM was obtained from Invitrogen (Thermo Fisher). Freshly isolated T-cells were cultured at a final concentration of 1,5×10⁶ cells/mL and stimulated for 24 hours with anti-CD3/-CD28 beads ±5 µg EVs in a 96-well plate. On the following day 2,5×10⁶ MOLM-13 or OCI-AML, cells were resuspended in 1 mL 15 µM calcein-AM for 1 hour at 37°C. After two washing steps, AML cells were co-cultured in a 1:7 ratio with pretreated T-cells for 3 hours at 37°C in 5% CO2. A 75 µL of each supernatant was collected and transferred into black grounded plates. Samples were measured using 485 nm excitation and 535 nm band-pass filter. AML cell lysis was calculated according to the following formula: [(test release − spontaneous release)/(maximum release − spontaneous release)].
Incucyte assay
A total of 100,000 freshly isolated T-cells were cultured in a 96 well plate in presence of CD3/CD28 activation beads ±5 µg EVs per well. MOLM-13 or OCI-AML cells were labeled with PKH67 (Merck, Darmstadt, Germany) and co-incubated with the T-cells in a 1:2 ratio. Prior to live-cell analysis 100 µL of cytotox red (Sartorius, Göttingen, Germany) was added. Photomicrographs were taken every 30–60 min using an Incuyte SX1 Live-Cell Analysis System (Essen Biosciences, Royston, UK) over 72 hours. Dead AML cells were identified as cytotox red+/PKH67+.
Statistical analysis
Data were analyzed with GraphPad Prism V.9 (Graphpad, San Diego, California, USA). Differences in means were evaluated with two-tailed parametric (t-test) or non-parametric (Mann-Whitney U) tests based on the distribution levels as determined using the Shapiro-Wilk test. Comparisons of more than two groups were performed using a one-way analysis of variance test. The significance level was set at p<0.05.
Additional information can be found in online supplemental data.
Results
First, we were successful in isolating EVs from the peripheral blood of allo-HSCT patients as confirmed by transmission electron microscopy, expression of the prototypical EV marker CD63, and size analysis (figure 1A, online supplemental figure1A,B). When semiquantifying PD-L1 expression on the EVs of 39 patients during day +30 to +120 after allo-HSCT we noticed an overall peak expression around day +45. Moreover, PD-L1 EV levels were significantly higher in patients that developed GvHD (figure 1C). Interestingly, PD-L1 expression on EVs was already elevated 3–30 days before the clinical manifestation of acute GvHD (figure 1D). Patients with acute GvHD that responded toward anti-inflammatory therapy showed a reduction of PD-L1 on EVs as opposed to non-responders (figure 1E). Grade of acute GvHD was also positively correlating with PD-L1 expression further supporting the link between GvHD and EV PD-L1 (figure 1F). A correlation between PD-L1 EV levels and site of GvHD (ie, skin, intestine, and liver) could not be established in this admittedly small patient cohort (online supplemental figure 1C). Next, we divided our cohort based on the PD-L1 median fluorescence index (MFI) at day+ 45 as the time point of peak PD-L1 expression into an EV-PD-L1lo (<median) and an EV-PD-L1hi (>median) group. Assignment to either group was not associated with the patients’ clinical characteristics (table 1).
Univariate analysis of variables affecting PD-L1 levels on EVs

Circulating EVs in allo-HSCT patients express PD-L1. (A) Isolated plasma EVs from the allo-HSCT patients with typical size and morphology in transmission electron microscopy (TEM). Tetraspanin CD63 expression by EVs was confirmed via Western blot. (B) Total PD-L1 levels of EVs in patients after allo-HSCT (n=39) as assessed by FACS at six time points and based on the median fluorescence intensity (MFI). (C) PD-L1 levels as assessed by FACS (=surface PD-L1) and ELISA (=total PD-L1) in allo-HSCT patients with/without acute GvHD (aGvHD) and healthy donors (HD). (D) PD-L1 levels of EVs isolated from allo-HSCT patients without aGvHD (no GvHD), (30–3 days) prior clinical onset of aGvHD (pre-aGvHD), and after aGvHD manifestation. (E) Changes of PD-L1 MFI in EVs of aGvHD patients with response/no response toward immunosuppressive treatment (F) PD-L1 MFI of EVs was correlated with the clinical aGvHD grade. (G) Kaplan-Meier analysis of aGvHD-free survival of allo-HSCT patients in relation to EV-PD-L1 level. Categorization into PD-L1hi patients (n=16, >median) and into PD-L1lo patients (n=16, <median) is based on PD-L1 MFI at day 45. ‘r’ represents the Spearman’s rank correlation coefficient, ‘n’ indicates the sample number; bars represent the SE of the mean; *p<0.05, **p<0.01, ***p<0.001. EVs, extracellular vesicles; GvHD, graft-versus-host isease; dHSCT, hematopoietic stem cell transplantation.
However, when assessing development of GvHD we noticed a significantly (p=0.026) superior GvHD-free in survival of the EV-PD-L1lo group (figure 1G). Based on the known effects of PD-L1/PD-1 interaction on proliferation, differentiation, and phenotype of lymphocytes, key cells for GvHD and GvL reaction, we next focused on reconstitution, composition, and phenotype of especially T-cells and NK-cells following allo-HSCT. At the time of dichotomization, the number of lymphocytes and monocytes did not differ between both groups. However, neutrophil count was higher in the EV-PD-L1hi group (figure 2A). The proportion of CD3+ T-cells among lymphocytes was higher (p=0.0257) and of CD56+ NK-cells (p=0.023) lower (figure 2B). In terms of T-cell differentiation, only the fraction of CD8+ T-cells was increased (p=0.0139) and of terminally differentiated effector (CCR7-CD45RO-) T-cells decreased (p=0.0460). The proportion of proliferating T-cells did not differ (figure 2C, online supplemental figure 2A). The ratio of CD56br(ight)/CD56dim NK-cells was skewed toward the CD56br population in the EV-PD-L1lo group (figure 2D, online supplemental figure 2B). T-cell metabolism plays an important role in GvHD and GvL, therefore we performed an unsupervised approach and analyzed our data with t-distributed stochastic neighbor embedding (t-SNE). T-cells from patient samples at day+45 (EV-PD-L1hi group (n=22) and EV-PD-L1lo group (n=11)) as well as healthy donors (HD, n=11) were analyzed. The events of the three groups clustered in different areas and when evaluating areas of high density (=rectangles), levels of CPT1a and HK-2 expression, that represent the rate-limiting enzymes of fatty acid oxidation and glycolysis, respectively, were lower in T-cells from the EV-PD-L1hi as compared with the EV-PD-L1lo group (figure 2E). Similar analyses regarding the T-cells’ activation status based on CD69 and CD137 expression revealed as anticipated an increased activation in allo-HSCT patients as compared with HD but no differences between the EV-PD-L1hi and EV-PD-L1lo cohort (online supplemental figure 2C). A central component for the antileukemic effects of T-cells is their effector function (ie, cytokine production and cytotoxicity). To initially test the EVs’ inhibitory capacity, we stimulated Jurkat T-cells in presence or absence of PD-L1hi or PD-L1lo EVs. Inhibitory capacity in terms of suppressing IL-2 and IFN-γ production was stronger for EV-PD-L1hi (online supplemental figure 3A). We confirmed those findings for primary CD4+ and CD8+ T-cells (online supplemental figure 3B). Since we found that PD-L1 expression is associated with occurrence of GvHD, we next assessed the T-cell inhibitory potential of EVs from patients with and without GvHD. As anticipated, inhibitory capacity was stronger for GvHD patient-derived EVs (figure 3A). However, PD-1/PD-L1-blockade significantly improved IL-2 and IFN-γ production (online supplemental figure 3C). This functional impairment was also associated with decreased ability of T-cells to eliminate AML-cells, as we could confirm with cell lysis- but also live imaging-based assays (figure 3B,C, online supplemental figure 3D). As mentioned previously the ability of T-cells’ to target residual AML-cells is the basis of GvL reaction. Therefore, we next investigated whether PD-L1 EV levels at day+45 are not only a determinant for GvHD occurrence but also progression-free survival (PFS). In fact, PFS was significantly shorter for the EV-PD-L1hi group (figure 3D). Fittingly, we found that PD-L1 expression was significantly (p=0.0004) elevated on EVs isolated from allo-HSCT patients with AML relapse (figure 3E), which is also in line with the observation of that non-responding GvHD patients (with stable PD-L1 levels) had a higher relapse rate (5/11) as compared with responding (1/8, with declining PD-L1 levels) of figure 1E. Analysis of the composite endpoint GVHD-free/relapse-free survival11 confirmed the less favorable outcome of the EV-PD-L1hi group (online supplemental figure 3E). Since GvHD and GvL represent the major causes for transplantation-related mortality, the increased PD-L1 expression on EVs consequently was associated with shorter overall survival (figure 3F).

Association of EV PD-L1 levels with reconstituting immune cells. (A) Absolute lymphocyte, monocyte, and neutrophil count as measured in EV-PD-L1hi (n=15) and EV-PD-L1lo (n=12) allo-HSCT patients at day 45. (B) Frequencies of CD3+ T-cells and CD56+ NK-cells were assessed by FACS in EV-PD-L1hi (n=15) and EV-PD-L1lo (n=12) allo-HSCT patients. (C) T-cells were categorized in CD4+, CD8+, CCR7+CD45RO− naïve (TN), CCR7+CD45RO+ central memory (TCM), CCR7−CD45RO+ effector memory (TEM), CCR7−CD45RO− terminally differentiated effector (TTE), CD25highCD127low CD4+ regulatory (TRegs), and proliferating Ki67+ T-cells in the EV-PD-L1hi and EV-PD-L1lo group. (D) Comparison of percent CD56+ -bright and -dim cells based on the EV-PD-L1 level. (E) t-SNE analysis based on CD3, CD4, CD8, CPT1a and HK2 was performed on concatenated PMBCs with subsequent gating on CD3+CD56- T-cells as shown in the upper panel. The events were then split into three density plots in line with their matching group: healthy donors (HD, black, n=22), EV-PD-L1hi (red, n=11) or EV-PD-L1lo (blue, n=11) and plotted according to the calculated variables t-SNE 1 and t-SNE 2 (middle panel). Proportions of T-cells from the HD, PD-L1hi, and PD-L1lo groups are shown as stacked bar chart (middle panel, right). Histograms of CD4, CD8, CPT1a, and HK2 from representative selected areas of each group (gate 1, 2, and 3) are reported (bottom). ‘n’ indicates the sample number; bars represent the SE of the mean; *p<0.05, **p<0.01, ***p<0.001. EV, extracellular vesicle; HSCT, hematopoietic stem cell transplantation. t-SNE is a statistical method for visualizing high-dimensional data. Each data point is assigned a location in a two-dimensional map by calculating its distance and thus its similarity to all other points and visualizing it as a cluster.
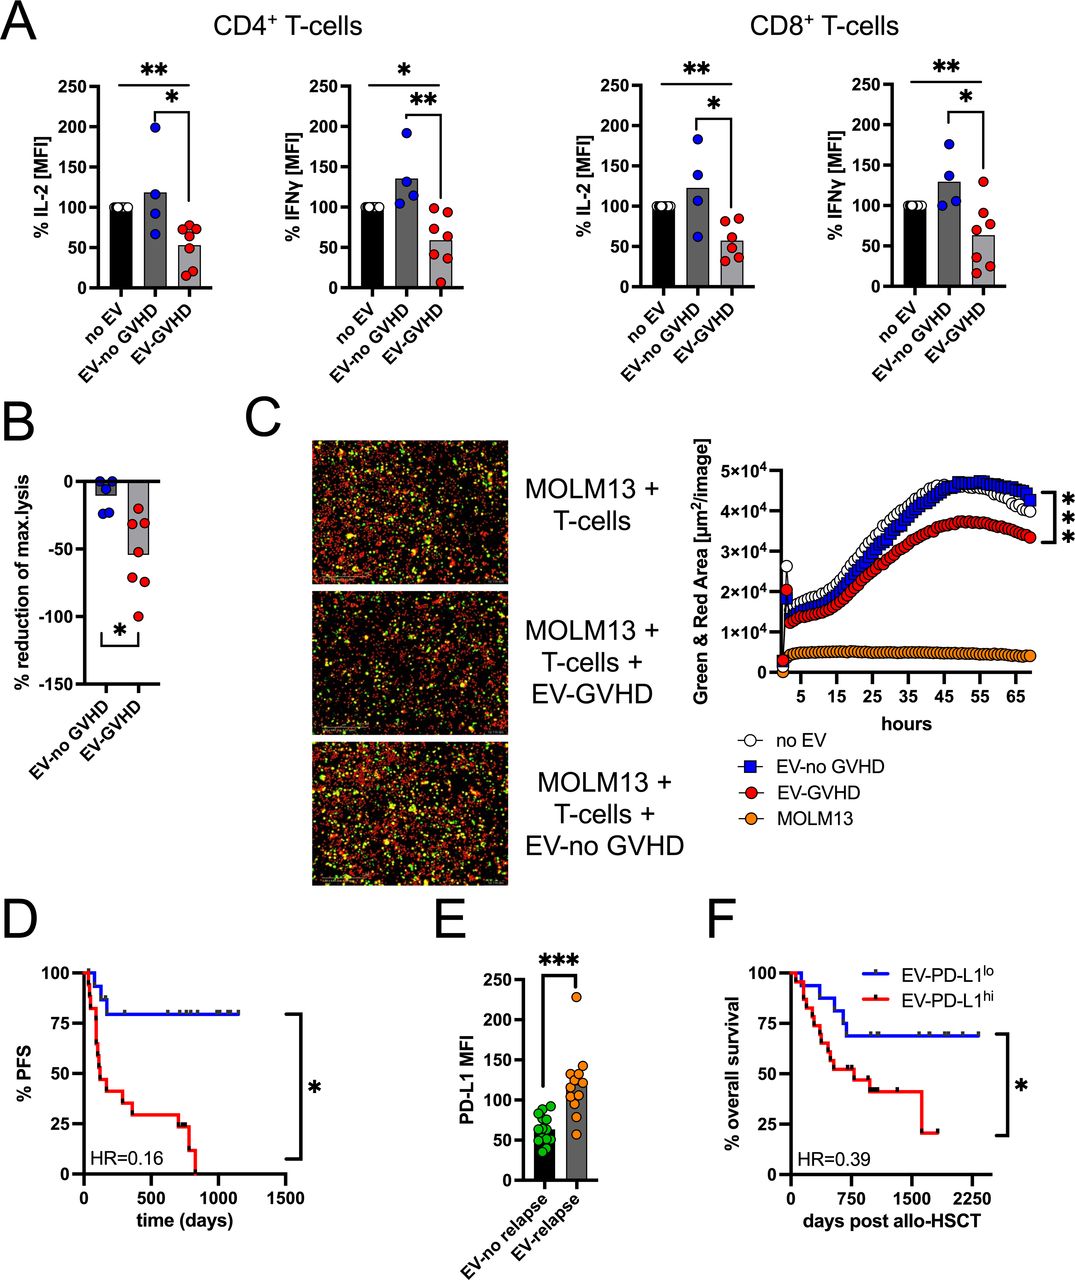
EVs from GvHD patients with T-cell-suppressive capabilities. (A) Stimulated CD4+ and CD8+ T-cells were co-incubated with/without autologous EVs that were isolated from allo-HSCT patients with (n=7) and without (n=4) aGvHD. After 48 hours, IL-2 and IFN-γ production was assessed by FACS. T-cells stimulated without EVs were set as 100%. (B) T-cells were stimulated for 48 hours, treated with/without EVs from patients with (n=8)/without (n=5) GvHD, and co-cultured with calcein-labeled MOLM-13 AML cells. Lysis of MOLM-13 was calculated based on calcein release and conditions without EVs represented the baseline. (C) Targeting of MOLM-13 AML cells by EV-pretreated CD3+ T-cells was assessed by real-time imaging using an IncuCyte Zoom device. T-cells were treated with/without EVs from patients with (n=14)/without (n=10) GvHD, and co-cultured with PKH-labeled MOLM-13 AML cells (green) in an effector to target ratio of 2:1 in presence of activating anti-CD3 and -CD28 antibodies. Dead cells are identified as cytotox (red). Total green and red area represents total MOLM-13 cell killing over time. (D) Kaplan-Meier analysis of progression-free survival (PFS) of allo-HSCT patients according to the EV-PD-L1 level. Categorization into PD-L1hi patients (n=16, >median) and into PD-L1lo patients (n=16, <median) is based on PD-L1 MFI at day 45. (E) PD-L1 expression level in EVs from allo-HSCT patients with (n=12) and without (n=14) AML relapse. (F) Kaplan-Meier analysis of PFS of allo-HSCT patients in relation to the EV-PD-L1 level. ‘n’ indicates the sample number; bars represent the SE of the mean; *p<0.05, **p<0.01, ***p<0.001. EVs, extracellular vesicles; GvHD, graft-versus-host disease; HSCT, hematopoietic stem cell transplantation.
Discussion
The PD-1/PD-L1 axis plays an important role for tumor immune escape including hematological neoplasias.3 The use of immune checkpoint blockade has heralded a new era in cancer treatment.12 Similarly, immune checkpoint blockade has been employed to harness T-cell-mediated GvL-activity following allo-HSCT.4 6 Not only tumor-associated and tumor-associated cells can carry PD-L1. In fact, recent studies in malignant disorders such as melanoma, prostate cancer, and lung cancer have shown accumulation of PD-L1+ EVs that exert immunosuppressive effects and promote tumor immune evasion.7 However, it needs to be taken into consideration that the PD-1/PD-L1 pathway is important for immune homeostasis and tolerance. Actually, proinflammatory cytokines promote PD-L1 expression as also seen in preclinical allo-HSCT models.13 In doing so, PD-L1 acts as a negative feedback mechanism to prevent uncontrolled immune reactions and its blockade can potentially aggravate GvHD.14 Beyond cancer pathobiology, PD-L1+ EVs have been shown to promote tissue repair and regeneration via T-cell suppression.15 Thus, our observation of accumulating PD-L1hi EVs in allo-HSCT patients that will develop GvHD could be explained by the fact that even subclinical T-cell alloreactivity (which later progresses to GvHD) might represent a strong enough pro-inflammatory trigger leading to increased PD-L1 levels on EVs. Self-evidently the cellular source (ie, residual malignant cells or inflamed tissue) of those EVs remains to be elucidated. In this context, it will be interesting to investigate in larger patient cohorts whether the molecular endotype underlying the malignancy also (co)determines PD-L1 expression on EVs. For example, there is already work showing that in myeloid neoplasms, disruption of p53 or the JAK2 pathway can promote PD-L1 expression.16 17 The link between PD-L1 expression and GvHD is further corroborated by the positive correlation between GvHD severity and PD-L1 MFI as well as the fact that successful GvHD treatment leads to a reduction of PD-L1 expression on EVs. The detrimental effects of PD-1/PD-L1 interaction for T-cells including induction of apoptosis are well described. They could explain the lower CD3+ T-cell count and the lower CD8+ T-cell frequencies in the EV-PD-L1hi group.5 At the same time, CD56+ NK-cells and especially the CD56bright subset are found increased. This phenomenon might be due to a stronger homeostatic proliferation of NK-cells as T-cells are suppressed by PD-L1+ EVs. Moreover, lower CD56dim NK-cell numbers (as seen in EV-PD-L1hi patients), might result from their stronger PD-1 expression (as compared with their CD56bright counterparts), which might result in increased sensitivity toward PD-L1.18 In line with previous studies, we observed an increased expression of the key enzymes for glycolysis (ie, HK2) and fatty acid oxidation (ie, CPT1a) in alloreactive T-cells.19 However, expression of both molecules was lower in EV-PD-L1hi patients, which could be attributed to a stronger PD-1/PD-L1 interaction similar the immunometabolic anergy induced by PD-L1 in monocytes.20 Lower metabolic activity in T-cells has been linked to AML relapse following allo-HSCT.21 The increased neutrophil count in the EV-PD-L1hi group could also indicate a higher inflammatory activity and could also contribute to GvHD initiation as neutrophils participate in alloantigen presentation.22 Similar to PD-L1+ EVs, we observed a PD-L1/PD-1-mediated T-cell suppression exerted by the PD-L1hi EVs, which precede GvHD. Overall, we hypothesize that the increased PD-L1 expression on EVs represents an early, intrinsic feedback mechanism in the sense of a natural immunosuppressant. In this context, PD-L1+ EVs act as a double-edged sword, as they simultaneously increase the risk of relapse through their inhibitory effect on T-cells (figure 4).

Immunoregulatory function of PD-L1+ extracellular vesicles (EVs) in allo-HSCT. HSCT, hematopoietic stem cell transplantation.
In conclusion, we demonstrated that strong expression of PD-L1 on EVs early after allo-HSCT is associated with the occurrence of GvHD. At the same time, these bioactive EVs appear to substantially attenuate GvL efficacy. Thus, monitoring of PD-L1 EVs could help to identify high-risk patients early. Timely and successful prophylactic intervention could have a positive impact on GvHD, thus leading to a reduction of PD-L1 levels on EVs and possibly improving GvL activity. This hypothesis now needs to be tested in larger, multicenter, prospective studies.
Data availability statement
Data are available on reasonable request.
Ethics statements
Patient consent for publication
Ethics approval
Peripheral blood was collected on approval by the ethics committee of the University Hospital of Erlangen (approval number: 219_14B, 138_17B) and the patients’ written informed consent. Participants gave informed consent to participate in the study before taking part.
Acknowledgments
We are grateful to the patients, their families, and referring physicians who made this study possible. We thank the Core Unit Cell Sorting and Immunomonitoring Erlangen for its excellent technical assistance.
References
Supplementary materials
Supplementary Data
This web only file has been produced by the BMJ Publishing Group from an electronic file supplied by the author(s) and has not been edited for content.
Footnotes
Twitter @Martin_MetabIO
Contributors RB, FK, RB-L, AS. AG, CF, HB, US-S and MB performed research, analyzed data, and helped writing the manuscript. SV provided material. DMS, TF, RJ and AM analyzed data, provided material, and helped writing the manuscript. DM designed the study, analyzed data, and wrote the manuscript.
Funding SV and AM were supported by the 'Deutsche José Carreras Leukämie-Stiftung' (02 R/2021). RB, FK, SV, HB, RJ, AM, and DM were funded by the Deutsche Forschungsgemeinschaft (DFG, German Research Foundation)-Project-ID 324392634-TRR 221. DM was funded by the DFG-Project-ID 404074532.
Competing interests None declared.
Provenance and peer review Not commissioned; externally peer reviewed.
Supplemental material This content has been supplied by the author(s). It has not been vetted by BMJ Publishing Group Limited (BMJ) and may not have been peer-reviewed. Any opinions or recommendations discussed are solely those of the author(s) and are not endorsed by BMJ. BMJ disclaims all liability and responsibility arising from any reliance placed on the content. Where the content includes any translated material, BMJ does not warrant the accuracy and reliability of the translations (including but not limited to local regulations, clinical guidelines, terminology, drug names and drug dosages), and is not responsible for any error and/or omissions arising from translation and adaptation or otherwise.