Article Text

Abstract
Background Immune checkpoint blockade (ICB) treatment may induce durable disease remission, but only in a minority of patients with cancer. One important question is how to identify patients who may benefit from ICB treatment. ICB treatment relies on unleashing patients’ pre-existing immune responses. Focusing on the key components of immune response, this study proposes the neutrophil-to-lymphocyte ratio (NLR) as a simplified indicator of patients’ immune status to predict ICB treatment outcomes.
Methods This study analyzed a large pan-cancer cohort of 16 cancer types, including 1714 patients with cancer who received ICB treatment. Clinical outcomes in response to ICB treatment were measured by overall survival (OS), progression-free survival (PFS), objective response rate, and clinical benefit rate. The non-linear relationships of NLR with OS and PFS were investigated by a spline-based multivariate Cox regression model. A total of 1000 randomly resampled cohorts were bootstrapped to estimate the variability and reproducibility of NLR-related ICB responses.
Results By interrogating a clinically representative cohort, this study revealed a previously unreported finding that the pretreatment NLR levels were associated with ICB treatment outcomes in a U-shaped dose-dependent manner rather than a linear manner. An NLR range between 2.0 and 3.0 was remarkably associated with optimal ICB treatment outcomes, including increased patient survival, delayed disease progression, improved treatment response, and significant clinical benefit. Comparatively, either decreasing (< 2.0) or increasing (>3.0) NLR levels were indicators of worse ICB treatment outcomes. Furthermore, this study presents a comprehensive landscape of NLR-related ICB treatment outcomes across different patient populations defined by demographics, baseline characteristics, treatment, cancer-type-specific ICB responsiveness, and individual cancer type.
Conclusions The NLR range from 2.0 to 3.0 might indicate an optimal balance between innate (neutrophils) and adaptive (lymphocytes) immune responses that potentiates antitumor immunity, which was observed in only 18.6% of patients. A majority of patients showed decreasing NLR (<2.00; 10.9% patients) or increasing NLR (>3.00; 70.5% patients), representing two distinct types of immune dysregulation associated with ICB resistance. This study translates routine blood tests into a precision medicine-based approach to immunotherapy, with important implications for clinicians in clinical decision-making as well as for regulatory agencies in drug approvals.
- inflammation
- immunotherapy
- immune checkpoint inhibitors
Data availability statement
No data are available.
This is an open access article distributed in accordance with the Creative Commons Attribution Non Commercial (CC BY-NC 4.0) license, which permits others to distribute, remix, adapt, build upon this work non-commercially, and license their derivative works on different terms, provided the original work is properly cited, appropriate credit is given, any changes made indicated, and the use is non-commercial. See http://creativecommons.org/licenses/by-nc/4.0/.
Statistics from Altmetric.com
WHAT IS ALREADY KNOWN ON THIS TOPIC
Immune checkpoint blockade (ICB) treatment has shown superior efficacy in only a minority of patients with cancer. Given that ICB treatment relies on unleashing patients’ pre-existing immune responses, this study proposes the neutrophil-to-lymphocyte ratio (NLR) as a simplified indicator of patients’ immune status to predict ICB treatment outcomes.
WHAT THIS STUDY ADDS
The pretreatment NLR levels were associated with ICB treatment outcomes in a U-shaped dose-dependent manner: an NLR range between 2.0 and 3.0 was remarkably associated with optimal ICB treatment outcomes; comparatively, either decreasing (<2.0) or increasing (>3.0) NLR levels were indicators of worse ICB treatment outcomes.
HOW THIS STUDY MIGHT AFFECT RESEARCH, PRACTICE OR POLICY
The NLR range between 2.0 and 3.0 (18.6% of patients) might indicate an optimal balance between innate and adaptive immune responses for antitumor immunity; while decreasing NLR (<2.00; 10.9% of patients) or increasing NLR (>3.00; 70.5% of patients) may represent two distinct types of immune dysregulation associated with ICB resistance. This study is useful for guiding clinicians in future research and may potentially increase our understanding of systemic inflammation in antitumor immunity.
Introduction
‘Nature is pleased with simplicity.’—Isaac Newton (Philosophiae Naturalis Principia Mathematica).1
The immune-inflammatory response involves a complex network of various tissues, cells, and molecules. To simplify the complexity, a hematological marker of neutrophil-to-lymphocyte ratio (NLR) has been used to reflect the immune-inflammatory response.2 As an inexpensive, non-invasive, readily available marker of systemic inflammation, the NLR has emerged as a simplified surrogate of ominous milestones for predicting disease progression, patient survival, and treatment response.3 The utility of the NLR has been repeatedly and reproducibly demonstrated in a wide range of human diseases—from cardiovascular disease,4 5 cerebrovascular disease,6 7 infectious disease,8 9 and sepsis,10 11 to cancer.12 13 However, below the surface of general simplicity, the complexity underlying its usefulness in clinical practice remains to be elucidated,14 especially in cancer treatment, which involves a heterogeneous tumor entity with varying degrees of immune-inflammatory responses.
In the era of cancer immunotherapy, immune checkpoint blockade (ICB) treatment uses therapeutic antibodies that disrupt negative immune regulatory checkpoints to reinvigorate the exhausted but pre-existing antitumor immune response.15 Unlike other cancer therapies, such as chemotherapy and radiotherapy that directly kill tumor cells, ICB treatment relies on unleashing the host’s pre-existing immunity.16 Given the basic principle of ICB treatment described above, the pretreatment immune status should determine the future clinical response to ICB treatment. Biomarkers of patients’ immune status could serve as mechanism-based indicators to predict ICB response.
Considering the fact that the superior efficacy of ICB treatment was observed in only a minority of patients with cancer,17–19 there is an urgent need to design a precision medicine-based approach regarding baseline immune status to predict interindividual differences in ICB response. Neutrophils and lymphocytes are the most common leukocytes, accounting for almost 90% of the leucocyte population, and are the most important components of the immune response.20 Focusing on the key components of immune response, the NLR—the ratio of neutrophils to lymphocytes—should serve as a simplified but effective indicator of patients’ immune status. In this study, we proposed the use of the NLR as a candidate immune-inflammatory biomarker in ICB treatment, while conducting a comprehensive investigation of the relationship between pretreatment immune status and clinical outcomes of ICB treatment.
Methods
Data source, patients, and measures of clinical outcome and treatment response
The complete clinical and laboratory data of 1714 patients with cancer were derived from the Memorial Sloan Kettering Cancer Center.21 The patients received ICB therapy using immune checkpoint inhibitors (ICIs) of PD-1/PD-L1 and CTLA-4 without neoadjuvant and adjuvant settings. As shown in figure 1A, baseline NLR was collected before ICB treatment, and treatment response was categorized according to the Response Evaluation Criteria in Solid Tumors (RECIST) V.1.122 or best radiographic response.21

The U-shaped association between neutrophil-to-lymphocyte ratio (NLR) and clinical outcomes of immune checkpoint blockade (ICB) treatment in patients with cancer. (A) The illustration of study design. (B) The smoothing estimate of HR with 95% CIs across the spectrum of NLR levels. The log-HR curves (solid line) with 95% CIs (shading) show the impact of NLR increase on the overall survival (OS) and progression-free survival (PFS) in cancer patients with ICB therapy. The HRs were fitted by univariate and multivariate analyses based on Cox proportional hazards regression model. Multivariate analysis was performed using the covariates of sex, age, tumor stage, drug class of immune checkpoint inhibitor (ICI), ICI as first or subsequent line of treatment, ECOG (Eastern Cooperative Oncology Group) performance status, tumor mutational burden (TMB), microsatellite instability (MSI) status, and cancer type. The x-axis shows the NLR levels, and the y-axis shows the log-HR taking the median of NLR levels as a reference. The 95% CIs above or below 0 is equivalent to a significance of two-sided p<0.05. Background colors indicate lower and higher NLR levels. The arrow and dot show the NLR median—4.38.
Survival analysis of patients with cancer
The survival analysis was performed by the survival R package (https://CRAN.R-project.org/package=survival). The overall survival (OS) and progression-free survival (PFS) of patients with cancer were analyzed using Cox proportional hazards regression model.23 The multivariate Cox regression analysis was performed with covariates including sex, age, tumor stage, drug class of ICI, ICI as first or subsequent line of treatment, ECOG (Eastern Cooperative Oncology Group) performance status, tumor mutational burden (TMB), microsatellite instability (MSI) status, and cancer type.
Spline-based HR by Cox regression model
The non-linear HR was introduced into Cox regression analysis by the spline-based smoothing method, as previously reported.24 25 HRs were measured across the continuous spectrum of NLR levels, taking the median value of NLR (NLR=4.38) as a reference. The statistical approach of smoothHR26 was used to calculate the natural cubic regression spline curve of HR with 95% CIs.27 The log-HR curve with 95% CIs presented a straightforward interpretation—the 95% CIs above or below 0 is equivalent to a significance of two-sided p<0.05.
Bootstrap analysis
The analysis of 1000 randomly resampled cohorts was conducted by the bootstrap resampling method, with replacement from the original cohort.28 29 Statistical estimates of clinical outcomes, including the mean and 95% CI, were measured by bootstrap analysis. The bootstrap resampling method was performed by the sample function in the base package using the R software (The R Foundation for Statistical Computing, Vienna, Austria, http://www.r-project.org).
Statistical analysis
All statistical analyses were performed in the R v.3.6.1 environment. Correction for multiple testing was performed using the false discovery rate (FDR) method.30 The χ2 test was conducted with Monte Carlo simulations.31 All statistical tests used 0.05 as the significance level, p≥0.05 was considered not significant (ns), and p<0.05 was considered as significant (*p<0.05, **p<0.01, ***p<0.001, and ****p<0.0001).
Results
Baseline NLR is associated with the clinical outcomes of ICB treatment in a U-shaped dose-dependent manner
To explore the relationship between NLR-based systemic inflammation and the clinical outcomes in response to ICB treatment, we interrogated a large pan-cancer cohort of 1714 patients with cancer that encompassed 16 types of cancer (figure 1A). The non-linear dynamics of OS and PFS following ICB treatment were constructed across different NLR levels. Using a previously reported spline-based Cox regression analysis,32 33 we modeled the non-linear HR curve across the continuous spectrum of NLR levels, taking the median NLR level (NLR=4.38) as a reference. The multivariate analysis was performed using the covariates of sex, age, tumor stage, drug class of ICI, ICI as first or subsequent line of treatment, ECOG performance status, TMB, MSI status, and cancer type. As shown in figure 1B, the non-linear HR analysis discovered the dose-dependent relationships of NLR with OS and PFS in a non-linear manner. Different from previous studies based on dichotomization of NLR level using a single cut-off,21 34–37 this study found that the associations of NLR with patient survival and disease progression were not completely linear but showed a U-shaped relationship.
Patient survival and disease progression following ICB treatment in patients with different NLR levels
Considering the broad spectrum of NLR levels ranging from 0.3 to 88.0, patients with cancer were separated according to low (<2.0), medium (2.0–12.0), and high (>12.0) NLR levels; further, the low-NLR patients were stratified by the NLR cut-offs of 1.0 and 2.0; the medium-NLR patients were stratified by the NLR cut-offs ranging from 3.0 to 12.0 in increments of 3.0; the high-NLR patients were stratified by the NLR cut-offs ranging from 12.0 to 30.0 in increments of 9.0 (figure 2A–H). Next, the Kaplan-Meier analysis showed that when NLR <3.0, the decreasing NLR was significantly associated with a stepwise reduction of OS and PFS (p<0.0001; figure 2A and E). Comparatively, when NLR >2.0, the increasing NLR was significantly associated with a stepwise reduction of OS and PFS (p<0.01; figure 2B,C,F and G). Patients with NLR levels ranging from 2.00 to 2.99 showed the best prognosis with the longest median survival times of OS and PFS (figure 2D and H).

The overall survival (OS) and progression-free survival (PFS) in ICB-treated patients according to NLR levels. (A–H) The Kaplan-Meier curves show the OS (A–D) and PFS (E–H) in ICB-treated patients. In the wide spectrum of NLR levels ranging from 0.3 to 88.0, patients with cancer were separated according to low (<2.0), medium (2.0–12.0), and high (>12.0) NLR levels; further, the low-NLR patients were stratified by the NLR cut-offs of 1.0 and 2.0; the medium-NLR patients were stratified by the NLR cut-offs ranging from 3.0 to 12.0 in increments of 3.0; the high-NLR patients were stratified by the NLR cut-offs ranging from 12.0 to 30.0 in increments of 9.0. The bottom panel shows the number of patients at risk every 1 year. The significance was analyzed by the log-rank test with median survival times (D, H). (I–J) The forest plot shows the association of NLR with OS (I) and PFS (J) following ICB therapy. HR and 95% CI were calculated by Cox proportional hazards regression analysis, taking the NLR subgroup of 2.00–2.99 as the reference. Multivariate analysis was performed using the covariates of sex, age, tumor stage, ICI drug class, ICI line of treatment, ECOG performance status, TMB, MSI status, and cancer type. ECOG, Eastern Cooperative Oncology Group; ICB, immune checkpoint blockade; ICI, immune checkpoint inhibitors; MSI, microsatellite instability; NLR, neutrophil-to-lymphocyte ratio; OS, overall survival; PFS, progression-free survival; TMB, tumor mutational burden.
Furthermore, the multivariate analysis using the Cox regression model clearly showed the U-shaped dose-dependent associations of NLR with OS and PFS (figure 2I,J), which also indicates NLR as an independent prognostic factor. In summary, in comparison to the reference subgroup of NLR ranging from 2.00 to 2.99, either decreasing NLR (<2.0) or increasing NLR (>3.0) levels were indicators of reduced patient survival and accelerated disease progression.
NLR and the treatment response to ICB therapy
Next, the different treatment responses to ICB therapy were defined as progressive disease (PD), stable disease (SD), partial response(PR), and complete response (CR). In the analysis of ICB treatment response, only 26.7% of total patients were responders with CR or PR, while the remaining 73.3% of patients were non-responders of SD or PD. The efficacy of ICB therapy was assessed by objective response rate (ORR)—the percentage of patients who experienced a CR or PR. Additionally, the clinical benefit rate (CBR) was measured by the percentage of patients who underwent a CR, PR, or SD, and 48.2% of total patients verified the clinical benefit in response to ICB treatment (figure 3A).
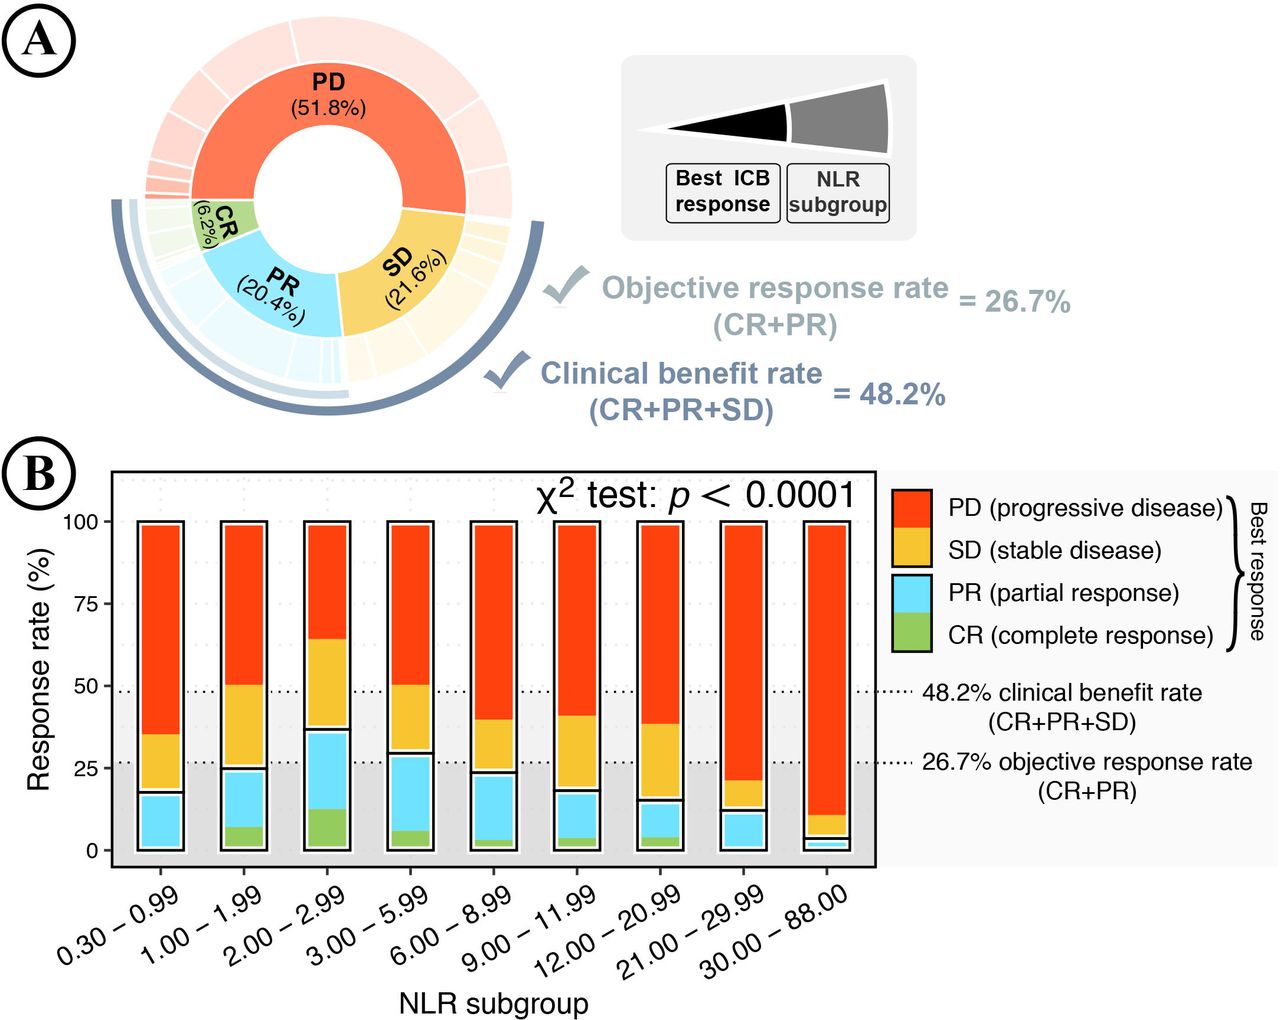
The association between neutrophil-to-lymphocyte ratio (NLR) and treatment response to immune checkpoint blockade (ICB) therapy. (A, B) ICB response in patients with cancer according to NLR levels. (A) The pie plot shows the percentage of patients by best ICB response and NLR levels. ICB response was classified into PD, SD, PR, and CR. The NLR subgroups were classified according to low (<2.0), medium (2.0–12.0), and high (>12.0) NLR levels; further, patients were stratified by the NLR cut-offs of 1.0 and 2.0 for low NLR group, NLR cut-offs of 3.0, 6.0, 9.0, and 12.0 for medium NLR group, and NLR cut-offs of 12.0, 21.0, and 30.0 for high NLR group. The color shows different ICB responses, with the color gradient showing NLR subgroups. The objective response rate (ORR: CR+PR) is 26.7%, and the clinical benefit rate (CBR: CR+PR+SD) is 48.2%. (B) NLR and ICB response rate. The stacked bar plot shows the percentage of best ICB responses (PD, SD, PR, and CR) in patients of different NLR subgroups. Additionally, total patients were stratified according to NLR levels. The results were considered statistically significant when p<0.05 (*), p<0.01 (**), p<0.001 (***), and p<0.0001 (****) and insignificant when p≥0.05 (ns) using the χ2 test with 10,000 replicates by Monte Carlo simulation. The black dashed line indicates an average ORR of 26.7% and an average CBR of 48.2% in total patients. CBR, clinical benefit rate.
As described above, total patients were separated into nine subgroups according to NLR levels. NLR was significantly associated with ICB treatment response in a U-shaped dose-dependent manner (p<0.0001; figure 3B). Patients with NLR levels ranging from 2.0 to 3.0 achieved the best ICB response with an ORR of 36.7% and a CBR of 64.2%. Compared with the reference NLR subgroup (NLR=2.00–2.99), either decreasing NLR (<2.0) or increasing NLR (>3.0) levels were significantly associated with stepwise reductions in ORR and CBR, implying that patients’ baseline immune status could markedly shape ICB response.
Variability and reproducibility of the dose-dependent relationship between NLR and ICB treatment outcome
To confirm the dose-dependent relationship between NLR and ICB treatment outcomes, the variability and reproducibility of the above findings were estimated using 1000 randomly bootstrap-resampled cohorts (figure 4A–H; also see the Methods section). The clinical outcomes were measured by the median survival times of OS and PFS, and the ORR and CBR. Compared with the reference NLR subgroup (NLR=2.00–2.99), either decreasing NLR (<2.0) or increasing NLR (>3.0) levels showed cumulative impacts on worse clinical outcomes of OS, PFS, ORR, and CBR (figure 4A–H). According to different NLR levels, the median survival times ranged from 0.14 to 2.55 years for OS (figure 4A) and 0.09 to 0.45 years for PFS (figure 4C), and the ORR ranged from 3.29% to 36.79% (figure 4E) and the CBR ranged from 10.64% to 64.18% (figure 4G).
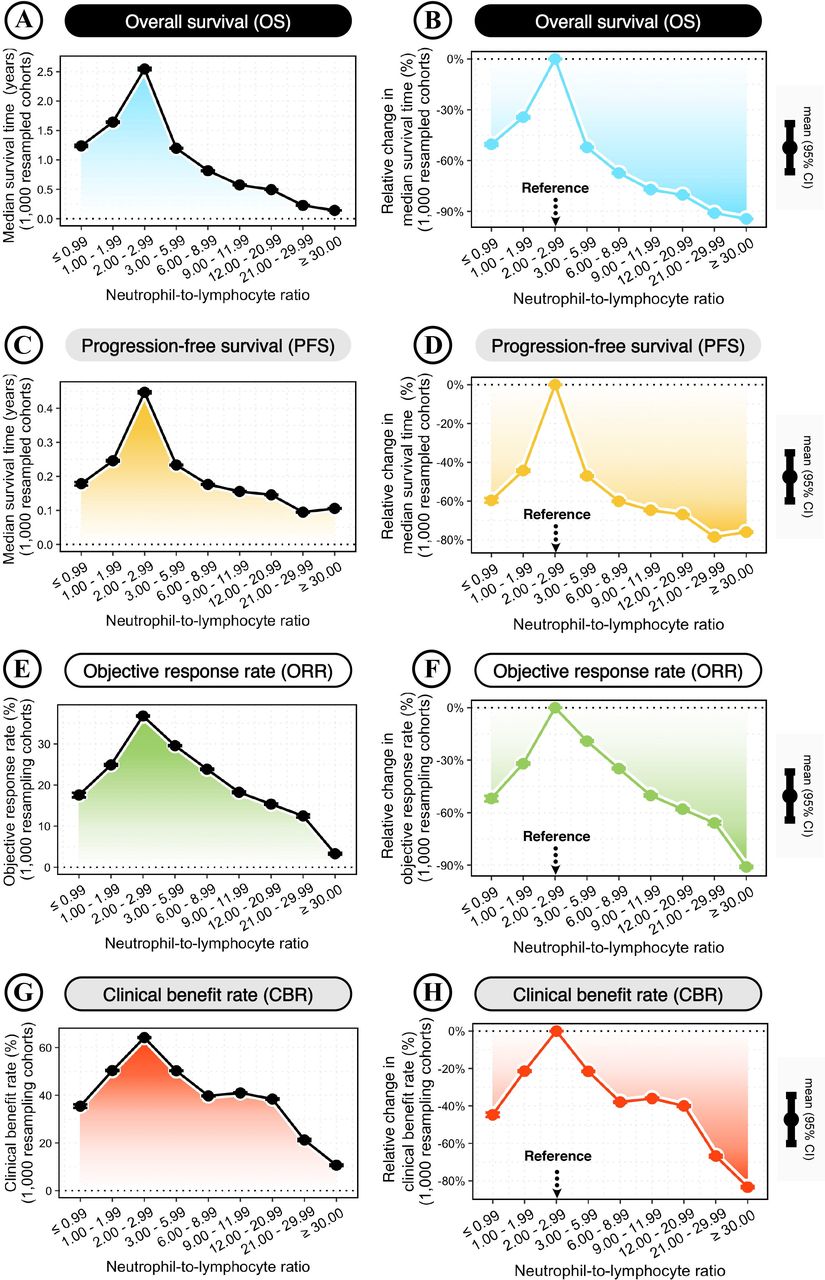
Clinical outcomes of immune checkpoint blockade (ICB) therapy changes with different neutrophil-to-lymphocyte ratio (NLR) levels. (A, C, E, G) Changes in the median survival times of overall survival (OS) (A) and progression-free survival (PFS) (C), and the objective response rate (ORR) (E) and clinical benefit rate (CBR) (G) across different NLR subgroups. NLR subgroups were classified according to NLR cut-offs of 1, 2, 3, 6, 9, 12, 21, and 30. (B, D, F, H) Relative changes in the median survival times of OS (B) and PFS (D), and the ORR (F) and ORR (H) across different NLR levels, compared with the reference group of NLR=2.00–2.99. Bootstrap was applied to generate 1000 randomly resampled cohorts. The dot-line plot shows the changes across increasing NLR levels, with error bars representing the mean±95% CI calculated by 1000 bootstrap-resampled cohorts.
The relative changes in ICB treatment outcomes were measured according to the reference group (NLR=2.00–2.99). Patients with the lowest NLR (≤0.99) and the highest NLR (≥30.00) had significantly worse clinical outcomes, showing relative changes of −50.41% and −94.34% in OS (figure 4B); −59.64% and −76.03% in PFS (figure 4D); −51.95% and −91.00% in ORR (figure 4F); −44.74% and −83.38% in CBR (figure 4H), respectively.
Landscape of NLR-related clinical outcomes of ICB therapy across different patient demographics, baseline characteristics, treatments, ICB responsiveness, and cancer types
To provide a comprehensive landscape for the NLR–ICB relationship, the clinical outcomes were extensively evaluated in different patient subgroups defined by demographics, baseline characteristics, treatment, cancer-type-specific ICB responsiveness (as shown in online supplemental figure S1), and individual cancer type. For each subgroup, 1000 bootstrap-resampled cohorts were generated to measure the clinical outcomes in response to ICB therapy. Total patients were classified into subgroups of low NLR (<2.00), reference NLR (2.00–2.99), medium NLR (3.00–11.99), and high NLR (>12.00). An overall trend of significantly worse clinical outcomes was observed in patients with lower or higher NLR levels than the reference group (NLR=2.00–2.99) (figure 5A,B).
Supplemental material
Supplemental material
Supplemental material
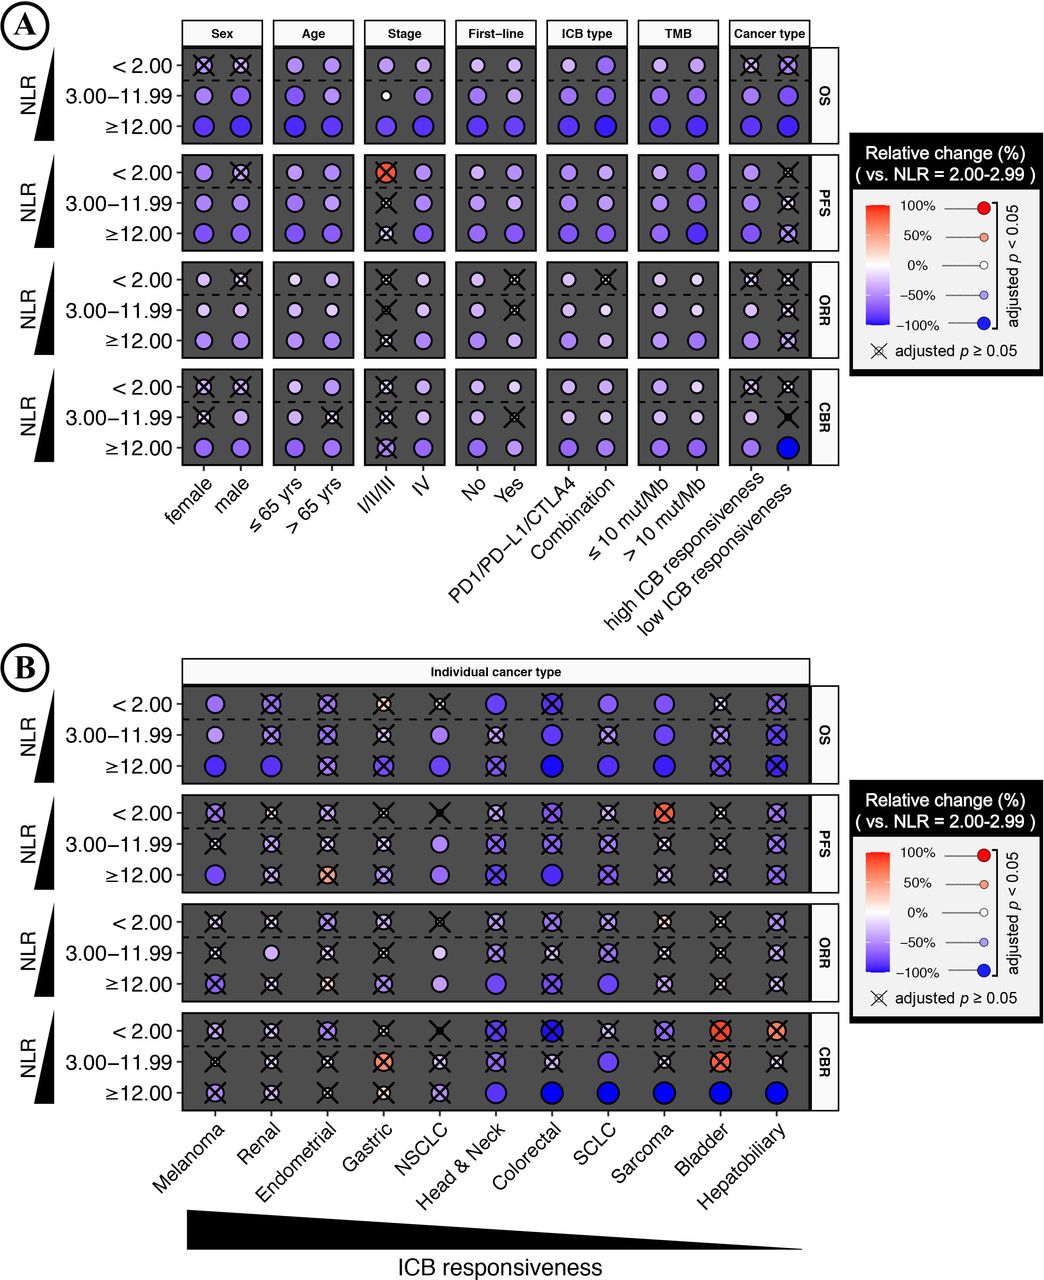
Landscape of clinical outcomes associated with neutrophil-to-lymphocyte ratio (NLR) levels for immune checkpoint blockade (ICB) treatment across patient demographics, baseline characteristics, treatment, and cancer type. (A) Heatmap plots show the relative change in the clinical benefits associated with NLR levels for ICB treatment in different subgroups defined by patient demographics, baseline characteristics, treatment, tumor mutational burden (TMB), and cancer-type-specific ICB responsiveness. Cancer types with ≥20% ORR were defined as high ICB-responsive cancer types, and vice versa (online supplemental figure S1). The clinical outcome was measured by overall survival (OS), progression-free survival (PFS), objective response rate (ORR), and clinical benefit rate (CBR). Patients were separated by low (<2.00), medium (3.00–11.99), and high (≥12.00) NLR levels, and compared with the reference group of NLR=2.00–2.99. Bootstrap was applied to generate 1000 randomly resampled cohorts for each subgroup. The color and size of the dots represent the mean of relative changes from 1000 bootstrap-resampled cohorts. The negative value indicates a worse clinical outcome compared with the reference group of NLR=2.00–2.99, and vice versa. The results were evaluated by the one-sample Wilcoxon signed rank test and considered statistically significant when the false discovery rate (FDR)-adjusted p<0.05, and the ‘X’ represents insignificant results. (B) Relative change in the clinical outcomes associated with NLR levels for ICB therapy in different cancer types (vs the reference group of NLR=2.00–2.99). Heatmap shows cancer types with sample sizes ≥50 (online supplemental figure S2).
Notably, NLR could predict clinical outcomes of ICB therapy in most subgroups, even in low-TMB tumors that are refractory to ICB therapy.33 38 As shown in figure 5A, the significance and magnitude of associations in low-TMB tumors (≤10 mutations/megabase (mut/Mb)) were comparable to those with high-TMB (> 10 mut/Mb). For low-TMB tumors, all NLR subgroups had significantly worse clinical outcomes than the reference group (NLR=2.00 to 2.99). Thus, we can reach a conclusion that when NLR levels were within the range of 2.00 to 2.99, patients with low-TMB tumors could achieve maximum clinical improvements in response to ICB treatment.
In summary, figure 5A and B presented a landscape of NLR-related clinical outcomes in response to ICB treatment. This comprehensive picture is useful for guiding clinicians in future research and may potentially increase our understanding of systemic inflammation in antitumor immunity.
Discussion
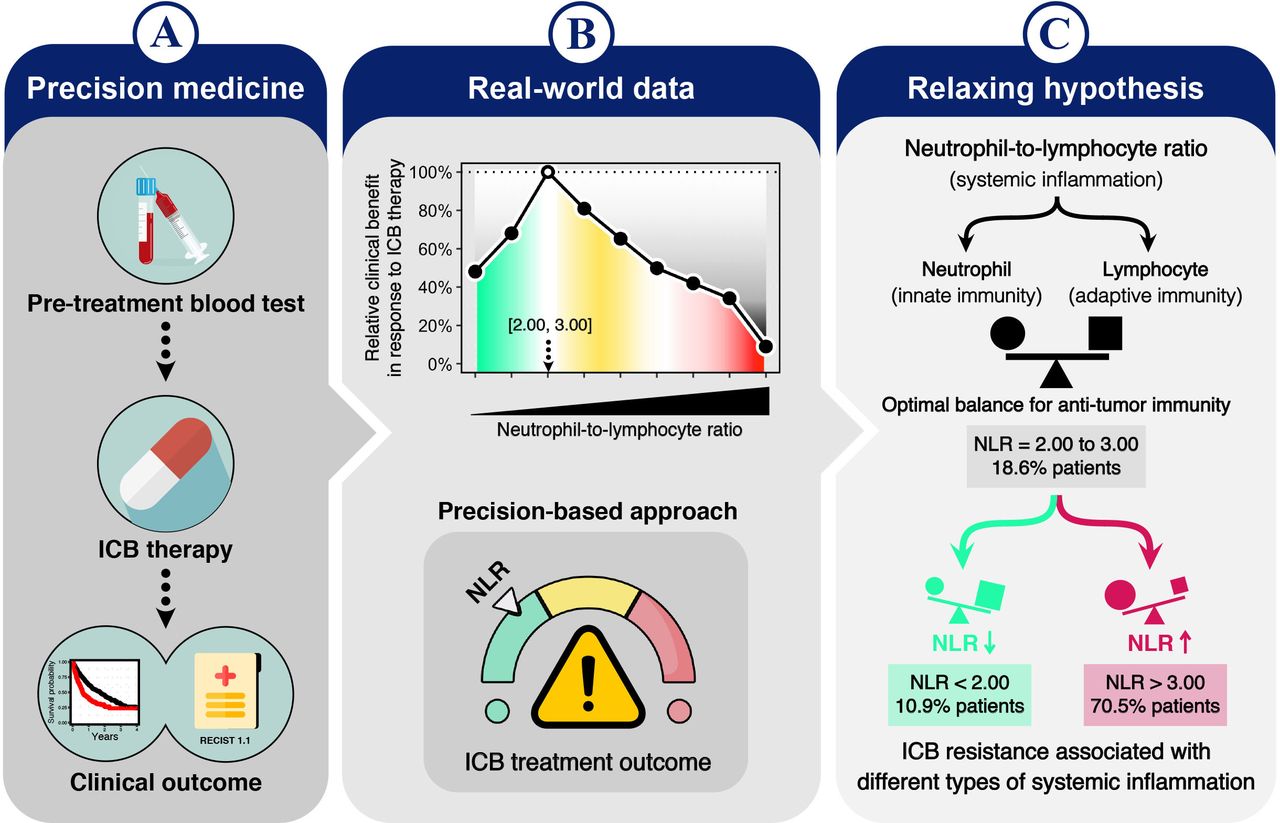
Over the past few decades, the field of oncology has been radically transformed due to the advent of immunotherapy39 and precision medicine.40 This study proposed a precision medicine-based approach using the baseline NLR level, presenting a clinical workflow using pretreatment blood tests to predict the interindividual differences in ICB treatment outcomes (figure 6A). Of note, according to the real-world data from a large clinically representative cohort of 16 cancer types, this study suggests that the pretreatment blood test of NLR could serve as a precision medicine-based approach to ICB therapy (figure 6B).
Schematic illustration of a precision medicine-based approach using neutrophil-to-lymphocyte ratio (NLR) in immune checkpoint blockade (ICB) treatment. (A) Precision medicine in ICB treatment: a model of the clinical workflow using pre-treatment blood tests to predict clinical outcomes of ICB therapy. (B) The real-world data suggest that the pretreatment NLR could be a precision medicine-based approach to predict ICB treatment outcomes. (C) The relaxing hypothesis of systemic inflammation in ICB resistance. NLR—a systemic inflammation index—reflects the balance between innate immunity (neutrophils) and adaptive immunity (lymphocytes). A given range of NLR between 2.00 and 3.00 may indicate an optimal balance of systemic inflammation to elicit potential antitumor immunity. However, optimal systemic inflammation (NLR=2.00–3.00) accounted for only a minority of patients (18.6%). Comparatively, decreased NLR (<2.00; 10.9% patients) and increased NLR (>3.00; 70.5% patients) levels represent different types of systemic inflammation, which were associated with treatment resistance to ICB therapy. Therefore, striking an optimal balance of systemic inflammation might improve ICB treatment toward optimizing antitumor immunity.
This study presented several findings that are especially important for the clinical practice of ICB treatment:
To the best of our knowledge, this study highlights a previously unreported finding that the pre-treatment NLR levels were associated with ICB treatment outcomes in a U-shaped dose-dependent manner.
Across the broad spectrum of NLR levels ranging from 0.3 to 88.0, a narrow range of NLR levels between 2.0 and 3.0 was related to the best ICB treatment outcomes, including increased patient survival, delayed disease progression, improved treatment response, and significant clinical benefit. Compared with the NLR levels ranging from 2.0 to 3.0, either decreasing NLR (<2.0) or increasing NLR (>3.0) levels were indicators of worse ICB treatment outcomes.
This study presents the most comprehensive landscape of NLR-related ICB treatment outcomes in different patient populations defined by demographics, baseline characteristics, treatment, cancer-type-specific ICB responsiveness, and individual cancer type. This detailed landscape reveals the clinical significance of the NLR across a variety of patient populations, even in patients with low ICB-responsive tumors defined by TMB levels ≤10 mut/Mb, most of whom are not recommended to receive ICB treatment according to the current US Food and Drug Administration (FDA) guidelines.41 Thus, further stratification of patients with cancer by NLR levels might be warranted for implementing ICB treatment.
Simplicity matters in clinical practice. Due to its simplicity, the NLR has long been a reliable, practical, and cost-effective marker for prospective risk stratification.4–13 42 The normal NLR range in the healthy population is between 0.78 and 3.53.43 By considerably narrowing the previous normal range of NLR, this study discovered that the greatest improvement in clinical outcome was achieved within a limited NLR range between 2.0 and 3.0, which can be considered a clinical outcome-based range. This ICB-associated NLR range has important implications for clinicians in clinical decision making as well as for regulatory agencies in drug approvals. Furthermore, this study demonstrates a model of the clinical workflow that enables the translation of routine blood tests into a potential precision medicine-based approach.
Conclusion
The NLR is a well-acknowledged indicator of systemic inflammation.2 The above findings underscore the importance of adequate control of inflammation to mediate effective antitumor immunity. In fact, the NLR reflects the ratio between innate immunity (neutrophils) and adaptive immunity (lymphocytes). Thus, an NLR range between 2.0 and 3.0 might indicate an optimal balance between innate and adaptive immune responses. Notably, the optimal NLR range between 2.0 and 3.0 was found in only a minority of patients (18.6%). Comparatively, a majority of patients showed a low NLR (<2.00; 10.9% patients) or a high NLR (>3.00; 70.5% patients). These represent two distinct types of immune dysregulation, both of which are associated with treatment resistance to ICB therapy (figure 6C). Considering the extent to which these two types of immune dysregulation could pose a barrier to effective treatment, a precision medicine-based approach should be adopted to improve clinical outcomes. The blood-based NLR renders the complex interplay between innate and adaptive immunity traceable in clinical practice. Future research should evaluate the effectiveness of the NLR for monitoring therapeutic efficacy during and after the administration of ICB therapy.
Supplemental material
Data availability statement
No data are available.
Ethics statements
Patient consent for publication
Ethics approval
No human subjects were directly involved in this study. All the data used in this study were derived from existing deidentified biological samples from prior studies. Thus, ethical and patient consent was not required in this study.
Acknowledgments
We thank Dr Luc G.T. Morris and his colleagues for the clinical and tumor mutational data of patients with cancer from their previously published study.
References
Footnotes
Contributors MZ conceived the project, developed the method, conducted data analysis, and wrote the manuscript. MZ supervised this project and is the guarantor for the overall content.
Funding This project was supported by the National Natural Science Foundation of China (32100739) to MZ.
Competing interests The funders had no role in the study design, data analysis, data interpretation, and writing of this manuscript. This study was conducted in the absence of any commercial or financial relationships that could be construed as a potential conflict of interest.
Provenance and peer review Not commissioned; externally peer reviewed.
Supplemental material This content has been supplied by the author(s). It has not been vetted by BMJ Publishing Group Limited (BMJ) and may not have been peer-reviewed. Any opinions or recommendations discussed are solely those of the author(s) and are not endorsed by BMJ. BMJ disclaims all liability and responsibility arising from any reliance placed on the content. Where the content includes any translated material, BMJ does not warrant the accuracy and reliability of the translations (including but not limited to local regulations, clinical guidelines, terminology, drug names and drug dosages), and is not responsible for any error and/or omissions arising from translation and adaptation or otherwise.