Article Text

Abstract
Introduction In clear cell renal cell carcinoma (ccRCC), tumor-associated macrophage (TAM) induction of CD8+T cells into a terminally exhausted state has been implicated as a major mechanism of immunotherapy resistance, but a deeper biological understanding is necessary.
Methods Primary ccRCC tumor samples were obtained from 97 patients between 2004 and 2018. Multiplex immunofluorescence using lymphoid and myeloid markers was performed in seven regions of interest per patient across three predefined zones, and geospatial analysis was performed using Ripley’s K analysis, a methodology adapted from ecology.
Results Clustering of CD163+M2 like TAMs into the stromal compartment at the tumor–stroma interface was associated with worse clinical stage (tumor/CD163+nK(75): stage I/II: 4.4 (IQR −0.5 to 5.1); stage III: 1.4 (IQR −0.3 to 3.5); stage IV: 0.6 (IQR −2.1 to 2.1); p=0.04 between stage I/II and stage IV), and worse overall survival (OS) and cancer-specific survival (CSS) (tumor/CD163+nK(75): median OS–hi=149 months, lo=86 months, false-discovery rate (FDR)-adj. Cox p<0.001; median CSS–hi=174 months, lo=85 months; FDR-adj. Cox p<0.001). An RNA-seq differential gene expression score was developed using this geospatial metric, and was externally validated in multiple independent cohorts of patients with ccRCC including: TCGA KIRC, and the IMmotion151, IMmotion150, and JAVELIN Renal 101 clinical trials. In addition, this CD163+ geospatial pattern was found to be associated with a higher TIM-3+ proportion of CD8+T cells, indicative of terminal exhaustion (tumor-core: 0.07 (IQR 0.04–0.14) vs 0.40 (IQR 0.15–0.66), p=0.05).
Conclusions Geospatial clustering of CD163+M2 like TAMs into the stromal compartment at the tumor–stromal interface was associated with poor clinical outcomes and CD8+T cell terminal exhaustion.
- Kidney Neoplasms
- Macrophages
- Tumor Microenvironment
- CD8-Positive T-Lymphocytes
Data availability statement
Data are available on reasonable request. Code Availability Statement: The code used to complete this analysis is available in the supplemental material. Any additional requested code may be obtained from the corresponding author (NC) on reasonable request.
This is an open access article distributed in accordance with the Creative Commons Attribution Non Commercial (CC BY-NC 4.0) license, which permits others to distribute, remix, adapt, build upon this work non-commercially, and license their derivative works on different terms, provided the original work is properly cited, appropriate credit is given, any changes made indicated, and the use is non-commercial. See http://creativecommons.org/licenses/by-nc/4.0/.
Statistics from Altmetric.com
WHAT IS ALREADY KNOWN ON THIS TOPIC
The clear cell renal cell carcinoma (ccRCC) tumor immune microenvironment is complex, with recent studies suggesting a potential interaction between CD8+T cells and M2-polarized macrophages driving immune dysfunction and poor clinical outcomes. This study was undertaken to determine the spatial relationships between lymphoid and myeloid cells within the ccRCC tumor immune microenvironment, to deepen the biological understanding of these cellular interactions, and associate these findings with clinical outcomes in a large cohort of patients with ccRCC.
WHAT THIS STUDY ADDS
This study found that geospatial clustering of CD163+M2-polarized macrophages into the stromal compartment at the tumor–stromal interface was associated with poor clinical outcomes and CD8+T cell terminal exhaustion.
HOW THIS STUDY MIGHT AFFECT RESEARCH, PRACTICE OR POLICY
These findings demonstrate that specific cellular locations and spatial relationships contribute significantly to clinical and biological outcomes, highlighting that cellular phenotype and abundance may not adequately describe the ccRCC tumor microenvironment in the absence of geospatial context.
Introduction
Since the emergence of immune checkpoint inhibiting (ICI) systemic immunotherapy in the management of metastatic renal cell carcinoma (RCC), detailed investigations into the tumor immune microenvironment (TIME) of RCC have become critically important.1–6 Only a subset of patients will have an objective response to ICIs, but responses can be substantial and durable.7 Given this response profile, identifying biomarkers for response and resistance to ICI is a vital area of research.
Tumor mutational burden (TMB), PD-L1 expression, and CD8+T cell infiltration have emerged as promising biomarkers predicting response to ICI-based regimens across a wide spectrum of tumor primary sites and histologies.8–10 However, in clear cell RCC (ccRCC) these biomarkers have not performed particularly well in either a predictive or prognostic capacity.11–14 Despite being one of the most immune-inflamed tumor types, ccRCC tumors harbor a relatively modest TMB.13 A recent meta-analysis of ICI trials in RCC did not demonstrate improved overall survival (OS) for patients with PD-L1+ versus PD-L1− tumors, though it was associated with progression-free survival.15 CD8+ infiltration does not consistently predict improved ICI response in ccRCC and has paradoxically been associated with poor outcomes.16–18 These results point to the ccRCC TIME as being uniquely complex, with clinical outcomes not being associated with the same biomarkers identified in other solid-organ malignancies.19
Leveraging single-cell RNA-sequencing (scRNA-seq), recent investigations into the ccRCC TIME have implicated M2-like tumor-associated macrophages (TAMs) as having a protumor immunosuppressive effect on the TIME of ccRCC.20–23 Several of these studies have identified a possible interaction between M2-like TAMS and CD8+T cells that results in switching CD8+T cells into a terminally exhausted state, resulting in poor clinical outcomes.20–22 These findings partially explain the paradoxical association between increasing CD8+ infiltration and poor outcomes in ccRCC and demonstrate the emerging importance of recognizing distinct TAM subtypes and their biological actions in ccRCC.
However, scRNA-seq methodologies are tissue-destructive, impeding the ability to analyze the effect of immune cell geospatial location and distribution. Previous spatially resolved analyses of TAMs and CD8+T cells have involved global analyses of cell density and infiltration identified within different tumor regions.24–26 TAMs affect the TIME through a variety of receptor-binding and paracrine mechanisms that rely on proximity to their effector cells, and a proof-of-concept analysis from our group suggested that highly specific geospatial TAM distributions have a significant impact on their protumor activity.27–31 Our primary aim was to quantify specific geospatial distributions of myeloid and lymphoid cells within the ccRCC TIME and determine associations with patient survival.
Results
Study population
The overall study population included 97 patients who had surgically excised ccRCC samples that underwent multiplex immunofluorescence (mIF) (age: 66 years (IQR 59–72); male gender: 66 (68%); white race: 84 (87%)). The cohort included patients with a wide spectrum of clinical disease states: 24 patients (25%) presenting with clinical stage I/II, 49 (50%) with clinical stage III, and 24 (25%) with clinical stage IV. (online supplemental table 1, figure 1).
Supplemental material

Overview of the demographics and selected findings from the overall cohort. Listed in descending order: SSIGN risk score, age, gender, pT stage, ISUP histological grade, sarcomatoid variant status, overall survival (months), vitality status, xCell bulk RNA-seq immune expression scores, multiplex immunofluorescence cellular density in the tumor-core, and somatic mutation alteration status. xCell scores and mIF cell densities have been normalized to a 0–100 scale, as indicated by the color scale in the legend. mIF, multiplex immunofluorescence; OS, overall survival. SSIGN = Stage, Size, Grade and Necrosis score; ISUP = International Society of Urologic Pathology.
ccRCC immune cell density is most often highest at the tumor–stroma interface
When stratified by tumor zone and cell type, the tumor–stroma interface most often contained the highest immune cell density (cells/mm2). CD3, CD8, FOXP3, T-bet, CD163, CD206, CD20, and PD-L1 positive cell densities were higher at the tumor–stroma interface than in the tumor-core (CD3: 77 vs 50 cells/mm2, p=0.002; CD8: 131 vs 76 cells/mm2, p=0.035; FOXP3: 12 vs 6 cells/mm2, p<0.001; T-bet: 12 vs 6 cells/mm2, p<0.001; CD163: 392 vs 244 cells/mm2, p=0.01; CD206: 190 vs 53 cells/mm2, p<0.001; CD20: 5 vs 1 cells/mm2, p<0.001; PD-L1: 85 vs 44 cells/mm2, p=0.02) (figure 2B).
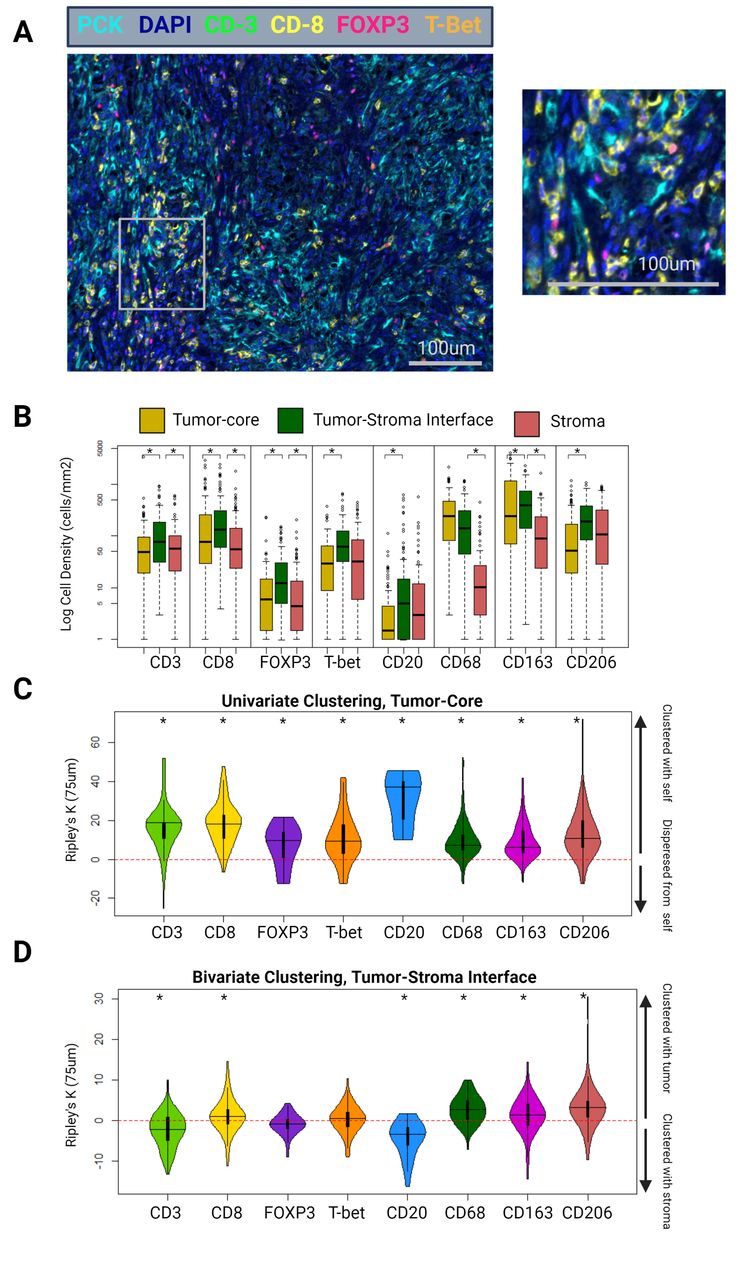
(A) Example tumor-core mIF image of a patient with ISUP grade 4 ccRCC, using the lymphoid panel. Magnified area indicated by the gray box. (B) Differential cell densities stratified by histological zone. (C) Differential univariate cellular clustering, nK(75), in the tumor-core histological zone. (D) Differential bivariate clustering of tumor and immune cells, nK(75), in the tumor–stoma interface histological zone. ccRCC, clear cell renal cell carcinoma; mIF, multiplex immunofluorescence. ISUP = International Society of Urologic Pathology. Asterisk denotes p<0.05.
When patients were stratified into clinically localized (AJCC clinical stage I–III) versus clinically metastatic disease (stage IV), T-bet density was consistently lower in patients with metastatic disease across all three zones (tumor-core: 39 vs 9 cells/mm2, p<0.001; tumor–stroma interface: 73 vs 45 cells/mm2, p<0.001; stroma: 45 vs 12 cells/mm2, p<0.001). None of the other immune cell types demonstrated significant differences in cellular density between clinically localized and metastatic patients (online supplemental figure 1).
ccRCC immune cell clustering: B-cells display uniquely high levels of clustering and preference for stroma
Immune cell clustering was quantified using a normalization of the univariate Ripley’s K estimate at a search-circle radius of 75 µm (nK(75)). Values greater than 0 indicate cellular clustering, and less than 0 indicate cellular dispersion. Univariate clustering indicates clustering between cells of the same type (eg, whether cell-type A tends to be clustered or dispersed with other type-A cells). Bivariate clustering indicates clustering or dispersion between cells of different types (eg, whether cell-type A tends to be clustered or dispersed with type-B cells).
In the tumor-core, all immune cells displayed statistically significant univariate clustering with other cells of their same type (CD8: 11.3, p<0.001; FOXP3: 7.1, p<0.001; T-bet: 6.7, p<0.001; CD20: 31.0, p<0.001; CD68: 6.9, p<0.001; CD163: 8.1, p<0.001; CD206: 10.2, p<0.001) (figure 2C). Notably, univariate clustering of CD20 cells in the tumor-core was substantially higher than that of the other immune cell types (p<0.001 for all pairwise comparisons).
At the tumor–stroma interface, a bivariate normalization of the Ripley’s K metric was used, assessing clustering between immune cells and ccRCC tumor cells. This metric effectively tests the immune cell type’s proclivity for clustering into the tumor compartment (values greater than 0), or the stromal compartment (values less than 0), at the tumor–stroma interface. FOXP3 and T-bet cells did not demonstrate significant clustering with tumor cells at this location (interface bivariate nK(75); FOXP3: −0.3, p=0.33; T-bet: 1.3, p=0.25). CD8, CD68, CD163, and CD206 cells demonstrated significant clustering into the tumor compartment (CD8: 2.0, p=0.02; CD68: 8.1, p<0.001; CD163: 4.5, p<0.001; CD206: 7.3, p<0.001). Interestingly, CD20 cells were outliers in this regard and demonstrated significant clustering into the stromal compartment (CD20: −6.25, p<0.001) (figure 2D).
CD163+ TAM stromal clustering at the tumor–stroma interface is associated with decreased survival
In the ccRCC cohort, survival outcomes were determined for each of the mIF-derived cell density and geospatial metrics using median cut-point cohort stratification and false discovery rate (FDR) adjusted multivariable Cox proportional hazards models accounting for patient age and SSIGN score.32 Outcomes included OS, cancer-specific survival (CSS), and recurrence-free survival (RFS).
An example mIF image of a slide with low tumor/CD163 nK(75) at the tumor–stroma interface is displayed in figure 3A. At the tumor–stroma interface, tumor/CD163 nK(75) and CD163 cell density demonstrated poor but statistically significant correlation (R=0.27, p<0.001), demonstrating that these metrics are not redundant (figure 3B).
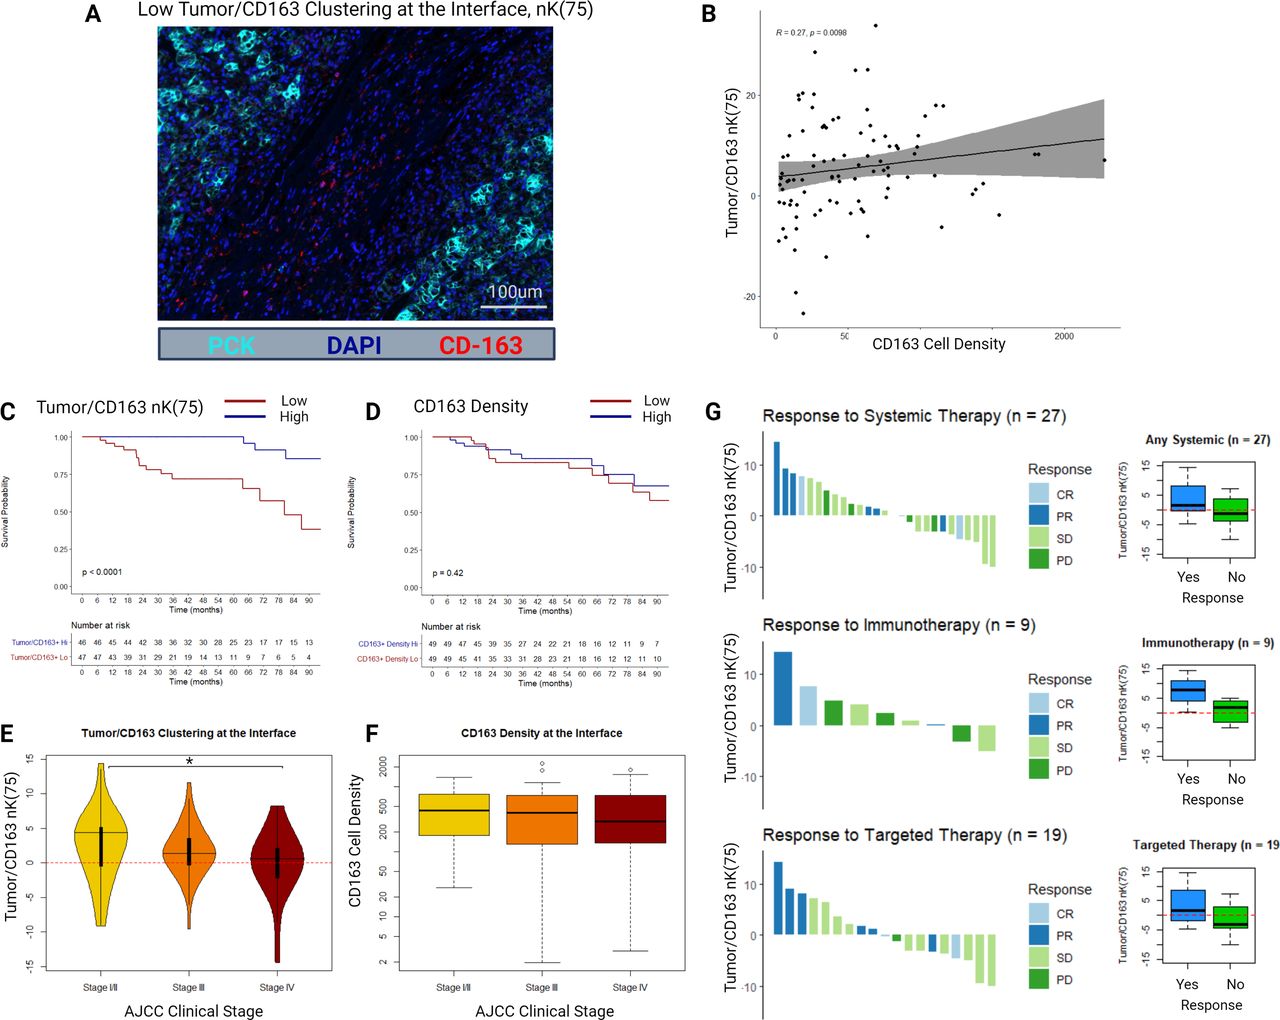
(A) Example multiplex immunofluorescence image of a sample with low tumor/CD163 nK(75). (B) Scatter plot and Spearman’s correlation between CD163+ cell density and tumor/CD163 nK(75) in the tumor–stroma interface histological zone. (C) Kaplan-Meier distributions for overall survival as stratified by the median value of tumor/CD163 nK(75) in the tumor–stroma interface histological zone. (D) Kaplan-Meier distributions for overall survival as stratified by the median value of CD163+ cell density in the tumor–stroma interface histological zone. (E) Tumor/CD163 nK(75) values stratified by AJCC clinical stage at diagnosis. (F) CD163+ cell density values stratified by AJCC clinical stage at diagnosis. (G) RECIST responses to systemic therapy for a subgroup of patients (n=27), either presenting with or developing clinical stage IV ccRCC, who received either systemic immunotherapy or targeted therapy. Adjacent box-plots demonstrate differences in tumor/CD163 nK(75) stratified by therapy response status. ccRCC = clear cell renal cell carcinoma, AJCC = American Joint Committee on Cancer, RECIST = Response Evaluation Criteria in Solid Tumours, CR = Complete Response, PR = Partial Response, SD = Stable Disease, PD = Progressive Disease.
Bivariate clustering between CD163+TAMs and tumor cells at the tumor–stroma interface was strongly associated with OS and CSS. Specifically, patients with higher clustering of CD163+TAMs into the tumor compartment at the tumor–stroma interface had better survival outcomes (tumor/CD163+nK(75): median OS–hi=149 months, lo=86 months, FDR-adj. Cox p<0.001; median CSS–hi=174 months, lo=85 months; FDR-adj. Cox p<0.001) (figure 3C). CD163+cell density was not associated with OS or CSS (figure 3D). None of the mIF density or geospatial clustering metrics were associated with RFS on the FDR-adjusted Cox proportional hazards regression (online supplemental table 2).
When stratified into AJCC clinical stage, median tumor/CD163+nK(75) at the interface decreased in a stepwise fashion (stage I/II: 4.4 (IQR −0.5 to 5.1); stage III: 1.4 (IQR −0.3 to 3.5); stage IV: 0.6 (IQR −2.1 to 2.1); p=0.04 between stage I/II and stage IV), while median CD163+cell density at the interface was similar across clinical stages (stage I/II: 431 cells/mm2 (IQR 178–762); stage III: 398 cells/mm2 (IQR 130–735); stage IV: 289 cells/mm2 (IQR 137–703); p>0.2 for all comparisons) (figure 3E,F).
We further examined a small subset of 27 patients in the cohort who had advanced ccRCC and received systemic targeted therapy (n=19) or immunotherapy (n=9), with one patient receiving combination targeted and immunotherapy. This small cohort was underpowered to identify statistically significant differences between groups. Per RECIST response criteria, patients who responded to therapy had higher median tumor/CD163+nK(75) values than those who did not respond (1.5 vs −1.2, respectively; p=0.10), particularly in the immunotherapy subgroup (7.7 vs 1.7, respectively; p=0.20), though these differences were not statistically significant (figure 3G).
CD163+ TAM interface clustering gene expression score
A CD163 clustering differential gene expression score was developed using bulk RNA-seq data and tumor/CD163+nK(75) values at the tumor–stroma interface in our cohort. The expression score was trained within our cohort, filtering for protein-coding genes correlated with tumor/CD163+nK(75) with r2 (Spearman’s) > 0.3, median expression >0, and range >1, resulting in 20 identified genes (figure 4A and online supplemental table 3). The genes were grouped into positively or negatively correlated gene groups. For validation in external cohorts, the ratio of geometric mean expression between the positive to negative correlation groups was used as an expression score. The resultant CD163 Clustering Score was then applied to RNA-seq data from patients with ccRCC identified in four independent external ccRCC cohorts: the TCGA KIRC cohort (all stages), the JAVELIN Renal 101 phase III clinical trial (stage IV), the IMmotion151 phase III clinical trial (stage IV), and the IMmotion150 phase II clinical trial (stage IV). Higher expression scores reflect higher tumor/CD163+nK(75) values, indicating clustering of CD163+TAMs into the tumor compartment at the tumor–stroma interface.
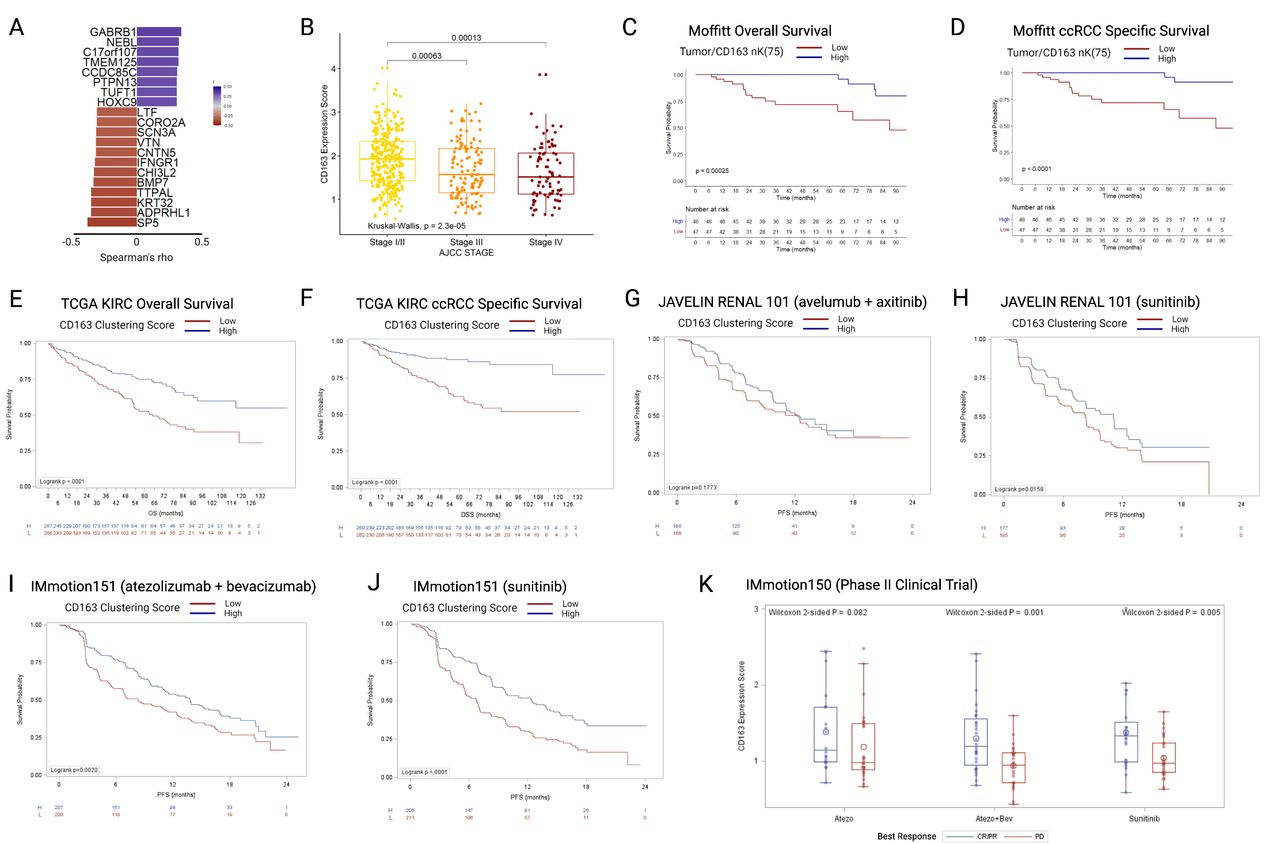
(A) Twenty genes included in the CD163 clustering gene expression score, ordered by Spearman correlations with tumor/CD163 nK(75) values, all p>0.001. (B) TCGA KIRC cohort (N=530), boxplots depicting gene CD163 clustering gene expression score by AJCC clinical stage. (C) OS in the Moffitt mIF cohort, stratified by the median value of tumor/CD163 nK(75). (D) ccRCC specific survival in the Moffitt mIF cohort, stratified by the median value of tumor/CD163 nK(75). (E) OS in the TCGA KIRC cohort, stratified by the median value of CD163 clustering gene expression score. (F) ccRCC-specific survival in the TCGA KIRC cohort, stratified by CD163 clustering gene expression score. (G) PFS in the JAVELIN Renal 101 RCT avelumab+axitinib arm, stratified by CD163 clustering gene expression score. (H) PFS in the JAVELIN Renal 101 RCT sunitinib arm, stratified by CD163 clustering gene expression score. (I) PFS in the IMmotion151 RCT atezo+bev arm, stratified by CD163 clustering gene expression score. (J) PFS in the IMmotion151 RCT sunitinib arm, stratified by CD163 clustering gene expression score. (K) CD163 clustering gene expression score in the three arms of the IMmotion150 trial, stratified by best treatment response. ccRCC = clear cell renal cell carcinoma; mIF = multiplex immunofluorescence; OS = overall survival; PFS = progression-free survival, TCGA-KIRC = The Cancer Genome Atlas Kidney Renal Clear Cell Carcinoma.
In the TCGA KIRC cohort (n=533, median CD163 clustering expression was significantly higher in patients with AJCC clinical stage I/II tumors versus those with stage III or stage IV (stage I/II: 1.9 (IQR 1.4–2.3; stage III: 1.6 (IQR 1.1–2.2); stage IV: 1.5 (IQR 1.1–2.1)) (figure 4B), similarly to the result seen for tumor/CD163+nK(75) in the mIF cohort (figure 3E). When stratified by the median, patients with low CD163 clustering expression scores had substantially worse OS (log-rank p<0.0001), in a similar manner to that seen for Tumor/CD163+nK(75) in the mIF cohort (figure 4C,E). Likewise, patients with low CD163 clustering expression scores had substantially worse ccRCC specific survival (log-rank p<0.0001), in a similar manner to that seen for tumor/CD163+nK(75) in the mIF cohort (figure 4D,F).
The CD163 clustering score was then applied to three independent clinical trial cohorts of patients with stage IV ccRCC, undergoing active systemic treatment on a trial protocol. In the JAVELIN Renal 101 trial, no significant difference was identified in the avelumab+axitinib arm (log-rank p=0.177) (figure 4G), but in the sunitinib arm patients with low CD163 clustering scores has worse OS (log-rank p=0.016) (figure 4H). In the IMmotion151 phase III randomized clinical trial, patients with low CD163 clustering scores has worsened survival in both treatment arms (atezolizumab+bevacizumab arm: log-rank p=0.002; sunitinib arm: log-rank p<0.0001) (figure 4I,J). In the IMmotion150 phase II clinical trial, non-responders to treatment (best-response: progressive disease) had significantly lower CD163 clustering scores in two out of three treatment arms (Wilcoxon test; atezolizumab: p=0.082; atezolizumab+bevacizumab: p=0.001; sunitinib: p=0.005) (figure 4K).
CD8+ interface clustering versus conventional CD8+ inflamed, desert, and excluded categories
Example mIF images demonstrating high and low bivariate tumor/CD8 clustering at the tumor–stroma interface are depicted in figure 5A. High bivariate clustering between CD8+T cells and tumor cells at the tumor–stroma interface was strongly associated with improved OS and CSS (tumor/CD8+nK(75): median OS–hi=149 months, lo=68 months, FDR-adj. p<0.001; median CSS–hi=174 months, lo=69 months, FDR-adj. Cox p<0.001) (figure 5B).

(A) Example multiplex immunofluorescence images of a samples with high and low tumor/CD8 nK(75). (B) Kaplan-Meier distributions for overall survival as stratified by the median value of tumor/CD8 nK(75) in the tumor–stroma interface histological zone. (C) Kaplan-Meier distributions for overall survival as stratified by the median value of CD8+ cell density derived infiltration, exclusion, and desert status. (D) Stacked bar chart depicting proportions of patients falling in CD8+ cell density derived infiltration, exclusion, and desert groups, stratified by low and high tumor/CD8 nK(75) values. (E) Scatter plot and Spearman’s correlation comparing tumor/CD8 nK(75) and tumor/CD163 nK(75), overlaid with groupings by CD8-CD163 co-localization status. Purple dotted line is the median value for tumor/CD163 nK(75), green dotted line is the median value for tumor/CD8 nK(75). (F) Kaplan-Meier distributions for overall survival, as stratified by CD8-CD163 co-localizations status. (G) Proportion of patients diagnosed with AJCC clinical stage IV ccRCC, stratified by CD8-CD163 co-localization status. (H) RECIST responses to systemic therapy for a subgroup of patients (n=27), either presenting with or developing clinical stage IV ccRCC, who received either systemic immunotherapy or targeted therapy. ccRCC = clear cell renal cell carcinoma, PCK = Pan-cytokeratin, AJCC = American Joint Committee on Cancer, RECIST = Response Evaluation Criteria in Solid Tumours, CR = Complete Response, PR = Partial Response, SD = Stable Disease, PD = Progressive Disease.
Patients with ccRCC were stratified into conventional CD8+ inflamed, desert, and excluded categories based on differential cell-density within the tumor-core and stromal histological zones, as previously described.16 Kaplan-Meier (K-M) estimates did not identify an association between these categorizations and OS (log-rank p=0.13) (figure 5C). Patients classified as having high stromal clustering of CD8+ cells at the tumor–stroma interface had an even distribution of classification into the inflamed, excluded, and desert categories (n=17, 15, and 12, respectively), whereas patients classified as having CD8+ cells clustered into the tumor compartment at the tumor–stroma interface were heavily skewed toward the inflamed category (inflamed=31 patients, excluded=4, desert=9) (figure 5D).
Stromal co-localization of CD163+ TAMs and CD8+ T-cells at the tumor–stroma interface
Tumor/CD8+and tumor/CD163+nK(75) were weakly correlated among all patients with ccRCCs (Spearman’s r=0.22, p=0.05; figure 5E). Patients were then stratified by concordance of geospatial clustering of CD8+and CD163+ cells at the tumor–stroma interface. If both cell-types demonstrated clustering into the tumor compartment, they were determined to be ‘co-localized in the tumor’, if both were clustered into the stromal compartment they were ‘co-localized in the stroma’, and other samples were not considered to demonstrate co-localization (figure 5E).
OS was substantially worse for patients with CD8+/CD163+ stromal co-localization and improved in a stepwise manner for patients with no-colocalization, followed by patients with CD8+/CD163+tumor co-localization who had favorable OS (median OS: 64 months, 116 months, 178 months, respectively; log-rank p<0.001)(figure 5F). Patients with CD8+/CD163+stromal co-localization had a higher proportion who presented with AJCC clinical stage IV (7/21 patients, 33.3%), as compared with patients with CD8+/CD163+ tumor co-localization (4/22 patients, 18.2%) (figure 5G). Of the 27 patients who received systemic targeted or immunotherapy, 6 patients had CD8+/CD163+ stromal co-localization, and none responded to therapy (0/6 patients, 0%), as compared with 5 out of 14 responding in the no-colocalization group (35.7%), and 4 out of 7 patients responding in the CD8+/CD163+tumor co-localization group (57.1%) (figure 5H). Similarly, for the subgroup of patients who received immunotherapy 0/2 patients responded in the CD8+/CD163+stromal co-localization group (0%), 2/4 patients responded in the no co-localization group (50%), and 2/3 patients responded in the CD8+/CD163+tumor co-localization group (66.6%).
CD163+ TAM stromal clustering at the tumor–stroma interface is associated with CD8+ T-cell terminal exhaustion
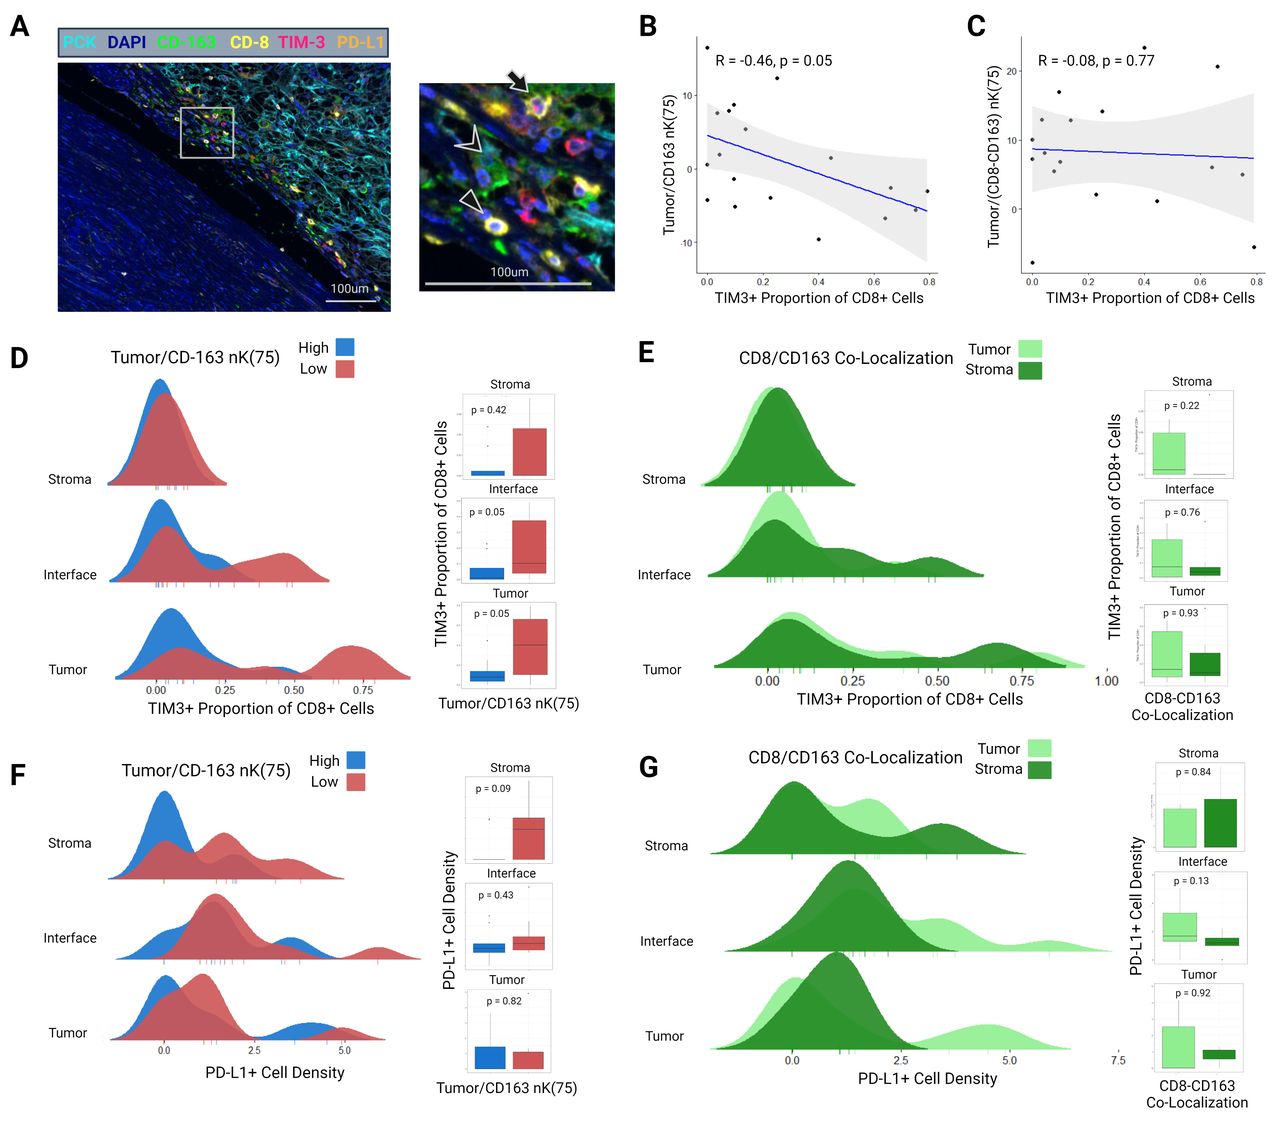
Grounded in the above findings, an exploratory mIF panel was performed to determine associations between CD163+TAM clustering and CD8+/CD163+co-localization with immune cell exhaustion. Eighteen patients with adequate density of CD8+ and CD163+ immune cells (>10 cells per region of interest (ROI)) were selected for this panel from the initial cohort. The gross specimens were reprocessed and ROIs selected in identical fashion as the first two panels, with unique ROI locations. This panel included pan-cytokeratin (PCK), 4′,6-diamidino-2-phenylindole (DAPI), CD163, TIM-3 (a marker of CD8+T cell terminal exhaustion), and PD-L1 (figure 6A).

(A) Example multiplex immunofluorescence image of a sample from the exploratory third panel including stains for PCK, DAPI, CD163, CD8, TIM-3, and PD-L1. Image is taken from the tumor–stroma interface. In the magnified region, the triangle indicates a CD8+TIM3 cell, chevron indicates a CD163+ cell, and the arrow indicates a CD8+TIM3+ cell. (B) Spearman’s correlation between interface tumor/CD163 nK(75) and the proportion of CD8+ cells expressing TIM-3. (C) Spearman’s correlation between interface tumor/(CD8-CD163) nK(75) (ie, CD8/CD163 interface co-localization) and the proportion of CD8+ cells expressing TIM-3. (D) Ridgeline distribution density plots demonstrating the proportion of CD8+ cells expressing TIM-3 in the tumor-core, tumor–stroma interface, and stromal zones, stratified by tumor/CD163 nK(75) status. Adjacent boxplots with Wilcoxon p values correspond to the ridgeline density plots. (E) Ridgeline distribution density plots demonstrating the proportion of CD8+ cells expressing TIM-3 in the tumor-core, tumor–stroma interface, and stromal zones, stratified by CD8/CD163 co-localization status. Adjacent boxplots with Wilcoxon p values correspond to the ridgeline density plots. (F) Ridgeline distribution density plots demonstrating PD-L1 density in the tumor-core, tumor–stroma interface, and stromal zones, stratified by Tumor/CD163 nK(75) status. Adjacent boxplots with Wilcoxon p values correspond to the ridgeline density plots. (G) Present cellular clusterin ridgeline distribution density plots demonstrating PD-L1 density in the tumor-core, tumor–stroma interface, and stromal zones, stratified by CD8/CD163 co-localization status. Adjacent boxplots with Wilcoxon p values correspond to the ridgeline density plots. PCK, pan-cytokeratin.
When analyzed as a continuous variable, tumor/CD163+nK(75) at the tumor–stroma interface was negatively correlated with the TIM-3+proportion of CD8+ cells (Spearman’s r=−0.46; p=0.05) (figure 6B). CD8+/CD163+co-localization at the tumor–stroma interface was not correlated with the TIM-3+ proportion of CD 8+cells (r=−0.08; p=0.77) (figure 6C). When categorized into high and low groups, the TIM-3+proportion of CD8+ cells was higher in patients with low tumor/CD163+nK(75) within the tumor-core and tumor–stroma interface (tumor-core: 0.07 (IQR 0.04–0.14) vs 0.40 (IQR 0.15–0.66), p=0.05; tumor–stroma interface: 0.02 (IQR 0–0.08) vs 0.11 (IQR 0.04–0.37); p=0.05) (figure 6D). No such association was identified between CD8+/CD163+ co-localization high and low groups and the TIM-3+ proportion of CD8+ cells (figure 6E). No statistically significant associations were identified between tumor/CD163+nK(75) or CD8+/CD163+ co-localization and PD-L1+ cell density (figure 6F,G).
Supplemental analyses
Additional supplemental correlative analyses were performed assessing the effect of recurrent somatic mutations on tumor-core immune cell density (online supplemental figure 2), RNA-seq-based immune cell deconvolution using xCell score (online supplemental figure 3), as well as angiogenesis and T-effector gene signatures as described in the IMmotion150 trial (online supplemental figure 4). Several sensitivity analyses were conducted (online supplemental figures 5–8). A written description can be found in online supplemental results.
Supplemental material
Discussion
Leveraging mIF, digital pathological image analysis, and empirical geospatial clustering models, we outlined a global view of immune cell spatial distribution within the RCC microenvironment and identified highly specific cellular distributions that were significantly associated with clinical outcomes. Namely, clustering of M2-like CD163+ macrophages and CD8+T cells into the stromal compartment at the tumor–stromal interface was associated with more advanced clinical stage and significantly worsened OS and CSS. Given the lack of publicly available spatial coordinate data in ccRCC, these findings were independently validated by developing an RNA-seq gene signature score which was applied to several clinical trials of immunotherapy in patients with metastatic ccRCC. In addition, clustering of M2-like CD163+macrophages into the stromal compartment at the tumor–stromal interface was associated with a higher proportion of CD8+T cells expressing TIM-3, suggestive of terminal exhaustion. To our knowledge, this report is the first to describe these spatial dynamics and their clinical associations in RCC.
M2-like macrophages are increasingly being recognized as an important a protumor component of the RCC TIME.20 29 33 34 In contrast with proinflammatory M1-polarized macrophages, M2-like TAMs are associated with tissue remodeling, secreting a variety of growth factors and proteases, and have consistently been implicated in conferring a protumor effect on the TIME.34 A landmark mass cytometry study of the RCC TIME by Chevrier et al identified that a specific macrophage cluster, labeled as M-11, was associated with more advanced disease.17 The most specific surface marker for cluster M-11 was CD163, a high affinity scavenger receptor that is a classical marker of M2-like TAMs.17 33 Recent scRNA-seq studies have further associated M2-like TAMs with poor clinical outcomes, and implicated these cells in switching tissue-resident CD8+ cells into a terminally exhausted state via specific receptor–ligand interactions.20–22
Most hypothesized mechanisms for the M2-like TAM protumor effect rely on close proximity to their effector cell, and as such we aimed to associate measures of geospatial TAM clustering with clinical outcomes. Previous work by our group identified worse OS in patients with increased interface clustering of tumor cells and CD68+TAMs in a small cohort of patients with metastatic ccRCC who subsequently received IT, further supporting the notion that TAM spatial distribution can affect outcomes.28 In this study, we identified more advanced clinical stage and substantially worse OS and CSS for patients with CD163+M2 like TAMs clustered into the stromal compartment at the tumor–stroma interface.
In light of recent studies highlighting immunosuppressive receptor–ligand interactions between CD8+T cells and M2-like TAMs, we stratified patients by co-localization of CD8+and CD163+ immune cells at the tumor–stroma interface, and found that co-localization of these cells in the stromal compartment was associated with poor clinical outcomes, as compared with co-localization in the tumor compartment.20 Furthermore, an exploratory third mIF panel was designed and performed to assess associations between these metrics and immune microenvironment exhaustion. Indeed, we identified that patients with CD163+ clustering in the stromal compartment also exhibited a high proportion of CD8+T cells expressing TIM-3, an indication of terminal exhaustion.
The biological underpinnings of this association are unclear but could be driven by an environmental niche in the stromal compartment that favors receptor–ligand interactions between CD8+T cells and CD163+TAMs, potentiating their immunosuppressive pro-tumor effect. This hypothesis is supported by a 2018 study by Peranzoni et al, who demonstrated that CD8+T cells develop impeded motility and poor tumor migration after coming in direct contact with stromal TAMs, a high proportion of which expressed CD163.27 CD8+T cell motility and tumor migration was then restored following depletion of stromal TAMs from the specimen.27 In addition, studies have consistently shown that elimination of myeloid-derived suppressor cells from the ccRCC TIME results in enhancement of antitumor T-cell infiltration and effect.35 36 Our findings imply that these CD8-TAM geospatial interactions within the stromal compartment at the tumor–stroma interface may translate to substantial clinical impact. Further study will be necessary to elucidate the exact nature of these interactions.
Another interesting finding in this analysis was that patients with high clustering of CD8+T cells into the stromal compartment at the tumor–stroma interface has worse OS and CSS. Infiltration of CD8+T cells has been associated with improved ICI response and OS in several primary solid tumors but has been paradoxically associated with poor clinical outcomes in RCC.16 In this study, no OS associations were identified using conventional CD8+ metrics stratifying patients into ‘inflamed’, ‘“desert’, and ‘excluded’ categories by their differential tumor-core and stroma CD8+ immune cell densities. However, significantly worse OS was seen in patients with CD8+ clustering into the stromal compartment at the tumor–stromal interface, a cellular distribution that is conceptually in-line with immune cell exclusion. Further study is needed to validate this finding in external cohorts, but it is possible that bivariate geospatial clustering metrics measured at the tumor–stromal interface result in a more accurate and biologically meaningful framework for determining immune cell exclusion.
Notably, the CD163 Clustering gene signature (figure 4) identified several intriguing genes that have been previously implicated in cancer biology (online supplemental table 3). The most interesting of which is IFNGR1, the gene coding for interferon-gamma receptor 1, the primary receptor for the IFN-γ cytokine. Increased expression of IFNGR1 was negatively associated with the CD163 clustering gene signature, which corresponds to CD163 stromal compartment clustering at the tumor–stroma interface, and worse prognosis. Previous research has identified IFN-γ as a critical cytokine for switching immunosuppressive M2 polarized TAMs into an M1 phenotype, inducing an antitumor immune response.37 In addition, loss of the IFN-γ pathway has been shown to confer resistance to anti-CTLA-4 checkpoint blockade in metastatic melanoma.38 It is plausible that increased IFNGR1 expression in our cohort is indicative of receptor upregulation in response to a shortage of the IFN-γ cytokine. Further study is necessary to correlate IFN-γ cytokine and receptor dynamics with geospatial immune cell distributions.
Future directions for this research will aim to ameliorate the limitations to the present analysis, while expanding on the most clinically pertinent cohort. The cohort of clinical stage IV patients was not large enough (n=27) to adequately address the question of clinical response, particularly in the IT subgroup (n=9). Further efforts will be devoted to a larger cohort of patients with stage IV disease, including M2-like TAM and CD8+ exhaustion markers in the same mIF panel, as to directly measure the geospatial clustering between these cells in a larger population. Furthermore, spatial transcriptomic analysis would certainly build on these marker-based findings, associating geospatial distributions with specific RNA transcripts and signatures, while potentially identifying specific receptor–ligand interactions governing the immunosuppressive TAM-CD8 dynamic.
Methods
Patient and sample selection
We obtained 97 primary tumor samples from patients with ccRCC, and 5 tissue samples from normal kidneys, from the years 2004 to 2018. Samples were obtained via surgical excision. Written informed consent was obtained from all tissue donors. Patients were included in this study if they provided written consent to the molecular characterization of their tissue and did not receive any systemic therapy prior to tissue collection.
Multiplex immunofluorescence
Prior to mIF, tissue blocks were prepared, and an experienced genitourinary pathologist (JD) reviewed each slide obtained from macrodissected formalin-fixed paraffin-embedded tissue samples and annotated seven spatially distinct ROIs from three predetermined tumor zones: two ROIs from the tumor core, three from the tumor–stroma interface, and two from the stroma. The tumor-core ROIs studied were selected regions with high tumor cell content, and without evidence of grossly necrotic tissue. The tumor–stroma interface ROIs were selected to contain approximately equal parts of tumor and stromal tissue. Section thickness was 4 um.
Tissue samples were then stained using the PerkinElmer OPAL 7 Color Automation Immunohistochemistry Kit (PerkinElmer, Waltham, MA) on the BOND RX Autostainer (Leica Biosystems, Vista, California, USA). In brief, tissue slides were sequentially stained in two panels using antibodies against CD3, CD8, CD20, CD68, CD163, CD206, forkhead box P3 (FOXP3), T-box transcription factor TBX21 (T-Bet; a T-box protein expressed in T cells), epidermal growth factor receptor (EGFR), and programmed death-ligand 1 (PD-L1). These markers were selected for their previously demonstrated frequency in ccRCC.17
All subsequent steps, including deparaffinization, antigen retrieval, and staining, were performed using the OPAL manufacturer’s protocol. PCK and DAPI counterstaining were applied to all slides, and imaging was performed using the Vectra3 Automated Quantitative Pathology Imaging System (Akoya Biosciences). Importantly, PCK was applied only after confirmation of tumor content by examination of H and E images for each ROI. Multilayer TIFF images were exported from InForm (PerkinElmer) and loaded into HALO (Indica Labs, Albuquerque, New Mexico, USA) for quantitative image analyses.39 The size of the ROIs was standardized at 1356×1012 pixels, with a resolution of 0.5 µm/pixel, for a total surface area of 0.343 mm2. Using HALO, for each staining marker a positivity threshold within either the nucleus or cytoplasm was set based on previously published staining patterns and visual intensities.40 41 The entire image set was analyzed with the same algorithm. Representative images with and without masking are included in online supplemental figure 9. From this analysis, generated data included the total cell count, positive cell counts for each IF marker, fluorescence intensity of every individual cell, percent of cells that were positive for each marker, and Cartesian coordinates for their location in the ROI image.
A third exploratory panel was designed based on the results of the initial analysis, using antibodies against DAPI, PCK, CD8, CD163, TIM-3, and PD-L1, using 18 samples from the initial cohort with CD8 and CD163 cell densities adequate for geospatial analysis. All steps for tissue preparation, ROI selection, and image analysis, were identical to those in the first two panels. Online supplemental table 3 details the markers used in each of the three panels.
Geospatial analysis
For each ROI in our IF analysis, cell density was determined for each IF marker and for a subset of dual-positive markers. For each sample, ROI cell densities were averaged within each tumor zone (tumor core, stroma, and tumor–stroma interface) such that one density value remained for each zone in each sample. This stratification allows for broad macrolevel comparisons of immune cell densities across each tumor zone. For the geospatial analysis, cells were classified as single-mark using a hierarchy favoring the more specific marker when dual-staining was present. PD-L1 positivity was described on PCK+cells, excluding dual-staining with immune markers.
A quantitative framework leveraging Ripley’s K estimates, a methodology for quantifying spatial heterogeneity most commonly used in ecology and economics, was used to assess complex local geospatial relationships among tumor cells, stromal cells, and immune cells.42 ROIs containing ≥10 cells positive for a relevant marker were considered eligible for spatial analysis. As there is no previously validated standard for this cut-off, the ≥10 cell cut-off was agreed on through consensus of the authors, as it yields >40 pairwise cell-cell distances for analysis, allowing for an accurate estimation of a continuous distribution from a discrete one.43
The Ripley’s K function (K(r)) measures the number of points within a search-circle containing a point at its center, repeating this process for each point of interest and summating/averaging the results, then repeating this process across a range of search-circle radii (r).42 44 The resultant distribution can then be compared with an estimated distribution of complete spatial randomness, assuming a Poisson process. Edge correction is necessary to account for points that are near the boundary of the observation window, where a portion of the search-circle falls beyond this boundary.45 46 Isotropic edge correction was used in this study, adjusting the K(r) value by the ratio of the search-circle circumference within and beyond the boundary of the observation window.
K(r) values were determined for each chosen metric within each ROI, using isotropic edge correction, and the following normalization was applied :  , which is sometimes described as either the ‘H-function’ or ‘L(r)–r’.44 47 This normalization is an improvement of the naïve Ripley’s K function in that the expected value of nK(r), reflecting complete spatial randomness and assuming a Poisson process, is 0 across all values of r, facilitating interpretation and comparison of the results across values of r. After application of this normalization the expected variance for complete spatial randomness becomes relatively consistent across all values of r. Values of nK(r) >0 represent cellular clustering and values <0 represent cellular dispersion. The theoretical range of possible nK(r) values is negative infinity to positive infinity. A one-sample Wilcoxon signed-rank test can be used to compare the nK(r) value for a group of samples at any given radius to 0, the expected value of complete spatial randomness.
nK(r) can be applied in a univariate (ex: assessing clustering among cell-type A with other cell-type A cells) or bivariate (ex: clustering of cell-type A with cell-type B) manner. In the tumor-core and stromal zones, univariate clustering was used for each IF-marker. At the tumor–stroma interface, bivariate clustering with tumor cells was assessed for each IF-marker, to assess the affinity for the marked immune cells to exist in the tumor or stromal compartment in this zone. Bivariate clustering metrics can accommodate instances where multiple interfaces exist in the same image, which was occasionally present in our samples. A radius of 75 um was selected (accommodating approximately 3 ccRCC tumor cells) to reflect clustering in the vicinity of the cell of interest.
Conventional inflamed, desert, and excluded phenotypes were used as a comparison to the geospatial analysis of CD8+T cells. As per commonly reported conventions, these categories were based on differential cell density of CD8+ cells within the tumor-core and stroma, ignoring the interface regions.16 Median cut-points were utilized. Immune desert is defined as low density in both tumor and stromal regions. Exclusion is defined as low tumor density with high stromal density. Any sample with high tumor density is defined as inflamed.
All spatial analysis was conducted using the spatstat package for R statistical computing software.46
CD163+ interface clustering gene expression score
An exploratory analysis regarding differential gene expression was performed as it related to Tumor/CD163+nK(75) at the tumor–stroma interface, as this was the strongest predictor of OS and clinical stage in our cohort and is directly relevant to the currently accepted model of immunotherapy response and resistance in ccRCC.
Eighty-one samples had overlapping RNA-seq and mIF data. From an initial set of 23 595 unique genes, the correlation between each gene and tumor/CD163+nK(75) was calculated, resulting in 20 unique protein-coding genes (figure 4A and online supplemental table 4) with an r2 (Spearman) >0.3 or, median expression >0 and a range larger than 1. This filtering ensures that the genes are expressed in most samples and that they have a range larger than 1 log2 units.
In independent external RNA-seq cohorts, these 20 genes were used in a gene signature for tumor/CD163+nK(75). Genes were split into positively and negatively correlated gene groups, and a ratio of the geometric mean expression of the positive to negatively correlated gene groups was used as an expression score. Higher values of the resultant CD163 clustering score indicate higher tumor/CD163 nK(75), or more clustering of CD163+TAMs into the tumor compartment at the tumor–stroma interface. This method was used in the TCGA KIRC (The Cancer Genome Atlas Kidney Renal Clear Cell Carcinoma) cohort (n=533), including all clinical stages, stratifying the CD163 clustering score by the median for the OS analysis, then using this value for dichotomization in further analyses in the remaining external cohorts. To address whether the score was applicable to patients with advanced cancer receiving systemic therapy, this same score was then applied to three additional independent clinical trial cohorts: the JAVELIN Renal 101 phase III clinical trial (n=726), IMmotion151 phase III clinical trial (n=823), and the IMmotion150 phase II clinical trial (n=151).
Statistical analysis
Cell densities and spatial metrics were abstracted as described above. Correlations were weakly negative between univariate nK(75) metrics and their corresponding marked-cell densities (−0.30 to −0.10), and correlations were consistently poor between bivariate nK(75) metrics and their corresponding marked-cell densities (−0.10 to 0.10), confirming that the nK(75) and density metrics were supplying distinct information from one another. Thus, we proceeded with treating cellular density and geospatial clustering as distinct metrics for the remainder of the analysis.
Between-groups comparisons were made using Wilcoxon signed-rank testing. When one comparator group had <5 samples, such as the somatic mutation analysis, p values were generated by performing a randomization t-test based on 10,000 permutations. Cell densities were compared across the three studied histological zones (tumor-core, stroma, and tumor–stroma interface). Both univariate and bivariate geospatial metrics were compared with the value for complete spatial randomness, zero, within marked-cell types using a one-sample Wilcoxon signed-rank test, and between marked-cell types using a two-sample Wilcoxon signed-rank test.
The survival analysis was primarily conducted using an FDR adjusted multivariable Cox proportional hazards regressing using age and SSIGN (Stage, Size, Grade and Necrosis) score as covariates. Outcomes tested were OS from date of diagnosis to censoring or death at last follow-up, kidney CSS from date of diagnosis to censoring or death at last follow-up, and RFS for patients who did not present with metastatic disease. K-M curves were used to visualize survival functions. A subgroup of patients with AJCC (American Joint Committee on Cancer) stage IV disease (n=27) received systemic targeted therapy (n=19) or immunotherapy (n=9). Response to therapy was determined per RECIST (Response Evaluation Criteria in Solid Tumours) 1.1 radiographic criteria.48
Statistical significance was defined as a two-tailed α<0.05. All statistical analyses were conducted using R statistical software V.4.0.2 (Vienna, Austria) or SAS V.9.4 (SAS Institute).
Additional information regarding the methodology can be found in the Supplementary Methods, Supplementary RNAseq Methods, and Supplementary WES Methods. Additionally a Full Gene List, Key Resources Table, and example mIF Images have been made available to accompany this manuscript.
Translational relevance
Clear cell RCC (ccRCC) is clinically unique—boasting a favorable response profile to immunotherapy while harboring a relatively low TMB, with many studies paradoxically associating CD8+ T-cell infiltration with worse prognosis. Recent studies have implicated M2-like TAMs with inducing CD8+ T-cells into a terminally exhausted state, partially explaining this paradox. Developing therapies to increase immunotherapy response in ccRCC depends on a more detailed understanding of these biological processes. We sought to elucidate these TAM-CD8+ interactions within the ccRCC TIME by adapting a geospatial framework borrowed from the field of ecology to analyze mIF samples. We found that patients have poor clinical outcomes when M2-like TAMs are clustered into the stromal compartment at the tumor–stroma interface, and when co-localized with CD8+ T-cells in this location. In addition, this specific geospatial pattern of M2-like TAMs was associated with CD8+ T-cell terminal exhaustion. These findings suggest that TAM-CD8+ interactions within the ccRCC tumor microenvironment are influenced by geospatial relationships in addition to cellular phenotype.
Supplemental material
Supplemental material
Supplemental material
Supplemental material
Supplemental material
Supplemental material
Supplemental material
Data availability statement
Data are available on reasonable request. Code Availability Statement: The code used to complete this analysis is available in the supplemental material. Any additional requested code may be obtained from the corresponding author (NC) on reasonable request.
Ethics statements
Patient consent for publication
Ethics approval
This study involves human participants and was approved by H. Lee Moffitt Cancer Center and Research Institute’s Total Cancer Care protocol; Advarra IRB Pro00014441. Participants gave informed consent to participate in the study before taking part.
Acknowledgments
This study was supported by the Molecular Genomics, Tissue Core, and Biostatistics and Bioinformatics Shared Resources at the H. Lee Moffitt Cancer Center and Research Institute, an NCI designated Comprehensive Cancer Center (P30-CA076292).
References
Supplementary materials
Supplementary Data
This web only file has been produced by the BMJ Publishing Group from an electronic file supplied by the author(s) and has not been edited for content.
Footnotes
Twitter @jchahoud, @evolsci
Contributors Conception of study: BJM, JJM, PMA and NHC. Tissue analysis: JN, CM-S, DS-V, NL-B, MF and JD. Data Analysis: NHC, YK, AB, AC, GJK, PR, DJ, JKT, FK and PMA. Manuscript construction: NHC, AC, AH, JC, PES, LW, AAH, PMA, JJM and BJM. There were no non-author contributors.
NHC accepts full responsibility for the work and/or the conduct of the study, had access to the data, and controlled the decision to publish.
Funding The described analysis was directly funded by a Department of Defense US Army Medical Research Acquisition Activity grant (KC180139), and a Moffitt Cancer Center Genitourinary Oncology Fellowship Research grant (09-33494-22-01).
Competing interests The corresponding author certifies that all conflicts of interest, including specific financial interests and relationships and affiliations relevant to the subject matter or materials discussed in the manuscript (ie. employment/affiliation, grants or funding, consultancies, honoraria, stock ownership or options, expert testimony, royalties, or patents filed, received, or pending), are the following: NC, YK, AB, AC, GJK, AH, JN, CM-S, DS-V, ENK, NL-B, PR, MF, DJ, LW, JD, JKT, JD, PMA, and AAH have no disclosures; BJM is an NCCN Kidney Cancer Panel Member and an advisor for Merck; PES is an NCCN Bladder and Penile Cancer Panel Member and Vice-Chair; JJM is Associate Center Director at Moffitt Cancer Center, has ownership interest in Aleta Biotherapeutics, CG Oncology, Turnstone Biologics, Ankyra Therapeutics, and AffyImmune Therapeutics, and is a paid consultant/paid advisory board member for ONCoPEP, CG Oncology, Mersana Therapeutics, Turnstone Biologics, Vault Pharma, Ankyra Therapeutics, AffyImmune Therapeutics, UbiVac, Vycellix, and Aleta Biotherapeutics.
Provenance and peer review Not commissioned; externally peer reviewed.
Supplemental material This content has been supplied by the author(s). It has not been vetted by BMJ Publishing Group Limited (BMJ) and may not have been peer-reviewed. Any opinions or recommendations discussed are solely those of the author(s) and are not endorsed by BMJ. BMJ disclaims all liability and responsibility arising from any reliance placed on the content. Where the content includes any translated material, BMJ does not warrant the accuracy and reliability of the translations (including but not limited to local regulations, clinical guidelines, terminology, drug names and drug dosages), and is not responsible for any error and/or omissions arising from translation and adaptation or otherwise.