Article Text

Abstract
Background Studies evaluating peripheral patient samples show radiation can modulate immune responses, yet the biological changes in human tumors particularly at the cellular level remain largely unknown. Here, we address how radiation treatment shapes the immune compartment and interactions with cancer cells within renal cell carcinoma (RCC) patient tumors.
Methods To identify how radiation shaped the immune compartment and potential immune interactions with tumor cells we evaluated RCC tumors from patients treated only with nephrectomy or with radiation followed by nephrectomy. Spectral flow cytometry using a 35-marker panel was performed on cell suspensions to evaluate protein expression within immune subsets. To reveal how radiation alters programming of immune populations and interactions with tumor cells, we examined transcriptional changes by single-cell RNA sequencing (scRNAseq).
Results Spectral flow cytometry analysis revealed increased levels of early-activated as well as effector programmed cell death protein-1 (PD-1)+ CD8 T-cell subsets within irradiated tumors. Following quality control, scRNAseq of tumor samples from nephrectomy-only or radiation followed by nephrectomy-treated patients generated an atlas containing 34,626 total cells. Transcriptional analysis revealed increased transition from stem-like T-cell populations to effector T cells in irradiated tumors. Interferon (IFN) pathways, that are central to radiation-induced immunogenicity, were enriched in irradiated lymphoid, myeloid, and cancer cell populations. Focused cancer cell analysis showed enhanced antigen presentation and increased predicted TRAIL-mediated and IFN-mediated interactions between tumor cells and the same effector T-cell subsets increased by radiation. TRAIL and IFN pathways enriched in irradiated tumors were associated with survival in patients treated with immunotherapy.
Conclusions These findings identify the source of IFN enrichment within irradiated RCC and reveal heightened levels of PD-1+ CD8+ T-cell subsets and increased probability of interactions with tumor cells following standalone radiation treatment. This study provides a window into the irradiated tumor-immune microenvironment of patients and rationale for treatment combinations.
- Kidney Neoplasms
- Radiotherapy
- Lymphocytes, Tumor-Infiltrating
- Immunomodulation
- Tumor Microenvironment
Data availability statement
Data are available in a public, open access repository. All data relevant to the study are included in the article or uploaded as supplementary information. Single-cell RNA-sequencing data sets generated are available on GEO database (GSE202374). Patient response data were from the European Genome-Phenome Archive (EGA) under accession number EGAS00001002928. Annotated single-cell RNA data sets and TCGA barcodes of all KIRC samples are deposited in GitHub (github.com/JackyLChow/Chow_et_al_JITC_2023). Spectral flow cytometry data are available in ImmPort under access code SDY1998.
This is an open access article distributed in accordance with the Creative Commons Attribution Non Commercial (CC BY-NC 4.0) license, which permits others to distribute, remix, adapt, build upon this work non-commercially, and license their derivative works on different terms, provided the original work is properly cited, appropriate credit is given, any changes made indicated, and the use is non-commercial. See http://creativecommons.org/licenses/by-nc/4.0/.
Statistics from Altmetric.com
WHAT IS ALREADY KNOWN ON THIS TOPIC
Preclinical models have investigated mechanisms for immunostimulatory effects of radiation including vascular remodeling for immune cell infiltration, increased antigen expression, and immunogenic cell death. Certain clinical trials have leveraged these findings to show patient responses to combinations of radiation with immunotherapy, though overall results are mixed.
WHAT THIS STUDY ADDS
Due to the scarcity of on-treatment samples, few studies have examined irradiated human tumors. This limitation occludes the optimization of combination strategies with immunotherapy. Here, we provide compartment-specific analysis of renal cell carcinoma from patients treated with radiation to demonstrate enrichment of critical interferon pathways within immune and tumor cells. We find heightened levels of programmed cell death protein-1+ T-cell populations that include activated and exhausted subsets and increased predicted interferon-mediated interactions between these T-cell populations and tumor cells within irradiated patient tumors.
HOW THIS STUDY MIGHT AFFECT RESEARCH, PRACTICE OR POLICY
These findings offer a glimpse into the cell-specific effects of radiation within the human tumor microenvironment and provide rationale for trials that rely on intratumoral T-cell activity following radiotherapy for patient responses.
Introduction
The results of several encouraging clinical studies using radiation with immunotherapy1–4 have, in part, advanced the opening of over 400 trials that combine a spectrum of immune checkpoint blockade (ICB) and radiation strategies.5–7 Intense investigation of tumor samples from patients treated with standalone ICB or combinations of ICB with radiation has provided insight into the mechanisms of action8 9 and biomarkers of response.10 Yet relatively few studies have examined tumors from patients treated with radiation alone. This gap regarding the isolated effects of radiotherapy in the patient tumor microenvironment obscures rationale towards optimal radiation and immunotherapy regimens.
Recent transcriptional analyses of in situ irradiated patient tumors have begun to shed light on the immunostimulatory effects of radiation.11–15 Findings showing a correlation between interferon (IFN) pathways within the primary tumor and responses at metastatic lesions following ICB treatment,11 strengthen the importance of IFN pathways to CD8+ T cell-mediated effects following radiation as noted in preclinical reports.16 17 However, bulk transcriptional investigation of samples containing pooled stromal, immune, and cancer cell material are unable to resolve the source of signals or relative contributions of each subset. As interest continues to grow regarding synergistic effects between radiation and immunotherapy, there remains a critical need to evaluate how radiotherapy impacts the tumor landscape in patients at the cellular level.
To assess the impact of radiation on the human tumor microenvironment with the resolution necessary for determining compartment-specific effects, we performed high-dimensional, 35-marker spectral flow cytometry of tumors from patients with renal cell carcinoma (RCC) treated with stereotactic body radiation therapy (SBRT). We found increased levels of early-activated as well as effector CD8+ T-cell subsets within irradiated tumors. To provide insight into how radiation remodels immune subsets and interactions with tumor cells, we performed single-cell RNA sequencing (scRNAseq). Across immune classes, we identified increased cell maturation and immunogenic signals from irradiated tumors. Among tumor cells, we observed heightened antigen expression, antigen presentation machinery, and enrichment of IFN pathways within irradiated tumors. Investigation of predicted interactions between effector CD8+ T cells and cancer cells in irradiated RCC revealed enhanced immune-effector expression signals that are associated with survival and response to immunotherapy of patients with RCC.
Materials and methods
Sample preparation
Specimens were dissociated into single-cell suspensions and frozen immediately upon procurement as described.13 All samples (see online supplemental table 1) processed for spectral flow cytometry or scRNAseq were thawed and analyzed on the same day.
Supplemental material
Spectral flow cytometry
Single-cell suspensions were thawed then stained with titered and saturating concentrations of antibodies listed in online supplemental table 2 using FOXP3/transcription factor staining kit (eBiosciences). Samples were acquired on a Cytek Aurora (Cytek Biosciences) flow cytometer (see online supplemental methods).
Analysis was performed using FCS Express 7 software package (De Novo Software, V.7.08.0018). A total of 11 patient samples (6 controls and 5 SBRT, online supplemental table 1) were analyzed for viability and homogeneity. Forty thousand randomly selected cells from each patient were concatenated to a single FCS file. The t-distributed stochastic neighbor embedding (t-SNE) plots were generated using CD45, CD3, CD4, CD8, CD11c, CD14, CD25, CD31, CD33, CD56, CD57, CD68, CD204 and CD261 to identify cell types. For CD8+ T-cell analysis, CD3+, CD8+ cells were extracted and then 10,000 randomly selected cells were concatenated from each patient. Prior to running t-SNE, unsupervised FlowSOM hierarchical clustering was performed using CCR4, CCR5, CCR6, CCR7, CD25, CD27, CD28, CD38, CD45-RA, CD45-RO, CD56, CD57, CD127, CXCR3, CX3CR1, HLA-DR, KI67, LAG3, PD-1, TIGIT, TIM3, and TOX to assign clusters to CD8+ T cells. Multiple cluster numbers were tested, and 15 clusters were chosen for final visualization as they best highlighted the differences in marker expression within subsets. All t-SNE analyses were run with a Barnes-Hut Approximation of 0.50 and a perplexity of 50. Analysis was run for 5,000 iterations. Cluster frequency plot was generated using GraphPad Prism software (V.9.1.2).
RNA sequencing
Samples were stained with LIVE/DEAD Fixable Aqua (Thermo Fisher cat. L34957) and flow sorted for at least 100,000 viable cells. Single-cell libraries were generated using the 10x Genomics 3’ gene expression (V.3) kit. Samples were loaded into the Chromium Controller (10x Genomics) and partitioned into nanoliter-scale gel beads-in-emulsion with a single barcode per cell. Reverse transcription was performed, and the resulting complementary DNA was amplified. Gene expression libraries were generated and evaluated on D1000 screentape using a TapeStation 4200 (Agilent Technologies) and quantitated using Kapa Biosystems PCR quantitation kit for Illumina. They were then pooled, denatured, and diluted to 300pM with 1% PhiX control library added. The resulting pool was loaded into the NovaSeq Reagent cartridge and sequenced on a NovaSeq 6000 (Illumina).
Cell classification (RNA sequencing)
A representative cohort of SBRT samples was selected for scRNAseq based on bulk RNA data.13 Dimensional reductions were determined from the top 500 most variant genes. In all cases, dimensional reduction was calculated with data from all samples pooled together. Uniform Manifold Approximation and Projection (UMAP) and t-SNE coordinates were calculated independently. Each UMAP calculation included the first 50 principal components for a given analysis. Cell classification was made by calculating UMAP coordinates in scater. The first level of categorization was assigned by expression of cell lineage markers in visually determined clusters. Lymphocyte classification was called based on CD3D, CD3E, CD3G, and NKG7 expression, while myeloid cells were called based on CD68 and major histocompatibility complex (MHC)-II expression.
All subclustering was performed using UMAP coordinates as preserved global structure assisted in cluster identification; these are shown in online supplemental figures. Final visualization for main figures were shown using t-SNE coordinates to allow within-cluster resolution that was lost to UMAP compression. Localized gene expression reflects log-normalized counts calculated with scater. For each heatmap, cluster-wise gene expression is the z-score based on scaled log-normalized counts of the cell subset; expression was visualized using the ComplexHeatmap package. Where present, subclass composition was determined by first creating a new data set composed from a random sample of cells from each treatment group towards equal sizes and then comparing the balance within each subclass. Among the population of interest, the data set was first reduced to random subsamples of equal size from each treatment using the sample function in R. All χ2 tests were performed in R on a 2×2 contingency table that distributed cells by treatment group and indicated subclass.
Supplemental material
Differential gene expression analysis
Comparisons of cell populations were calculated between treatments. Zero-counts were dropped before any calculations. Differential gene expression (DGE) was calculated based on log2 counts per million normalized counts using the scater package. Calculations were performed using the limma R package with Benjamini-Hochberg correction. DGE was defined based on an absolute log2 fold change >1 with an adjusted p value<0.05. Pathway enrichment analysis was determined using the ranked-list methods in ReactomePA, clusterProfiler, and fgsea. Pathway enrichment significance was determined based on an adjusted p value<0.05.
Pseudotime analysis
Pseudotime analyses were performed with the slingshot package in R.18 Cell subsets were plotted according to recalculated UMAP coordinates using scater; lineages and curves were calculated in slingshot18; cell lineages by treatment group were visualized using the ggplot2 package; smoothed gene expression of log-normalized counts across lineages and pseudotime was visualized also using ggplot2. Localized expression within the pseudotime UMAP plot was log-normalized counts. Similar to previous analysis for monocyte and macrophage projections,19 a small stray cluster was removed after subclustering. The pseudotime starting node was assigned by high density of cells from classical monocyte subclasses.
Cell interaction analysis
Ligand to receptor and target gene interaction prediction was performed using the nichenetr package (see online supplemental methods).20 Plots were generated with ComplexHeatmap. Source and target cell annotation was determined as follows: average and percent positive for log-normalized counts was calculated for each gene by treatment group and represented by color and size, respectively; DGE was calculated as described above to obtain log2 fold change as well as adjusted p values and were represented by color and size, respectively; expression level by subclass was determined by scaled log-normalized counts.
Analysis of public data sets
Survival analysis was based on data from The Cancer Genome Atlas (TCGA)-KIRC project. Data were retrieved by the TCGAbiolinks package with the following parameters: only tumors with bulk RNA data; STAR—Counts; primary tumors only; tumor stage I–III. IFN-G score was determined by summing scaled expression of IFNG and IFNGR1; TRAIL score was determined by summing scaled expression of TNFSF10 and TNFRSF10A. The score threshold for ‘hi’ was being among the top 70% for the given score; this put approximately 50% of samples into the IFN-G hi TRAIL hi group. Kaplan-Meier curves, HRs, and significance were calculated using the survival and survminer packages. ICB response analysis was based on expression data provided from a trial that investigated angiogenesis blockade with ICB.21 The significance of pretreatment IFN-G/TRAIL score, described above, to clinical response was determined by analysis of variance test in R. The significance of the score or expression levels of individual genes with respect to complete responders versus others was determined by two-tailed t-test.
Results
Single-cell analysis of SBRT-treated RCC
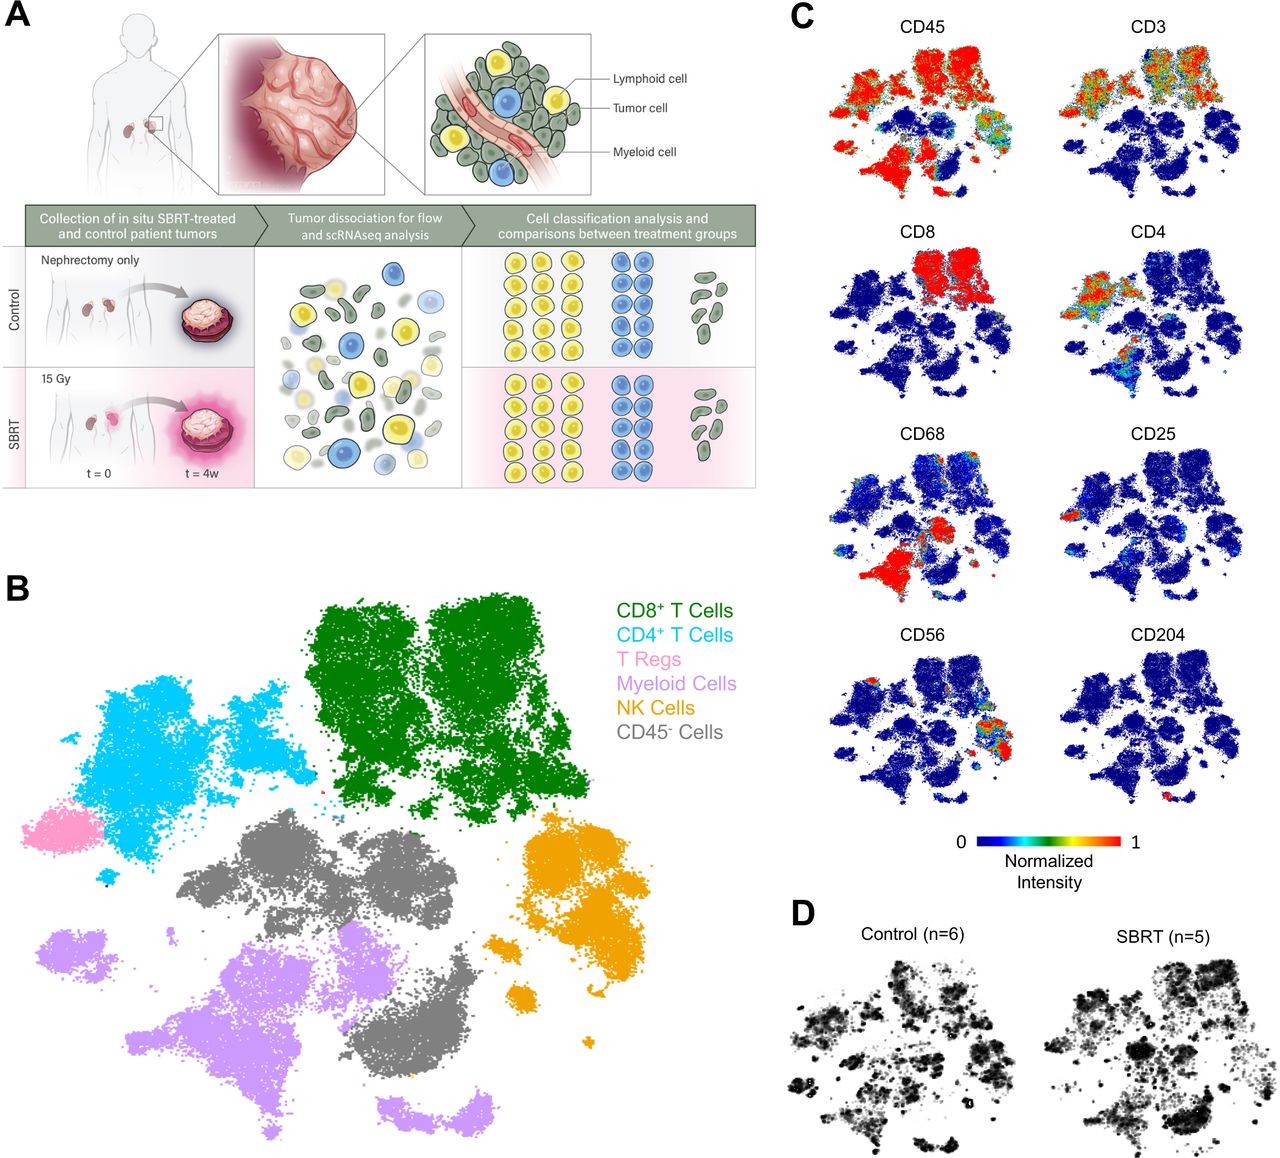
To determine how radiation shapes immune populations in human tumors, we analyzed samples from a clinical trial (NCT01892930) (figure 1A), wherein patients received 15 Gy SBRT to the primary RCC lesion 4 weeks prior to nephrectomy. Details of the trial, patient sex, staging, and long-term survival have been described.13 22 All tumors and patient characteristics are listed in online supplemental table 1.

Single-cell analysis of renal cell carcinoma tumors following radiation therapy. (A) Schematic for determining cell-type specific effects of treatment by spectral flow cytometry and scRNAseq analysis of in situ radiated primary renal cell carcinoma tumors and nephrectomy-only control tumors. (B) t-SNE plot showing identified cell populations following spectral flow analysis performed on single-cell suspensions. Colors and labels correspond to broad, main cell classification. Individual t-SNE plots for indicated markers (C) and total cells within control (left) or SBRT-treated groups (right) (D). SBRT, stereotactic body radiation therapy; scRNAseq, single-cell RNA sequencing; t-SNE, t-distributed stochastic neighbor embedding.
Nephrectomy tumors from patients with RCC who had no prior treatments (controls, n=6) and SBRT-treated tumors (n=5) were analyzed by high-dimensional spectral flow cytometry. Our prior studies revealed increased T-cell clonality and heightened levels of proliferating T cells in irradiated RCC.13 22 To determine how radiation impacted discrete immune subsets we designed a 35-marker antibody panel (online supplemental table 2) for deep profiling of lymphocyte subsets. Based on expression of hallmark markers, we identified broad immune and non-immune subsets (figure 1B–C, online supplemental table 3). Comparison between control and SBRT groups revealed distinct patterns in CD8+ T-cell populations (figure 1D, online supplemental figure 1A). Consistent with prior studies22 we found no difference in overall T-cell numbers (online supplemental figure 1A-C), suggesting that expression patterns or subset composition was altered in SBRT-treated samples rather than overall CD8+ T-cell infiltration.
To determine if irradiated tumors were enriched for specific CD8+ T-cell subsets, we performed unsupervised hierarchical FlowSOM analysis (figure 2A, online supplemental figure 2A,B). Clusters were not dominated by T cells from a single patient (online supplemental figure 2C,D, online supplemental table 4). The expression of lymphocyte markers was used to characterize each identified subset (figure 2B, online supplemental figure 2E). Comparisons across samples identified four significantly enriched clusters in SBRT-treated tumors (figure 2C). In line with prior immunohistochemistry (IHC) analysis, two of these clusters (cluster 14 and cluster 15) were programmed cell death protein-1 (PD-1)+ with high levels of CCR5 and Ki67 expression (figure 2D, online supplemental figure 3).22 PD-1int, CCR5hi, Ki67lo cluster 12 was also increased in SBRT-RCC. SBRT-treated RCC had heightened levels of cluster 3 which expressed CD45RA at levels similar to a representative naïve-like T-cell subset (cluster 2, figure 2D) and low levels of PD-1 indicating enrichment of a less-activated T-cell subset.

Analysis of CD8+ T cells by spectral flow cytometry. (A) t-SNE plot of CD8+ T cells analyzed by spectral flow analysis. Colors and labels correspond to broad CD8+ T-cell clusters identified by FlowSOM clustering (left). t-SNE plots (right) represent cells within control (top) or SBRT-treated groups (bottom). (B) Expression of indicated markers is displayed on individual t-SNE plots. (C) Frequency of cells in each of the 15 identified clusters within control (blue) and SBRT-treated (red) patient specimens. Statistical significance was calculated using multiple unpaired t-tests (*p<0.05). Data presented as mean±SD. (D) Single parameter histograms are shown for expression comparisons across the four significantly different clusters (3, 12, 14, and 15) between control and SBRT group and a naïve-like T-cell representative cluster (2). Numbers indicate median fluorescent intensity (MFI) value. Vertical dashed lines indicate the MFI value for cluster 2. SBRT, SBRT, stereotactic body radiation therapy; t-SNE, t-distributed stochastic neighbor embedding.
These findings led us to perform a comprehensive analysis of the immune and tumor compartments through scRNAseq. Analysis initiated with unsupervised, graphical clustering of cells (figure 3A) from controls (n=2) and SBRT-treated tumors (n=4). High level classification was based on marker genes used in scRNAseq analysis of RCC and other malignancies.8 19 23 24 Following quality control, the single-cell data set contained 34,626 total cells. 24,233 cells were identified as lymphocytes through the expression of genes including CD3D, CD8A, CD4, and NKG7; 7586 myeloid cells were based on expression of CD68, APOE, and CLEC9A; tumor cells were identified by CA9 and NAT8 expression totaling 1590 cells (online supplemental figure 4A-D). Sparing numbers of mast, blood vessel, and B cells were similarly identified (online supplemental figure 4A,B). Between treatment groups, we identified 13,422 total cells from control tumors and 21,204 cells from SBRT-treated RCC. Previous bulk transcriptomic results detected heightened expression of IFNG and interleukin (IL-16) along with broad immunogenicity and IFN pathways in radiation-treated patient tumors.13 Analysis by scRNAseq mapped expression of these genes to specific cell types (online supplemental figure 4E).
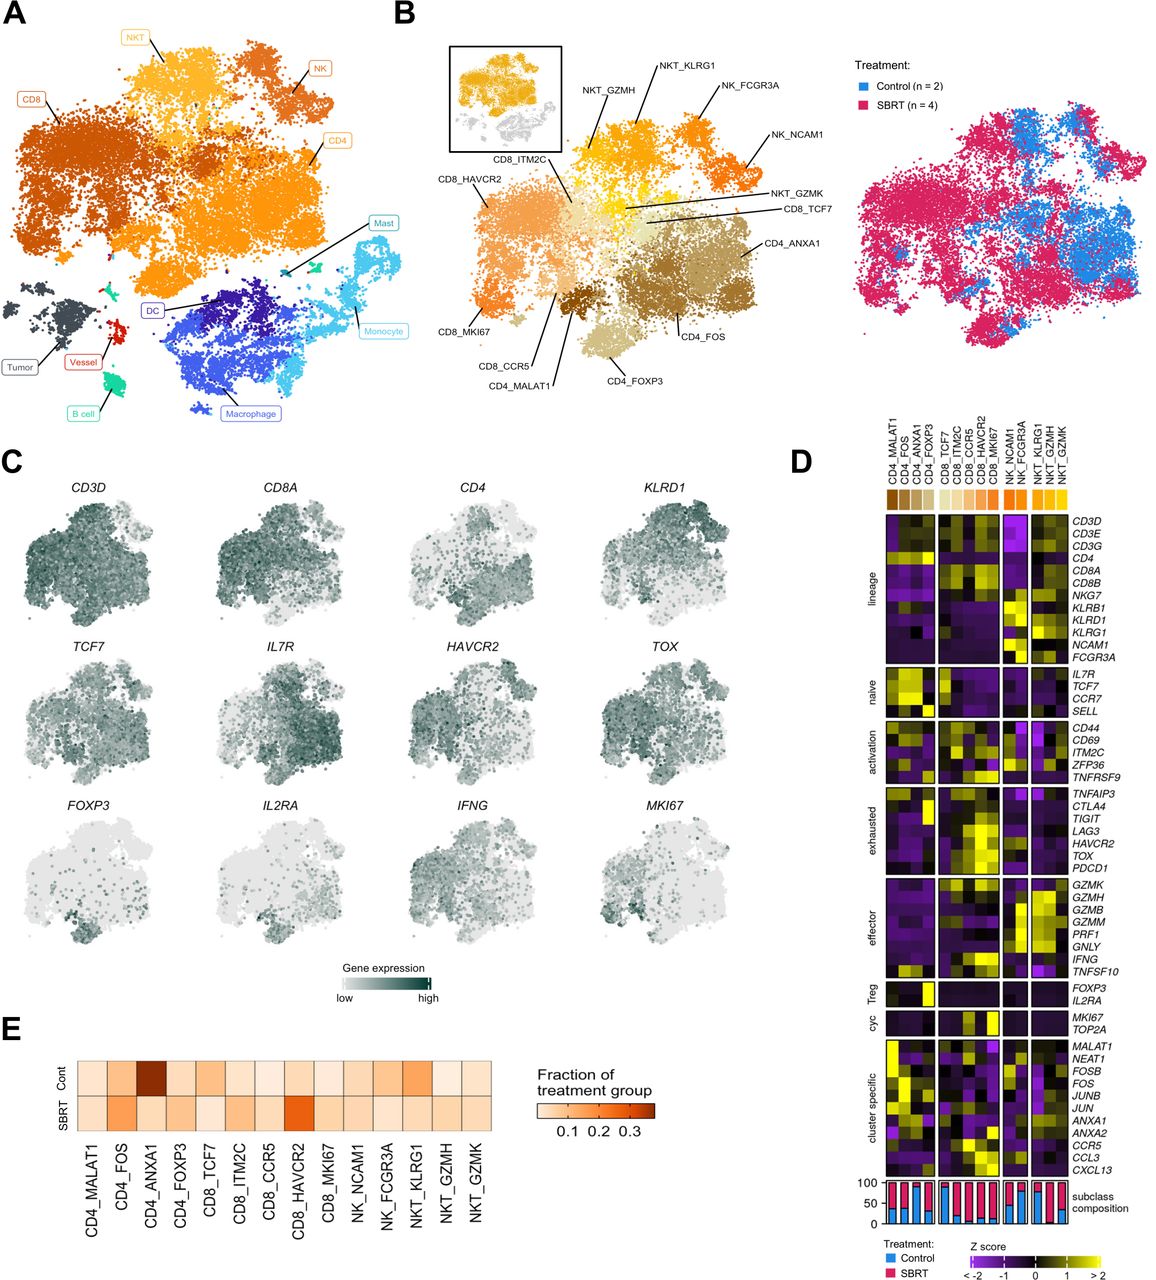
scRNAseq analysis of renal cell carcinoma following radiation therapy. (A) t-SNE of all cells analyzed for this study by scRNAseq. Colors and labels correspond to broad, main cell classification. (B) Distribution of lymphocytes shown as a subset from the t-SNE and by treatment group. Colors and labels correspond to cell subclassification (left) and treatment (right). Inset, showing cells subset from parent t-SNE for analysis. (C) Localized gene expression for indicated genes within the t-SNE. (D) Top, heatmap showing expression of genes used for lymphocyte subclassification. Bottom, bar graph showing subclass composition by treatment group after controlling for different total lymphocyte numbers between treatment groups. (E) Distribution of lymphocyte subclasses pooled within each treatment group. SBRT, stereotactic body radiation therapy; scRNAseq, single-cell RNA sequencing; t-SNE, t-distributed stochastic neighbor embedding.
Lymphocyte heterogeneity in radiated and treatment-naïve RCC
To evaluate the effect of in situ radiation on tumor-infiltrating natural killer (NK) and T cells, we first subset these for specific investigation (figure 3B). Isolated T lymphocytes and NK cells were reclustered (online supplemental figure 5A) before assigning a second level of categorization derived from expression of hallmark lineage genes: CD3D, CD4, CD8A, and killer lectin-like receptors (figure 3C, online supplemental figure 5B,C).8 19 23 24 A final level of classification within lineages was defined by enriched expression of genes that commonly identify lymphocyte maturation and effector status (figure 3C–D). In total, we identified 14 subclasses; subclasses included cells from both radiated and control tumors (figure 3D–E, online supplemental table 5).
Four CD4+ T-cell lineage subclasses were defined by enrichment of gene expression regulators (figure 3D). Two of these clusters, CD4_FOS (high FOS, JUNB expression) and CD4_FOXP3 (high regulatory T cell (Treg) markers FOXP3, IL2RA) resembled previously defined T-cell subtypes in RCC.19 24 FOXP3 expression was limited to the CD4_FOXP3 cluster (figure 3D) and represents the source of FOXP3 in the broad immune analysis shown in online supplemental figure 4D. Further examination of CD4+ T cells (online supplemental figure 6A-C) showed enrichment of FOXP3 among SBRT-treated cells. A comparison of the total lymphocyte composition between treatment groups showed a larger CD4_Treg proportion within the SBRT fraction compared with control (figure 3D,E) (χ2, p<2.2e−16). This is consistent with prior analysis of radiated RCC showing heightened levels of FOXP3+ cells.22
CD8+ T-cell subclasses were delineated by the expression of activation and maturation markers (figure 3D). A naïve/stem-like subclass, CD8_TCF7, was defined by high TCF7 (TCF1), IL7R, CCR7, and SELL (L-selectin) expression.25 Exhaustion markers PDCD1 (PD-1) and the terminal differentiation marker TOX, were increased among all other subclasses. An activated subclass, CD8_ITM2C, was categorized by high expression of ITM2C, which encodes a T-cell adhesion molecule, and CD69. This subclass transcriptionally resembles a 4-1BB-lo CD8+ T-cell subclass, which has been associated with ICB response.8 Additionally, the CD8_ITM2C subclass exhibited a PD-1-hi TIM3-lo LAG3-lo pattern of exhaustion marker expression that is indicative of longer immune-related progression-free survival and objective response to ICB.26 Three subclasses: CD8_CCR5, CD8_HAVCR2, and CD8_MKI67, showed pronounced expression of IFNG. CD8_HAVCR2 and CD8_MKI67, also had high co-expression of the T-cell effector TNFSF10 (TRAIL) and the highest TNFRSF9 (4-1BB) expression. Though past analysis of tumors associated TNFRSF9-hi CD8+ T cells with inferior overall survival,27 high abundance of these cells is associated with improved progression-free survival in nivolumab-treated patients.27 Similar to proliferating CD8+ T cells characterized through scRNAseq,19 28 the CD8_MKI67 subclass co-expressed cell proliferation markers, MKI67 (KI67) and TOP2A, and showed the highest TOX expression. Previous analyses have associated high infiltration of proliferating CD8+ T cells with improved survival.29
CD8+ T cells are increasingly activated in SBRT-treated RCC
We next performed a gross comparison of CD8+ T cells between treatment groups. Analysis by DGE showed increased levels of the naïve T-cell marker IL7R in control-RCC T cells (figure 4A). In contrast, effector molecules, IFNG and TNFSF10, maturation indicators, CD69 and PDCD1; and the cell cycle marker MKI67 were enriched among SBRT-RCC T cells (figure 4A), consistent with prior IHC analysis.22 The activation of SBRT-RCC CD8+ T cells was validated by the identification of T-cell receptor signaling, IFN-G, and mitosis pathways through gene set enrichment analysis (GSEA) (figure 4B).

Increased CD8+ T-cell effector molecule expression following SBRT. (A) Volcano plot showing differential gene expression within CD8+ T cells between treatment groups. Color is differential gene expression, abs(log2FC) >1; adjusted p value<0.05. (B) Gene set enrichment analysis of Reactome pathways. Opacity is NES. All shown pathways are significant, adjusted p value<0.05. (C) Pseudotime of CD8+ T cells showing distribution by CD8 subclass (top). Localized gene expression for indicated genes within the pseudotime plot (bottom). Gray has no detectable counts. (D) Pseudotime showing indicated CD8+ T-cell lineages. Color is calculated distribution for each lineage. (E) Pseudotemporal gene expression for each T-cell lineage. (F) Distribution of all captured cells by treatment group. (G) Distribution of cells by treatment group for each T-cell lineage. (H) Visualized χ2 of naïve and activated CD8+ T cells versus treatment group. Size and color show relative abundance after controlling for different total CD8+ T-cell numbers between treatment groups. (I) Pooled, pseudotemporal gene expression for each treatment group across lineages. SBRT, stereotactic body radiation therapy; NES, net enrichment score.
To analyze how radiation impacted maturation, we calculated pseudotime of our total CD8+ T-cell population (figure 4C,D).30 The pseudotime was first validated by the polarized expression of naïve markers (TCF7, CCR7, IL7R) at the upper-left node, versus T-cell activation and exhaustion markers elsewhere in the plots (ZFP36, PDCD1, TOX) (figure 4C). This transcript analysis identified two lineages that both initiated at a naïve, CD8_TCF7 dense cluster and terminated at either CD8_CCR5 or CD8_MKI67 dominant cluster (figure 4D,E). The CD8_ITM2C subclass proceeded the CD8_TCF7-dominant starting node and just before the branchpoint between lineages (figure 4C). This pseudotemporal localization and high CD69 early activation marker expression indicates that CD8_ITM2C cells may represent early-activated T cells derived from the stem-like population25 and that, similar to stem-like T cells, its benefit may be as a precursor of effector T cells. We validated our distribution by tracking the expression of CD8+ T-cell maturation indicators across lineages (figure 4D,E). As in recent reports in RCC,19 the expression of stem-like and naïve T-cell genes IL7R, TCF7, and CCR7 was highest near pseudotime=0 and decreased towards the lineage termini (figure 4E). The two lineages diverged with respect to expression of genes associated with the dominant subclass of the terminal node, CCR5 or MKI67, respectively, (figure 4C–E).
We observed an unequal distribution of cells across pseudotime by treatment group (figure 4F). Control-RCC CD8+ T cells were concentrated near the CD8_TCF7 node at pseudotime=0, while SBRT-RCC CD8+ T cells were more widely dispersed, especially across transitional points and at terminal nodes (figure 4G). Analysis across samples revealed consistent increased maturation in irradiated tumors (online supplemental figure 7). These findings were strengthened by a comparison of T cells by subclass between treatment groups which showed the disproportionate distribution of control-RCC CD8+ T cells in the naïve T-cell subclass (figure 4H) (χ2, p<2.2e−16); a similar analysis of CD4+ T cells showed control-RCC CD4+ T cells were in the naïve, CD4_ANXA1 subclass (online supplemental figure 6C). Analysis of activation markers and associated transcription factors showed diverging expression patterns between treatment groups, with increasing expression of CD69, JUN, and STAT1 at pseudotime=5 among SBRT-RCC CD8+ T cells (figure 4I); these preceded increases of TNFSF10, IFNG, and PRF1 effector molecule expression in SBRT-RCC CD8+ T cells. Together, these data reveal that expression of critical effector molecules increased in CD8+ T-cell subclasses within the radiated-RCC microenvironment.
SBRT-treated RCC has increased monocyte to macrophage polarization
Prior IHC analysis revealed increased levels of CD68+ macrophages in SBRT-treated tumors from this trial.22 Given the complexity of myeloid populations within RCC that can contain as many as 17 distinct macrophage phenotypes,31 we performed a more refined analysis to determine the impact of radiation on myeloid subsets (figure 5A). Myeloid cells were reclustered (online supplemental figure 8A) and then analyzed for hallmark gene expression (figure 5B,C, online supplemental figure 8B,C). Myeloid lineages were determined by high S100A8 and S100A9 expression for monocytes, high APOE and APOC1 for macrophages, and high CLEC10A and CLEC9A for dendritic cells (DC), as in other published analyses8 19 23 (figure 5B,C). Lineage marker expression was largely uniform between treatment groups (online supplemental figure 8C). In total, we identified 16 myeloid subclasses; all but 1 included cells from both treatment groups. The relative abundance of monocytes, macrophages, and DCs were comparable to prior scRNAseq analyses in RCC.8 19 To examine if the myeloid subsets resembled myeloid-derived suppressor cell (MDSC) populations, we performed a transcriptional comparison against a publicly available gene signature.32 The MDSC signature was not enriched in the examined monocyte, macrophage, or DC subsets (online supplemental figure 9).
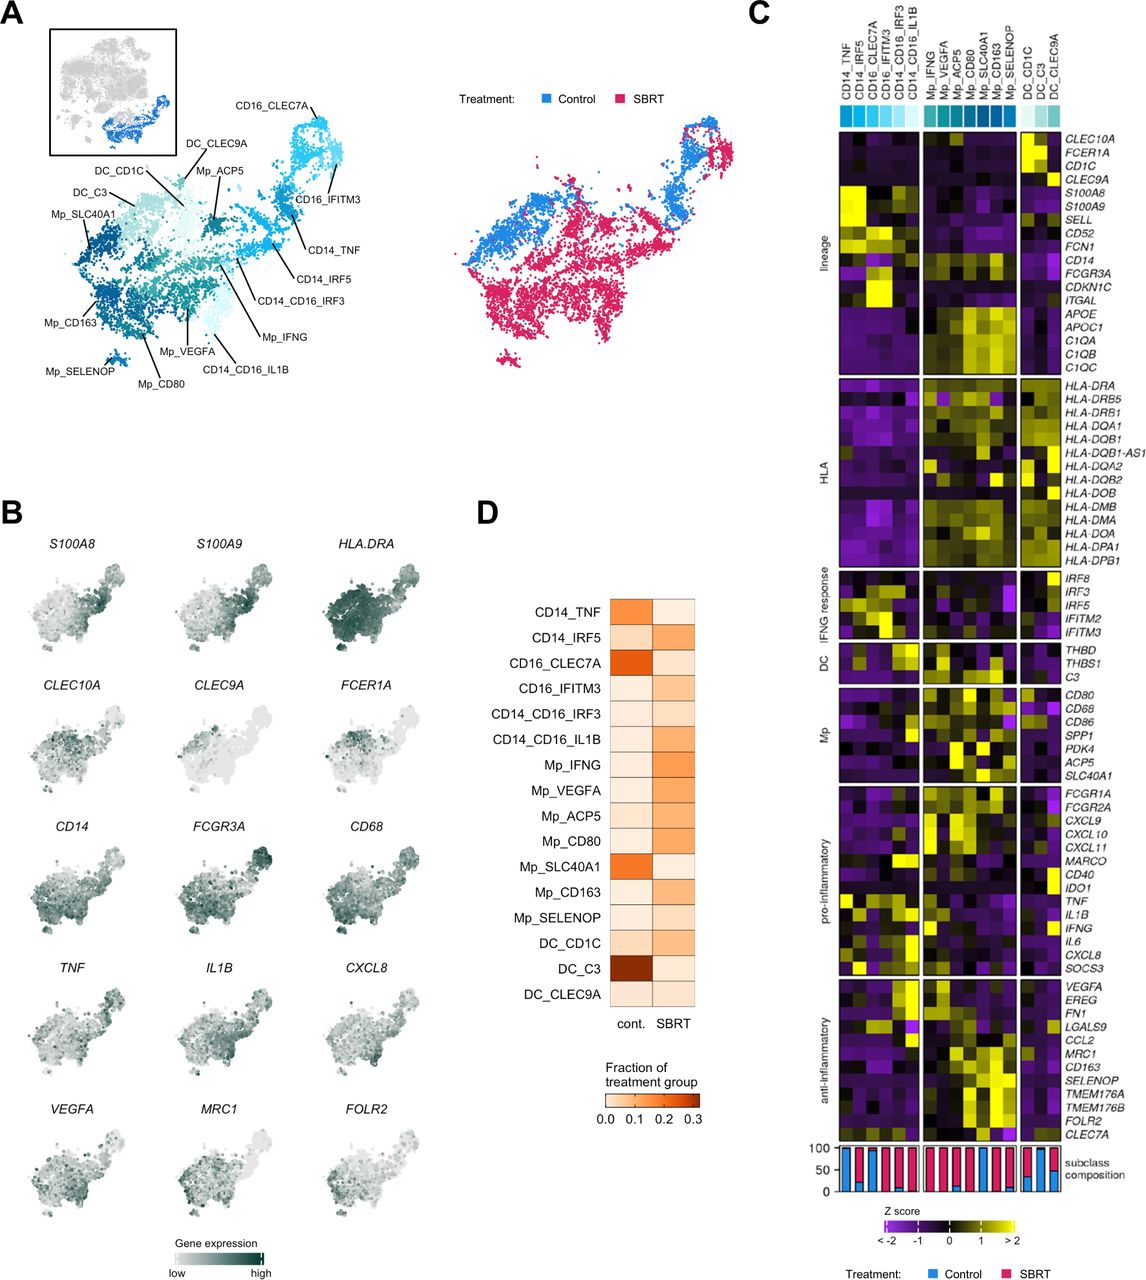
Analysis of myeloid cells by single-cell RNA sequencing. (A) Distribution of myeloid cells shown as subset from the t-SNE and by treatment group. Colors and labels correspond to cell subclassification (left) and treatment (right). Inset, showing cells subset from parent t-SNE for analysis. (B) Localized gene expression for indicated genes within the t-SNE. (C) Top, heatmap showing expression of genes used for myeloid subclassification. Bottom, bar graph showing subclass composition by treatment group after controlling for different total myeloid cell numbers between treatment groups. (D) Distribution of myeloid subclasses pooled within each treatment group. SBRT, stereotactic body radiation therapy; t-SNE, t-distributed stochastic neighbor embedding.
We noted that the classical and non-classical monocyte subclasses were either predominantly control-RCC or SBRT-RCC in origin (figure 5C,D). Among the macrophage subclasses, Mp_VEGFA was populated exclusively by SBRT-RCC cells (online supplemental figure 8C). DGE and GSEA of macrophages showed increased expression of hypoxia-associated genes and pathways in SBRT-RCC macrophages (online supplemental figure 10A-C), especially in the Mp_VEGFA subclass (online supplemental figure 10C). This hypoxia response may be driven in part by the limited number of detected blood vessels in SBRT-RCC versus control (online supplemental figure 4B). In addition to hypoxia, we identified the enrichment of IFN signaling pathways (online supplemental figure 10B) in SBRT-RCC macrophages. Consistent with murine studies33 an analysis of IFN response genes showed broad enrichment in macrophages from SBRT-treated tumors (online supplemental figure 10D), including IRF8 enrichment which has been shown to predict survival of patients with RCC.34
Having established CD8+ T cells as the main source of IFNG expression in the tumor microenvironment (online supplemental figure 4E), we employed a public database of predicted ligand-receptor and ligand-target gene interactors20 to explore possible interactions between CD8+ T cells and RCC macrophages (online supplemental figure 10E). Referring to gene targets from established, macrophage-specific IFN-G response pathways (KEGG 05140, Dror et al),35 we identified top predicted CD8+ T-cell ligands and potential macrophage receptors. IFN-G was the top CD8+ T-cell ligand for IFN-G response regulation in macrophages; although not among the top predicted ligands, we included IL-15 and IL-10 in this analysis as they have been previously used in CD8+ T cells to macrophage interaction analyses.19 Virtually all predicted CD8+ T-cell ligands as well as macrophage receptors and target genes were either significantly enriched or trended towards enrichment among the SBRT-RCC fraction (online supplemental figure 10E). Predicted ligands, IFNG in particular, had higher expression among CD8_HAVCR2 and CD8_MKI67 T cells (online supplemental figure 10E), suggesting that the MKI67 lineage may be a major contributor to IFN-G responses in macrophages. A reciprocal survey of T-cell co-regulatory molecule gene expression among macrophages was also performed. The costimulatory molecule CD86 and the T-cell inhibitory molecule galectin-9 (LGALS9) were both significantly enriched among macrophages within SBRT-treated RCC (online supplemental figure 10F).
Evaluation of myeloid polarization showed increased SBRT-RCC enrichment of MHC-II components and apolipoproteins (figure 6A). Further analysis revealed that SBRT-RCC myeloid cells enriched for both pro-inflammatory and anti-inflammatory marker genes (figure 6A,B). Regardless, it was evident that radiation resulted in overall macrophage polarization versus control (figure 6B).
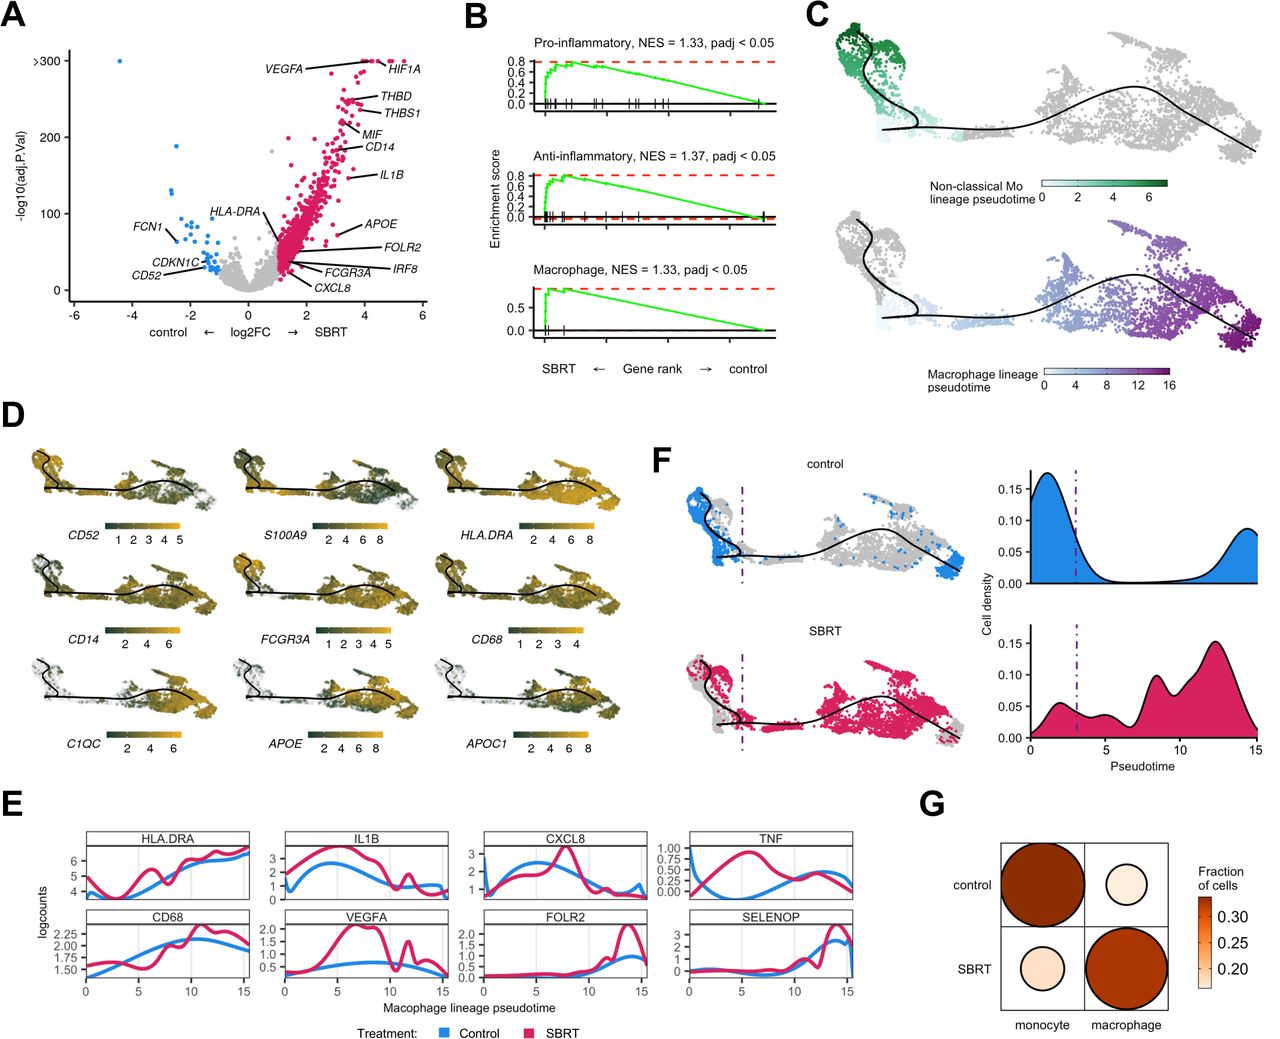
Transcript velocity analysis of myeloid populations shows increased differentiation toward macrophages in SBRT-treated tumors. (A) Volcano plot showing differential gene expression within monocytes and macrophages between treatment groups. Color is differential gene expression, abs(log2FC) >1; adjusted p value<0.05. (B) Gene set enrichment analysis of curated pro-inflammatory, anti-inflammatory, and general macrophage gene lists. (C) Pseudotime showing indicated cell lineages. Color is calculated pseudotemporal distribution for each lineage. (D) Localized gene expression for indicated genes within the pseudotime plot. Gray has no detectable counts. (E) Pooled, pseudotemporal gene expression for each treatment group across the macrophage lineage. (F) Left, distribution of all captured cells by treatment group in the pseudotime. Right, distribution cells by treatment group for the macrophage lineage. (G) Visualized chi square of monocytes and macrophages versus treatment group. Size and color show relative abundance after controlling for different summed monocytes and macrophages between treatment groups. SBRT, stereotactic body radiation therapy; NES, net enrichment score.
For deeper analysis, we examined a pseudotime of all monocyte and macrophage cells subset from our data. Consistent with scRNAseq data in RCC,19 we identified two lineages that terminated at either non-classical monocyte or macrophage nodes (figure 6C). The classical and non-classical monocyte lineages had higher expression of S100A9 while the macrophage lineage showed higher levels of MHC-II component expression, APOE, and APOC1 (figure 6D). The macrophage lineage also expressed increased levels of CD68 and HLADRA (figure 6E).
The distribution of cells by treatment group showed polarization across pseudotime. Specifically, control-RCC cells were more left-polarized, associated with monocytes, while SBRT-RCC cells were more polarized towards the macrophage terminal node (figure 6F). Analysis of myeloid subclass distribution showed a higher macrophage to monocyte ratio in SBRT-RCC (figure 6G) (χ2, p<2.2e−16), which is consistent with IHC data demonstrating increased macrophage abundance in radiated tumors from this trial.22
Increased effector CD8+ T-cell interaction potential in SBRT-RCC
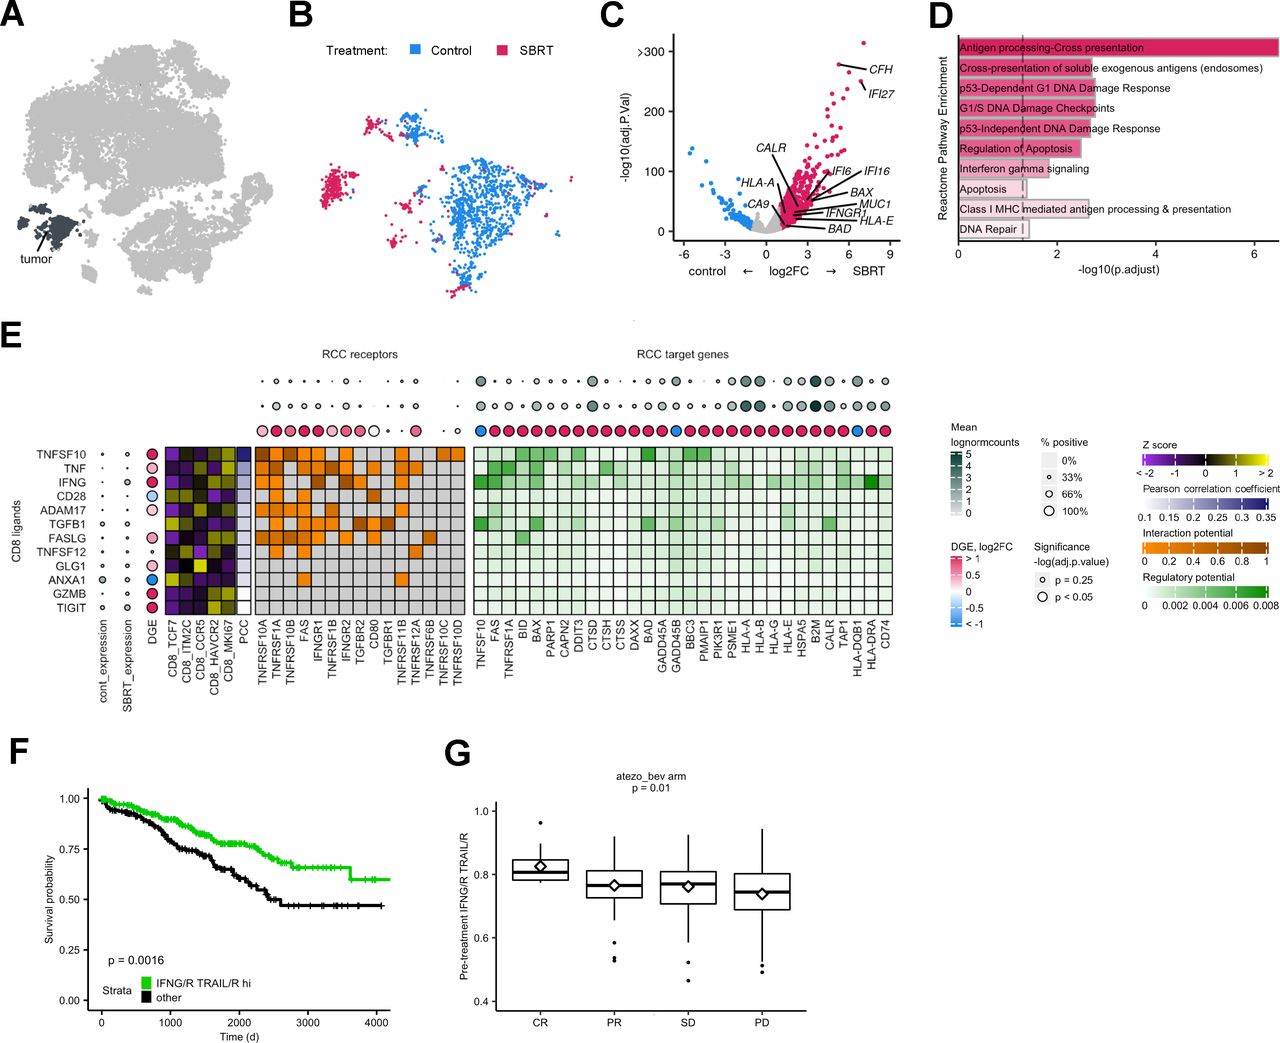
To determine the effect of radiation on tumor cells treated in situ, we calculated DGE and GSEA for the tumor subset (figure 7A–D). SBRT-RCC tumor cells had increased expression of tumor associated antigen genes, MUC1 and CA9, as well as CALR. MHC components HLA-A, HLA-B, HLA-E, and HLA-G were also higher in SBRT-RCC by DGE analysis (figure 7C). Further, antigen presentation pathways were enriched among radiated tumor cells (figure 7D). While previous reports of bulk RNA sequencing analysis13 did not show significant changes post-SBRT for the aforementioned genes (MUC1, CA9 and CALR), these scRNAseq findings are consistent with flow cytometric analysis of radiated RCC tumors13 and highlight the advantage of compartment-specific analysis. We also observed increased expression of apoptotic regulators BAD and BAX (figure 7C) and apoptosis pathway enrichment within irradiated RCC (figure 7D).
Analysis of SBRT cancer cells shows enriched antigen presentation and increased interactions with CD8+ T cells. (A) Tumor cells subset from parent t-SNE for analysis. (B) Distribution of cells by treatment group. (C) Volcano plot showing DGE within CD8+ T cells between treatment groups. Color is differential gene expression, abs(log2FC) >1; adjusted p value<0.05. (D) Gene set enrichment analysis of Reactome pathways. Opacity is NES. All shown pathways are significant, adjusted p value<0.05. (E) Predicted interactions from CD8 ligands to tumor cell receptors and target genes. CD8 ligands are ordered by decreasing correlation to target gene expression, PCC. Z score shows expression of CD8 ligands by subclass. DGE is calculated separately for either the CD8 or tumor subsets. (F) Kaplan-Meier curve showing survival with respect to IFN-G/R TRAIL/R hi patient classification. HR of IFN-G/R-hi-and-TRAIL/R-hi=0.55. (G) Box plots showing IFN-G/R, TRAIL/R score in pre-immune checkpoint blockade treatment patient tumors. Middle represents the median; hinges describe the first quartile and third quartile; whiskers show±1.5×IQR; diamond is the mean. P value calculated by analysis of variance. t-SNE, t-distributed stochastic neighbor embedding; DEG, differential gene expression; IFN, interferon; RCC, renal cell carcinoma; SBRT, stereotactic body radiation therapy; NES, net enrichment score; CR, complete response; PR, partial response; SD, stable disease; PD, progressive disease; PCC, pearson correlation coefficient.
SBRT-RCC cells showed higher expression of the IFN-G receptor component IFNGR1, as well as IFN-G response genes including: IFI27, IFI16, IFI6 (figure 7C) and pathway enrichment of IFN-G signaling (figure 7D). To further characterize the IFN-G response in tumor cells, we examined previously described, antagonistic hallmark IFN-G response and IFN-G resistance pathways36 (online supplemental figure 11A,B) and found both were enriched among radiated fractions. We next examined whether hallmark IFN-G and resistance pathways are expressed in distinct tumor cell populations and found both signals to be highly correlated (Pearson correlation coefficient=0.73; p<2.2e−16) (online supplemental figure 11C).
Given the increased indicators of T cell-mediated cell death among radiated tumor cells, including antigen presentation and apoptosis pathways, we examined how CD8+ T cells might be driving this response. Using genes from well characterized pathways for antigen processing and presentation (KEGG 04612) as well as apoptosis (KEGG 04210), we identified TRAIL (TNFSF10) and IFN-G among the top predicted CD8+ T-cell ligands for these tumor cell responses (figure 7E). Expression of the CD8+ T-cell ligands, IFNG and TRAIL, as well as their receptor components IFNGR1 and TNFRSF10A were significantly enriched or trended towards enrichment with SBRT-treatment; additionally, almost all differentially expressed tumor target genes were SBRT-enriched (figure 7E). Ligands for tumor antigen presentation and apoptosis, IFN-G and TRAIL, showed higher expression among CD8_HAVCR2 and CD8_MKI67 CD8+ T cells (figure 7E). This was similar to an analysis of CD8+ T-cell drivers of IFN-G responses in macrophages (online supplemental figure 10E).
To determine clinical relevance of these putative immunogenic interactions between CD8+ T cells and cancer cells, we analyzed TCGA data. Selected patients with RCC were classified based on expression of IFN-G and TRAIL ligands and receptors (online supplemental figure 12A); roughly half of patients were classified as IFN-G/R and TRAIL/R hi. Our analysis showed IFN-G, TRAIL hi patients had improved overall survival (figure 7F, online supplemental figure 12B). Because of significant interest in radiation as a tumor-priming treatment for paired immunotherapy, we next examined pre-ICB treatment bulk RNA with matched clinical response data.37 We found that IFN-G, TRAIL ligand and receptor expression correlated with clinical response after ICB (figure 7G).
Discussion
To improve radiation-induced immunogenicity and optimize treatment regimens, investigators continue to probe how radiation impacts antigenicity and neoantigen expression,38 39 immune infiltration,16 and induction of IFN pathways.17 Clinical observations have shown that patients treated with ICB may benefit from preconditioning radiation even months prior to the administration of immunotherapy,40 suggesting that radiation has long-lasting immune effects. Sequencing of radiation with immune-based treatments has been demonstrated to be critical for responses in preclinical models.41
Central to each of these investigations and potential synergy with ICB is the status of CD8+ T cells following radiotherapy. Intratumoral CD8+ T cells are a heterogeneous population consisting of subsets with distinct functions, transcriptional states, and proliferative capacity.25 Through the data presented here we address questions regarding the cell type-specific effects of radiation in patient tumors and build on the transcriptomic atlas of human tumors.8 19 24 28 Analysis of radiotherapy-treated tumors showed a redistribution from naïve-like lymphocytes to more mature states. Comparison of CD8+ T cells between treatment groups showed broad enrichment of effector and activation marker expression with radiation, including IFN-G.
A critical, unanswered question relates to the mechanism(s) driving increased proportions of effector T cells in SBRT-treated tumors. Differential radioresistance of immune subsets could play a role in our observations. For example, naïve or stem-like CD8+ T cells were shown to be more sensitive to radiation than memory, effector, or recently activated T cells.42 43 Radiosensitivity can also be impacted by the microenvironment, with tumor-resident populations receiving relative protection compared with CD8+ T cells found in circulation or lymph nodes.44 In this instance, intratumoral T cells treated with a similar high dose of radiation were found to produce more IFN-γ on a per cell basis reflecting the results of our pseudotime analysis. Our previous evaluation of peripheral blood samples demonstrated heightened levels of tumor-enriched clones 2 weeks after radiation.13 Recent work evaluating radiotherapy of patient lung metastases has shown elevated levels of PD-1+ T-cell subsets in the periphery following single-fraction treatment.45 Collectively, these findings suggest that T-cell activation occurring outside of the irradiated field could also be a driver of changes later observed in the tumor microenvironment.
Analysis of tumor cells showed increased antigen and MHC-I component expression in radiated samples, supporting enhanced immunogenicity in irradiated tumors. The data also permitted an examination of potential cell-to-cell interactions within the tumor microenvironment, suggesting that specific CD8+ T subsets were drivers of increased antigen presentation in tumor cells. We identified receptor and ligand interactions, largely enriched within radiated tumors, between IFN-G/R and TRAIL/R. Expression levels of these ligand and receptor pairs were associated with overall survival and response to ICB. These findings are noteworthy considering recent studies showing increased immune activity following radiation is reliant on upregulation of MHC molecules as well as TRAIL-mediated interactions.46 Implications may extend to other cancer therapies including chemotherapeutic agents which have long shown the capacity to increase expression of TRAIL receptors DR4 and DR5.47 Our findings also show enrichment of FOXP3 Treg within radiated RCC. Given prior work has revealed spatial and proportional correlation between activated CD8 T cells and Treg in human tumors,48 this immunosuppressive population could be a therapeutic target in combination radiation regimens.
While this study provides much needed resolution to previous, bulk RNA data from radiated RCC,13 certain limitations remain. Chromatin regulators are commonly mutated in RCC impacting expression of large numbers of genes.49 Future studies are therefore warranted to interrogate the relationship between radiation-induced immunologic changes and tumor mutational status. Statistical analyses of unpaired samples may have missed more subtle, but nevertheless important, changes on-treatment that could have been found with more powerful tests afforded by additional samples. Cancer cells are sensitive to reagents and the process used to obtain single-cell preparations from RCC,19 and thus are under-represented in our analysis. More broadly, samples for this study were collected 4 weeks after 15 Gy radiation in a single arm trial, and thus leave important questions regarding the acute effects and kinetics of immune activity as well as dose fractionation unanswered.50 Our findings in RCC, which represents a highly immune infiltrated and vascularized malignancy,21 may not extend to other tumor types. Finally, this report provides a glimpse of the irradiated tumor immune landscape. However, since patients received varying adjuvant treatments after their time on the trial it is not feasible to correlate outcomes with changes in the tumor after SBRT.
Collectively these findings denote the contributions of immune and tumor-intrinsic contributions towards radiation-induced tumor immunogenicity. Our data showing increased levels of effector and proliferating CD8+ T cells in SBRT-treated RCC support prior studies that demonstrated heightened T-cell clonality within this tumor microenvironment.13 Further evaluation of radiation-induced changes to patient tumors and systemic immune responses are required to provide rationale for optimal design of clinical strategies that will precondition with radiation and then treat with ICB or other immunotherapy combinations.
Data availability statement
Data are available in a public, open access repository. All data relevant to the study are included in the article or uploaded as supplementary information. Single-cell RNA-sequencing data sets generated are available on GEO database (GSE202374). Patient response data were from the European Genome-Phenome Archive (EGA) under accession number EGAS00001002928. Annotated single-cell RNA data sets and TCGA barcodes of all KIRC samples are deposited in GitHub (github.com/JackyLChow/Chow_et_al_JITC_2023). Spectral flow cytometry data are available in ImmPort under access code SDY1998.
Ethics statements
Patient consent for publication
Ethics approval
This study involves human participants and was approved by the Roswell Park Institutional Review Board for the clinical trial under number I 212712. The evaluation of de-identified patient samples from that trial shown in this manuscript was approved under BDR 053514 as non-human subject research also by the Roswell Park Institutional Review Board. The research activity was reviewed and determined to be non-human subject research (NHSR). The department of health and human services does not consider research involving data and specimens to involve human subjects as defined under 45 CFR 46.102 (f) if the following conditions are met: (1) The private information or specimens were not collected specifically for the currently proposed research project through an interaction or intervention with living individuals; and (2) The investigator(s) cannot readily ascertain the identity of the individual(s) to whom the coded private information or specimens pertain. The Office of Research Subject Protection at Roswell Park therefore stated that in accordance with 45 CFR 46.102 of the Common Rule, the protocol used to analyze samples in this study does not involve human subject research. Participants gave informed consent to participate in the study before taking part.
Acknowledgments
We sincerely thank all the patients and their families involved in this study. Research reported here was supported by the Roswell Park Friends of Urology and the Elsa Kreiner Memorial Fund. We would also like to thank Hans Minderman, Orla Maguire, and Joseph Hanson for their assistance in development of the spectral flow cytometry panel and corresponding acquisition and analysis.
References
Supplementary materials
Supplementary Data
This web only file has been produced by the BMJ Publishing Group from an electronic file supplied by the author(s) and has not been edited for content.
Footnotes
Contributors JC, AK, AKS, and JBM designed the study. JC, AK, MG, BJW, KTS, AC, PKW, and JBM developed methodology. Research was performed by JC, AK, MG, BJW, AKS, and JBM. Data was analyzed by JC, AK, MG, BJW, and JBM. JC, AK, and JBM wrote the manuscript with input from all coauthors. JC, AK, MG, BJW, TS, EAR, SIA, AKS, and JBM edited the manuscript. JBM is guarantor for this work.
Funding Research reported in this publication was supported by a DOD Kidney Cancer Research Program Idea Development Award (W81XWH2010720). This project was also supported by the National Center for Advancing Translational Sciences of the National Institutes of Health under award number UL1TR001412 to the University at Buffalo. The content is solely the responsibility of the authors and does not necessarily represent the official views of the NIH. Support was also provided by the National Cancer Institute (Grant P30CA016056 supporting use of the Roswell Park Comprehensive Cancer Center’s Bioinformatics, Genomics, Pathology Network, Atlas Studios as well as Flow and Image Cytometry Shared Resources).
Competing interests None declared.
Provenance and peer review Not commissioned; externally peer reviewed.
Supplemental material This content has been supplied by the author(s). It has not been vetted by BMJ Publishing Group Limited (BMJ) and may not have been peer-reviewed. Any opinions or recommendations discussed are solely those of the author(s) and are not endorsed by BMJ. BMJ disclaims all liability and responsibility arising from any reliance placed on the content. Where the content includes any translated material, BMJ does not warrant the accuracy and reliability of the translations (including but not limited to local regulations, clinical guidelines, terminology, drug names and drug dosages), and is not responsible for any error and/or omissions arising from translation and adaptation or otherwise.