Article Text

Abstract
Background Cyclin-dependent kinase 4/6 inhibitors (CDK4/6i) combined with endocrine therapy are a mainstay treatment for hormone receptor-positive breast cancer. While their principal mechanism is inhibition of cancer cell proliferation, preclinical and clinical evidence suggests that CDK4/6i can also promote antitumor T-cell responses. However, this pro-immunogenic property is yet to be successfully harnessed in the clinic, as combining CDK4/6i with immune checkpoint blockade (ICB) has not shown a definitive benefit in patients.
Method We performed an in-depth analysis of the changes in the tumor immune microenvironment and systemic immune modulation associated with CDK4/6i treatment in muring breast cancer models and in patients with breast cancer using high dimensional flow cytometry and RNA sequencing. Gain and loss of function in vivo experiments employing cell transfer and depletion antibody were performed to uncover immune cell populations critical for CDK4/6i-mediated stimulation of antitumor immunity.
Results We found that loss of dendritic cells (DCs) within the tumor microenvironment resulting from CDK4/6 inhibition in bone marrow progenitors is a major factor limiting antitumor immunity after CDK4/6i and ICB. Consequently, restoration of DC compartment by adoptively transferring ex vivo differentiated DCs to mice treated with CDK4/6i and ICB therapy enabled robust tumor inhibition. Mechanistically, the addition of DCs promoted the induction of tumor-localized and systemic CD4 T-cell responses in mice receiving CDK4/6i-ICB-DC combination therapy, as characterized by enrichment of programmed cell death protein-1-negative T helper (Th)1 and Th2 cells with an activated phenotype. CD4 T-cell depletion abrogated the antitumor benefit of CDK4/6i-ICB-DC combination, with outgrowing tumors displaying an increased proportion of terminally exhausted CD8 T cells.
Conclusions Our findings suggest that CDK4/6i-mediated DC suppression limits CD4 T-cell responses essential for the sustained activity of CD8 T cells and tumor inhibition. Furthermore, they imply that restoring DC-CD4 T-cell crosstalk via DC transfer enables effective breast cancer immunity in response to CDK4/6i and ICB treatment.
- immunity
- breast neoplasms
- drug therapy, combination
- immunotherapy
- tumor microenvironment
Data availability statement
All data relevant to the study are included in the article or uploaded as supplementary information.
This is an open access article distributed in accordance with the Creative Commons Attribution Non Commercial (CC BY-NC 4.0) license, which permits others to distribute, remix, adapt, build upon this work non-commercially, and license their derivative works on different terms, provided the original work is properly cited, appropriate credit is given, any changes made indicated, and the use is non-commercial. See http://creativecommons.org/licenses/by-nc/4.0/.
Statistics from Altmetric.com
WHAT IS ALREADY KNOWN ON THIS TOPIC
Accumulating body of data suggest that treatment with cyclin-dependent kinase 4/6 inhibitors (CDK4/6i) can promote antitumor CD8 T responses. However, this alone is not sufficient to establish effective antitumor immunity in patients with breast cancer.
WHAT THIS STUDY ADDS
This study reports an actionable strategy to harness pro-immunogenic properties of CDK4/6i by engaging local and systemic CD4 T-cell responses through the transfer of ex vivo differentiated dendritic cells.
HOW THIS STUDY MIGHT AFFECT RESEARCH, PRACTICE OR POLICY
This study provides preclinical evidence for an effective CDK4/6i and immunotherapy combination that may promote breast cancer immunity and improve outcomes for patients with metastatic breast cancer.
Introduction
Cell cycle kinases cyclin-dependent kinase (CDK) 4 and CDK 6 facilitate cell cycle progression through the G1 phase. Small molecule inhibitors targeting these kinases can block the proliferation of cancer cells.1 2 Three orally available CDK4/6 inhibitors (CDK4/6i), palbociclib, ribociclib, and abemaciclib, have been approved by the Food and Drug Administration for the treatment of hormone receptor-positive and human epidermal growth factor receptor 2 (HER2)-negative breast cancer in combination with hormone therapy.3–7
Accumulating evidence suggests that CDK4/6i may enhance certain aspects of antitumor immunity.8 For example, CDK4/6i abemaciclib can suppress the proliferation of regulatory T cells in a mouse model of HER2+ mammary cancer.9 10 In addition, CDK4/6i have been reported to boost T-cell activity through transcription factor nuclear factor of activated T cells (NFAT)11 12 and promote differentiation of memory CD8 T cells.13 14 We and others have demonstrated that CDK4/6i can induce a pro-immunogenic phenotype in cancer cells associated with increased production of chemokines and type III interferons that recruit and activate CD8 T cells.10 15 16 Furthermore, CDK4/6i therapy induces the expression of immune checkpoint molecule programmed death ligand-1 (PD-L1) on tumor cells, making them sensitive to anti-PD-L1 therapy.17
Breast cancers, especially of the estrogen receptor-positive (ER+) subtype, are not considered immunogenic and typically lack prominent T-cell infiltration and respond poorly to immune checkpoint blockade (ICB).18 These factors raise the idea of harnessing the pro-immunogenic activity of CDK4/6i to sensitize breast cancers (and potentially other cancers) to ICB. Several clinical trials have been initiated combining ICB therapy with CDK4/6i palbociclib (NCT04360941, NCT03147287), abemaciclib (NCT03280563, NCT04169074, NCT04272645, NCT04220892, NCT04118036, NCT03997448, NCT02779751, NCT04088032, NCT02791334), ribociclib (NCT03294694), and a newer intravenous CDK4/6i trilaciclib (NCT02978716) in breast cancer and other malignancies (ClinicalTrials.gov). While many of these studies are still in progress, early results suggest that adding ICB does not dramatically enhance responses over CDK4/6i alone. For instance, a combination of abemaciclib with the anti-programmed cell death protein-1 (PD-1) antibody pembrolizumab with or without endocrine therapy in locally advanced or metastatic breast cancer (MBC) did not show clear improvement over historical data for abemaciclib monotherapy.19 Similarly, combination with ribociclib did not suggest an additive effect with ICB.20 In another study, a combination of palbociclib, pembrolizumab, and letrozole as front-line therapy in ER+ MBC showed a progression-free survival (PFS) of 25.2 months, similar to a PFS of 24.8 in the control arm (no pembrolizumab) of the PALOMA-2 trial.21 The overall clinical experience with CDK4/6i and ICB combinations, although based on studies with a small number of patients, suggests that additional immune evasion mechanisms may restrict the full potential of these combinations in patients. Understanding these immune evasion mechanisms would be necessary to effectively harness pro-immunogenic properties of CDK4/6i in the clinic.
We hypothesized that the limited efficacy of CDK4/6i and ICB therapy is associated with the anti-proliferative effect of CDK4/6i on the host’s cells. Indeed, the sensitivity to CDK4/6i varies across cell types.22 23 Furthermore, the main side effects of CDK4/6i (diarrhea, neutropenia) are associated with inhibition of proliferation in fast-cycling normal cells, including gastrointestinal epithelial cells and granulocyte progenitors.24 25 While it remains largely unknown how the anti-proliferative effect of CDK4/6i impacts the host’s immune system, it is plausible that systemic CDK4/6 inhibition may impact some immune cell subtypes required for effective antitumor immunity.
To understand the barriers for effective antitumor immunity after CDK4/6i and ICB therapy in breast cancer, we used female mice bearing luminal-like PYMT mammary tumors and ex vivo immune cell cultures. Using these preclinical models coupled with transcriptome and immune cell assessments, we identified immune subsets sensitive to CDK4/6i. We also interrogated longitudinal samples from patients with MBC undergoing CDK4/6i therapy to corroborate mechanistic findings in the mouse tumors and assess the dynamics of CDK4/6i-mediated immune system modulation in humans. Based on the results of these studies, we designed and validated a combinatorial therapeutic approach to overcome antitumor immunity block in the context of CDK4/6i and ICB therapy.
Results
Tumor-infiltrating leukocytes from CDK4/6i-treated mice displayed decreased expression of cell cycle genes
To determine how CDK4/6i affects the phenotype of tumor-infiltrating immune cells in vivo, we used female transgenic MMTV-PYMT mice (FVB genetic background) that develop mammary tumors with a mean latency of 53 days. When tumors were palpable, mice were treated with palbociclib or vehicle for 18 days. Subsequently, CD45-positive immune cells were isolated from tumors using fluorescence-activating cell sorting (FACS) and subjected to RNA sequencing (RNA-seq) (figure 1A). Tumor growth over time is shown in figure 1B. We identified 486 downregulated and 309 upregulated genes in CDK4/6i-treated tumors (figure 1C, online supplemental data S1). Gene Ontology (GO) analysis revealed a highly significant enrichment of GO terms related to cell proliferation, such as ‘cell cycle’, ‘cell division’, and ‘mitotic nuclear division’, among palbociclib-downregulated genes (figure 1D). Expression of cell cycle-related genes was reduced in immune cells obtained from palbociclib-treated tumors (figure 1E). These included proliferation marker Ki-67, cell cycle transcription factor FoxM1, essential mitotic kinase Aurkb, mitotic cyclin Ccnb1, and phosphatases Cdc25b and Cdc25c that activate mitotic cyclin-dependent kinase CDK1 (figure 1F). These results suggest that palbociclib treatment inhibits proliferation of tumor-infiltrating leukocytes.
Supplemental material

Downregulation of proliferation-related transcription in tumor-infiltrating leukocytes after palbociclib treatment. (A) Experiment scheme. Female MMTV-PYMT mice at 2 months of age were treated with vehicle or 100 mg/kg palbociclib for 23 days. CD45+ cells sorted from tumors were analyzed by RNA sequencing. (B) Tumor volume changes over time in the experiment shown in A. N=5 mice per treatment group. (C) Pie chart graph showing numbers of genes upregulated or downregulated by palbociclib treatment. (D) Analysis of Gene Ontology terms enriched in a set of genes downregulated by palbociclib. (E) Heat map indicating the expression of genes downregulated by palbociclib. (F) Expression of selected cell cycle regulating genes in leukocytes infiltrating mammary tumors in vehicle-treated and palbociclib-treated mice. Statistical comparison was performed using an unpaired t-test.
CDK4/6 was required for bone marrow cell proliferation but dispensable for the proliferation of activated T cells
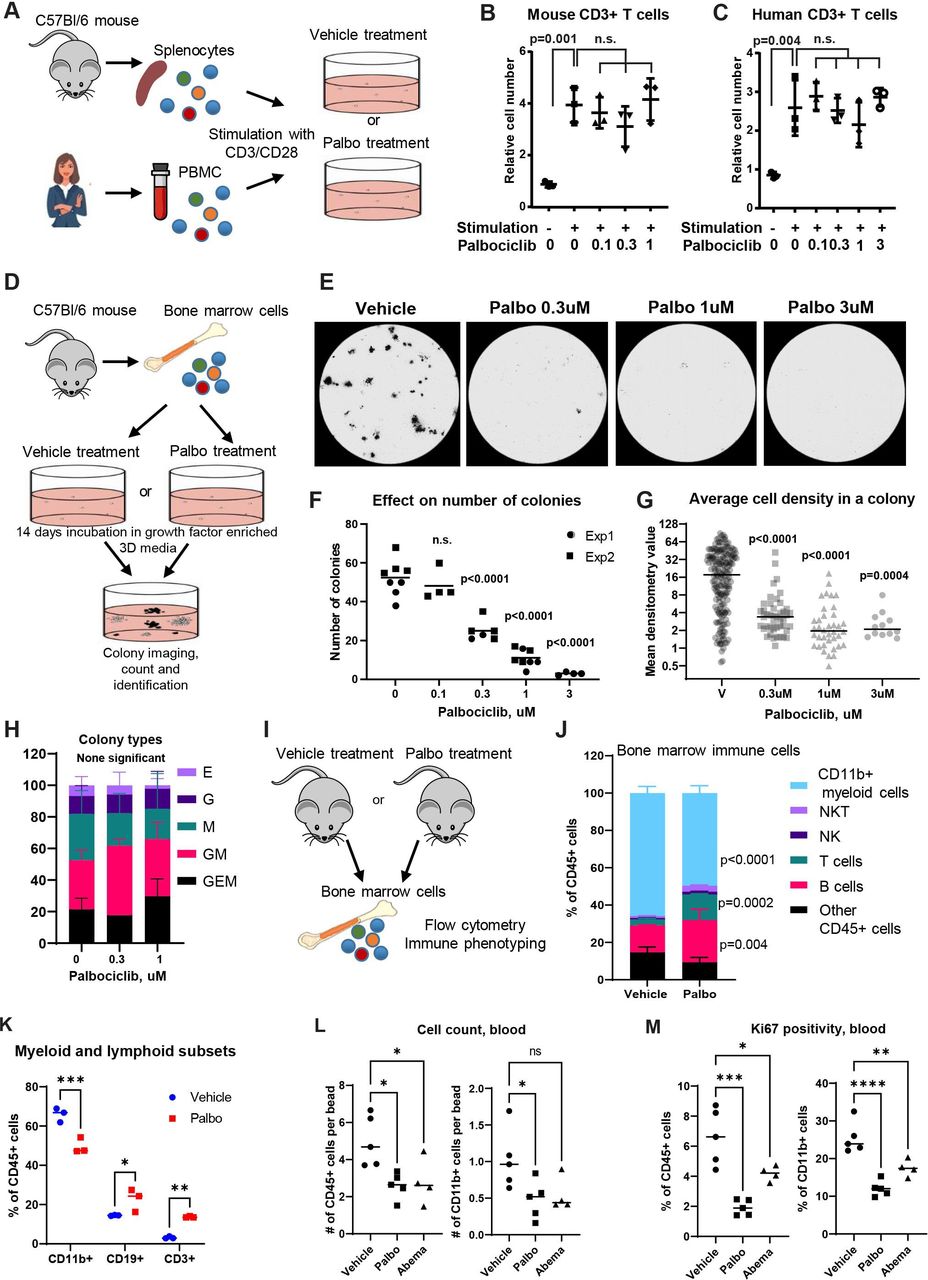
Based on the RNA-seq findings, we performed experiments to identify populations of immune cells sensitive to palbociclib. First, the effect of palbociclib on T-cell proliferation was investigated. Mouse spleen-derived T cells and human peripheral blood T cells were stimulated with plate-bound anti-CD3 and anti-CD28 antibodies for 3 days. Palbociclib was added to the culture plates at increasing concentrations (figure 2A–C). As a negative control, cells were incubated without T cell-stimulating antibodies. The stimulation induced the proliferation of mouse and human T cells. The addition of palbociclib had no significant effect on T-cell proliferation (figure 2B,C).
Bone marrow (BM)-derived myeloid cells are abundant in the tumor microenvironment (TME).26 The colony-forming unit (CFU) assay was used to assess the effect of CDK4/6i on the proliferation of BM-derived cell subsets. Mouse BM cells were incubated in three-dimensional culture media that was enriched with growth factors that commit progenitor cells to differentiation along monocytic, granulocytic, and erythroid lineages (figure 2D). Notably, CDK4/6i prominently suppressed proliferation of BM cells even at the lowest dose of 0.3 µM (figure 2E). Both the number of colonies and the number of cells per colony (colony density) were reduced by CDK4/6i (figure 2F,G). In contrast, the distribution of colony phenotypes (erythroid, granulocytic, monocytic, mixed) was not significantly altered (figure 2H). These findings suggest that palbociclib inhibits the proliferation of BM-derived cells, and this inhibition is evident across different progenitor lineages.
To determine if palbociclib modulated BM myelopoiesis in vivo, we treated tumor-free mice with vehicle or palbociclib and evaluated BM composition using flow cytometry (figure 2I). The percentages of CD11b+cells were significantly reduced within the BM leukocytes of palbociclib-treated mice as compared with vehicle-treated animals (figure 2J). Moreover, in accordance with myeloid compartment reduction, there was a proportional increase in the content of lymphoid cells, such as T and B cells, in the BM of palbociclib-treated mice (figure 2J,K). We next performed a similar experiment using PYMT-tumor bearing mice treated for 2 weeks with CDK4/6i palbociclib or abemaciclib (online supplemental figure S1A) and analyzed the numbers and Ki67 expression in immune cells from different tissues. We observed a reduction in total CD45+ cell numbers in peripheral blood that primarily affected myeloid compartment (figure 2L) and was associated with the reduction of the percentages of Ki67+cells within these cell populations (figure 2M, online supplemental figure S1C, blood plots). Cell content in the BM and spleen was not prominently affected, with the exception of an increase of T-cell populations in the BM (online supplemental figure S1B). However, there was a significant reduction in the percentages of Ki67+cells within the CD45+ and CD11b+cells in spleens of CDK4/6i-treated mice (online supplemental figure S1C). The majority of leukocytes in the BM were positive for Ki67, and this was not affected strongly by the treatments. However, we detected a moderate reduction in the Ki67 positivity in non-granulocytic myeloid cells in the BM of mice treated with palbociclib (online supplemental figure S1C). Intriguingly, we found reduced expression of Ki67 in CD4 and CD8 T cells in all tested tissues. One potential explanation is that there may be a delayed effect of CDK4/6i on the homeostatic proliferation of T cells. Interestingly, while the tumor inhibition was comparable in palbociclib and abemaciclib-treated mice, overall immune cell suppressing effects of abemaclib were often less pronounced, highlighting differences between agents within the CDK4/6i class. Taken together, these data suggest that hematopoiesis of myeloid immune cells is suppressed by CDK4/6i in vivo.
Supplemental material

Palbociclib inhibits the proliferation of bone marrow cells while T-cell proliferation is unaffected. (A) T-cell proliferation experiment scheme. Mouse splenocytes from C57BL/6 mice or human PBMCs were stimulated with CD3/CD28 antibodies for 3 days in the presence or absence of palbociclib. N=3 biological replicates per each treatment condition. (B) The relative number of mouse CD3+cells without stimulation and with stimulation in the presence of palbociclib. Statistical comparison between ‘0’ and other treatment groups was performed using one-way analysis of variance (ANOVA) with Tukey’s post-test with adjustment for multiple comparisons. (C) Same as in B, except human CD3+T cells were used. (D) Bone marrow cell proliferation experiment scheme. Mouse bone marrow cells were cultured for 14 days in three-dimensional (3D) growth factor-enriched media with and without palbociclib. Colony number, phenotype, and average cell density in colonies were compared. The experiment was performed twice with four biological replicates in each experiment. (E) Representative images of plates of 3D-cultured bone marrow cells after 14 days of incubation with and without palbociclib. Black colonies of various shapes and sizes are visible. (F) Count of bone marrow colonies per plate from two independent experiments, each with four biological replicates per concentration shown in D and E. Statistical analysis was performed using one-way ANOVA with Dunnett’s post-test adjusting for multiple comparisons. (G) Densitometry analysis of individual colonies formed by bone marrow cells with and without palbociclib. Statistical comparison between vehicle and palbociclib-treated groups was performed using one-way ANOVA with Tukey’s post-test. N=183 colonies for vehicle group, n=44 for palbo 0.3 μM, n=38 for palbo 1 µM, and n=12 for palbo 3 µM. (H) Types of colonies formed by bone marrow cells in the absence or presence of palbociclib. Colony types were identified based on morphology by evaluating high magnification photographs of plates shown in E. Statistical analysis of differences in frequencies of indicated colony types per plate between indicated treatment groups was performed using two-way ANOVA with Tukey’s post-test with adjustment for multiple comparisons. (I) Experiment scheme. Bone marrow cells from non-tumor-bearing C57Bl/6 mice treated with vehicle or palbociclib (100 mg/kg one time per day) for 1 week were assayed by flow cytometry. N=3 mice per treatment group. (J) Percentages of the indicated immune cells within the total population of CD45+leukocytes of the bone marrow in vehicle-treated and palbociclib-treated mice. Three mice in each treatment group were analyzed. (K) Percentages of CD11b+myeloid cells, CD19+B cells, and CD3e+T cells within CD45+cell in the bone marrow of vehicle-treated and palbociclib-treated mice. (L–M) PYMT-tumor bearing mice were treated with palbociclib, abemaciclib or vehicle for 15 days followed by fluorescence-activating cell sorting staining of RBC lyses peripheral blood samples. (L) Relative numbers of CD45+cells (left) and CD11b+cells (right) in 1 mL of blood determined using counting beads. Numbers are expressed as events in the population of interest divided by bead events, n’s are vehicle (n=5), palbociclib (n=5), abemaciclib (n=4). (M) Percentages of Ki67+cells within CD45+ (left) and CD11b+ (right) cell populations; n’s as in L. Statistical comparison between vehicle and treatment groups (palbociclib or abemaciclib) was performed using ANOVA with Dunnett’s post test. ns, not significant (p≥0.05), *p=0.01–0.05, **p=0.001–0.01, ***p=0.0001–0.001. NK, natural killer; PBMC, peripheral blood mononuclear cell; RBC, red blood cells.
CDK4/6i lowered the number of dendritic cells in the TME and inhibited their proliferation
We next investigated how palbociclib impacts the myeloid compartment of the TME. Mice inoculated with PYMT tumors were treated for 4 weeks with vehicle or palbociclib, and tumor-infiltrating myeloid cells were analyzed by flow cytometry (figure 3A, online supplemental table S1). Data was analyzed using the uniform manifold approximation and projection (UMAP) dimension reduction algorithm that distributed cells across two-dimensional plot based on similarity/differences in expression of tested markers (online supplemental figure S2A). Notably, the percentages of antigen-presenting cells (major histocompatibility complex (MHC)-II+) and specifically dendritic cells (DCs) (CD11c+, MHC-II+) were drastically reduced in palbociclib-treated mice (figure 3B). These changes affected both conventional DC (cDC)1 and cDC2 subsets (CD103+/CD11b− and CD103−/CD11b+, respectively). Of note, cDC2 cells were strongly over-represented in tumors (figure 3B). We further examined if DC loss in tumors was associated with palbociclib and abemaciclib-mediated systemic DC suppression. We found that treatment of PYMT-tumor bearing mice with palbociclib and abemaciclib (2 weeks treatment) resulted in significant reduction in absolute numbers of CD11c+MHC-IIhi DCs in peripheral blood and spleen (figure 3C). In BM, treatment with palbociclib showed significant reduction in CD11c+MHC-IIhi DCs numbers, while reduction was minor and not statistically significant in the abemaciclib-treated group (figure 3C). Treatment with either palbociclib or abemaciclib resulted in significant reduction of both cDC1 and cDC2 in peripheral blood (figure 3C). In spleen, palbociclib downmodulated both cDC1 and cDC2, whereas abemaciclib caused a statistically significant reduction only in cDC2 (figure 3C). In accordance with decreasing DC numbers, we observed a decrease in Ki67 expression in DCs from spleen and tumors (figure 3C), whereas proliferation of T cells in the tumor was not affected, based on Ki67 expression (online supplemental figure S2C).

Palbociclib treatment reduces dendritic cell infiltration in mammary tumors and inhibits dendritic cell differentiation ex vivo. (A) Scheme of tumor immune phenotyping experiment. Mice were inoculated with PYMT-C57 cells and treated with 100 mg/kg vehicle or palbociclib one time per day for 4 weeks. N=5 mice per treatment group. The tumor cell suspension was analyzed for immune cell surface marker expression using flow cytometry. (B) Percentages of CD11C+MHC+ dendritic cells and MHC+antigen-presenting cells within CD45+cells, cDC1 and cDC2 from individual tumors of the vehicle and palbociclib-treated mice. Statistical analysis of the difference between treatment groups was calculated using an unpaired t-test. (C–D) Immunophenotyping of BM, peripheral blood (blood) and spleen in PYMT-tumor bearing mice shown in figure 2L. CD11c+MHC-IIhi DCs, cDC1, cDC2 (C) and DC and monocyte precursors (D) were identified using a gating strategy described in online supplemental figure S3A. Dot plots show total cell numbers of immune cell subsets in indicated organs, n’s as in figure 2L. Statistical comparison between vehicle and treatment groups (palbociclib or abemaciclib) was performed using t-test. (E) Scheme of dendritic cell differentiation experiment. Murine bone marrow cells were cultured in the presence of GM-CSF and IL-4 with or without palbociclib. (F) Numbers of cells after 5 days of culture in DC differentiating conditions in the presence of vehicle or indicated doses of palbociclib. The experiment was performed in four biological replicates. Statistical comparison between vehicle and palbociclib treatment groups was performed using one-way analysis of variance with Dunnett’s post test. P values were adjusted for multiple comparisons. (G) Representative images of differentiated cells in indicated treatment groups from the experiment shown in D. (H–J) Murine bone marrow cells were cultured in the presence of GM-CSF and IL-4 (GM-CSF condition) or FLT3L and GM-CSF (FLT3 condition) with or without palbociclib for 8 days as described in methods. Percentages of Ki67+cells with the CD45+BMDCs were determined, percentage of Ki67 in undifferentiated (UnD) BM cells were determined as baseline. (H) Representative fluorescence-activating cell sorting plots of three independent experiments. (I) Dot plot showing %Ki67+CD45+ cells in indicated culture conditions. (J) Dot plots showing total numbers of BMDCs, cDC1 and cDC2 harvested in different culture conditions as described above. cDC1 and cDC2 percentages were determined (shown in online supplemental figure S2E) using gating strategy as described in online supplemental file 2 and total cell numbers were determined from their percentages and total BMDC numbers. Statistical comparison between vehicle and treatment groups (palbociclib or abemaciclib) was performed using a t-test. ns, not significant (p≥0.05), *p=0.01–0.05, **p=0.001–0.01, ***p=0.0001–0.001. BM, bone marrow; BMDC, bone marrow dendritic cell; cDC, conventional DC; CDP, common DC progenitor; cMoP, common monocyte progenitor; DC, dendritic cell; GM-CSF, granulocyte-macrophage colony-stimulating factor; IL, interleukin; MDP, monocyte and DC progenitor; MHC, major histocompatibility complex.
Since CDK4/6i therapy reduced DCs both systemically and in the TME, we analyzed if CDK4/6i therapy affected DC ontogeny by altering their precursors. The monocyte and DC progenitor (MDP) differentiates into common DC progenitor (CDP) and common monocyte progenitor (cMoP). Ly6Chi monocytes (referred to as Ly6Chi mono henceforth) are derived from cMoP while cDC1 and cDC2 are derived from the CDP.27 We found that palbociclib affected the numbers of MDP, CDP, cMoP, and Ly6Chi mono (identified as shown in online supplemental figure S3F) in the BM (figure 3D). Significant reduction in numbers of MDP and cMoP was seen in BM of abemaciclib-treated mice compared with vehicle-treated group (figure 3D). In the peripheral blood we saw a significant reduction in numbers of CDP and Ly6Chi mono in palbociclib and abemaciclib-treated groups compare to vehicle (figure 3D). In the spleen, palbociclib treatment significantly reduced the numbers of CDP, cMoP, and Ly6Chi mono and had a small effect on MDP, which was not statistically significant. Abemaciclib also reduced the numbers of MDP, CDP, cMoP and Ly6Chi mono, but these differences were not statistically significant (figure 3D). Thus, both palbociclib and abemaciclib affected DC precursors, DCs and DC subsets numbers, although there were some differences between the two drugs.
Based on these data, we hypothesized that palbociclib might negatively affect the differentiation of DCs from the BM progenitors. To test this hypothesis, we cultured mouse BM cells ex vivo in the presence of granulocyte-macrophage colony-stimulating factor(GM-CSF) and interleukin (IL)-4 (GM-CSF bone marrow dendritic cells (BMDCs)) or FLT3 and GM-CSF (FLT3-BMDCs) to induce DC differentiation (figure 3E). During incubation, cells were treated with either vehicle or palbociclib. We found that palbociclib significantly reduced the number of differentiated cells even at the lowest examined dose of 0.1 µM (figure 3F,G). Consequently, BMDC differentiation and proliferation were significantly affected resulting in significantly reduced BMDC numbers in both GM-CSF/IL-4 and FLT3/GM-CSF culture conditions (figure 3H,I). In agreement with our observation in vivo, the absolute numbers of MDP, CDP, cMoP, and Ly6Chi monocytes were significantly reduced (online supplemental figure S3C,D). Similarly, the numbers of cDC1 and cDC2 harvested using GM-CSF and FLT3 culture conditions were significantly reduced (figure 3J and online supplemental figure S3E).
CDK4/6i therapy inhibited DCs in patients with breast cancer
To determine if mouse model findings reflected CDK4/6i effects in human, we collected longitudinal peripheral blood samples from eight patients receiving palbociclib and endocrine therapy for the treatment of MBC either during their first cycle of treatment or subsequent cycles (table 1, figure 4A).
Patient, cancer, and treatment characteristics for human correlative studies

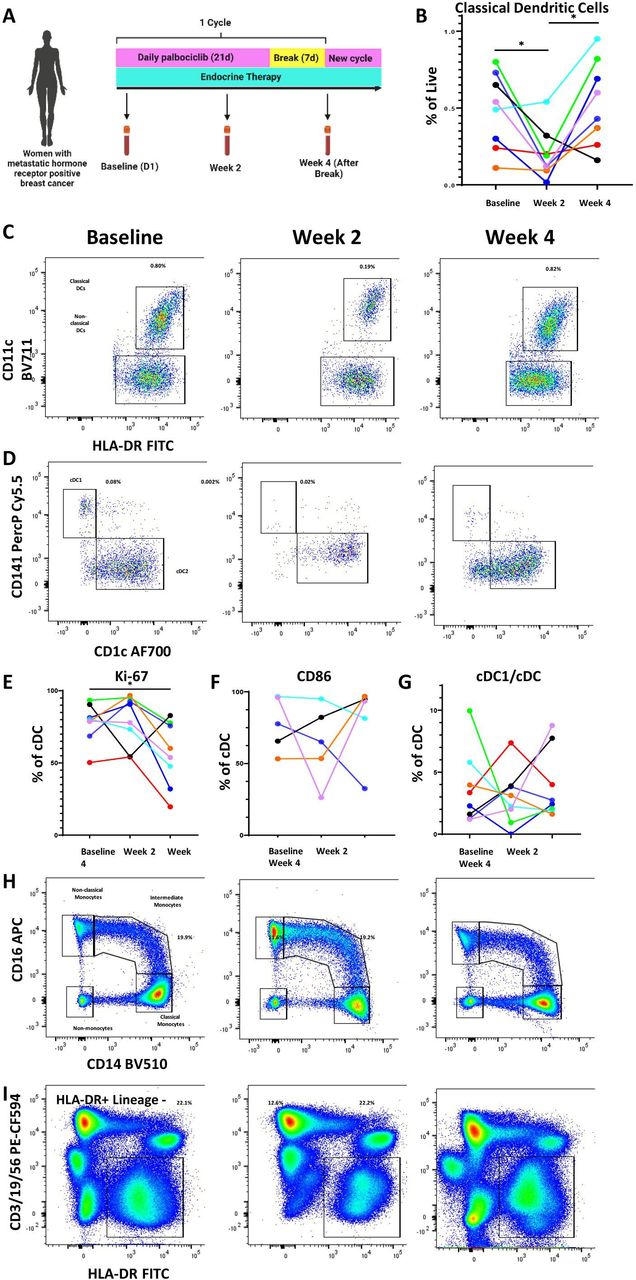
Palbociclib reduces dendritic cells and other antigen-presenting cell populations in the peripheral blood of patients with metastatic hormone receptor-positive breast cancer. (A) Schema of peripheral blood collection in patients with metastatic breast cancer receiving palbociclib. Blood was drawn at baseline, after 2 weeks on treatment, and at the end of 4-week cycle, which was 1 week after treatment break. (B–D) Longitudinal change in classical dendritic cells (CD11c+HLA-DR+) and representative flow plots. (C,D) Representative flow plots of DC1 and DC2 subtypes of classical dendritic cells. (E–G) Longitudinal change in cDC1 proliferation as measured by Ki-67, activation as measured by CD86, and cDC1 fraction of classical dendritic cells. (H–I) Representative flow plots of monocytes and HLA-DR+/lineage—antigen-presenting cells. All percentages on representative flow plots are the percentage of live cells; for (H) this is a summation of classical, intermediate, and non-classical monocytes as a percentage of live cells. Different patients are represented by unique colors corresponding to them throughout the plots. Longitudinal changes were assessed by the Wilcoxon matched pairs signed-rank test, and significant results were indicated with * (p<0.05). cDC, conventional DC; DC, dendritic cells; FITC, fluorescein isothiocyanate; HLA-DR, human leukocyte antigen – DR isotype.
The standard cycle of therapy consists of 3 weeks on palbociclib followed by 1-week break. Endocrine therapy continues through this treatment period without cessation. Blood was collected at baseline prior to starting palbociclib, at 2 weeks after starting palbociclib, and at 4 weeks (after 1 week of palbociclib break). A quarter of the patients provided samples during their first cycle of treatment, whereas the remaining provided samples at the beginning, middle, and end of a subsequent treatment cycle. Peripheral blood mononuclear cells were isolated and stained for DC markers per gating strategy in online supplemental figure S4. Consistent with our preclinical studies, we observed a decrease in cDCs after treatment with palbociclib. Interestingly, we observed a rebound at week 4, time at which patients had been off of palbociclib for 1 week (figure 4B,C). This was also seen among the cDC1 subset known to be important for T cell-mediated immunity (figure 4D, online supplemental figure S5A). While proliferation, as measured by Ki67 staining, was not negatively impacted by palbociclib therapy in a significant pattern by 2 weeks, there was an overall statistically significant decrease of Ki67+cells by the end of the cycle compared with the beginning (figure 4E). Though the number and proliferation of cDCs were impacted, activation as measured by CD86 and antigen presentation capacity as measured by human leukocyte antigen – DR isotype (HLA-DR) expression were not impacted in any consistent manner (figure 4F, online supplemental figure S5B). Additionally, the fraction of cDC subsets was not affected by palbociclib treatment (figure 4G). Analysis of other antigen presentation subsets showed a similar pattern with a decrease in peripheral blood plasmacytoid DCs (online supplemental figure S5C), monocytes (summation of classical, intermediate, and non-classical monocytes) (figure 4H, online supplemental figure S5D), and HLA-DR-positive antigen-presenting cells (figure 4I, online supplemental figure S5E). These data suggest that the inhibitory effect of palbociclib on myeloid cells is likely upstream, on precursor cells in the BM. For patients whose clinical blood results were available at matching time points (online supplemental file 2), a decrease in absolute monocyte count (AMC) at 2 weeks and rebound after 1 week treatment break mirrored our flow cytometry findings for monocytes and DCs. Absolute neutrophil counts also generally showed a similar pattern but did not mirror the cDC trend as closely as AMC (online supplemental figure S5G). Absolute lymphocyte counts did not change across treatment or after treatment break (online supplemental figure S5H).
Adoptive transfer of ex vivo differentiated BMDC enhanced the responsiveness of CDK4/6i-treated tumors to ICB
DC cells play an important role in initiating antitumor immune responses induced by immunotherapy.28 We hypothesized that palbociclib-induced reduction of DCs has a negative impact on immunotherapy response. Mice implanted with immunologically cold PYMT mammary tumors were treated with ICB (combined anti-PD-1 and anti-CTLA-4 antibodies) or matched isotype controls in combination with palbociclib or vehicle control (figure 5A). Palbociclib treatment alone, ICB treatment alone, or palbociclib treatment together with ICB caused similar tumor growth inhibition, which was modest, suggesting that the combination of ICB with CDK4/6i did not induce an additive or synergistic antitumor effect (figure 5B, online supplemental figure S6A,B). This result suggests that the addition of palbociclib to immunotherapy is not sufficient to enhance the antitumor immune responses in the studied PYMT breast cancer model, consistent with the immune cold nature of ER+breast cancer. However, we cannot exclude that similar treatment could be effective in immunogenic T cell-enriched tumor models reflective of immune hot cancers with pre-existing antitumor immune response.
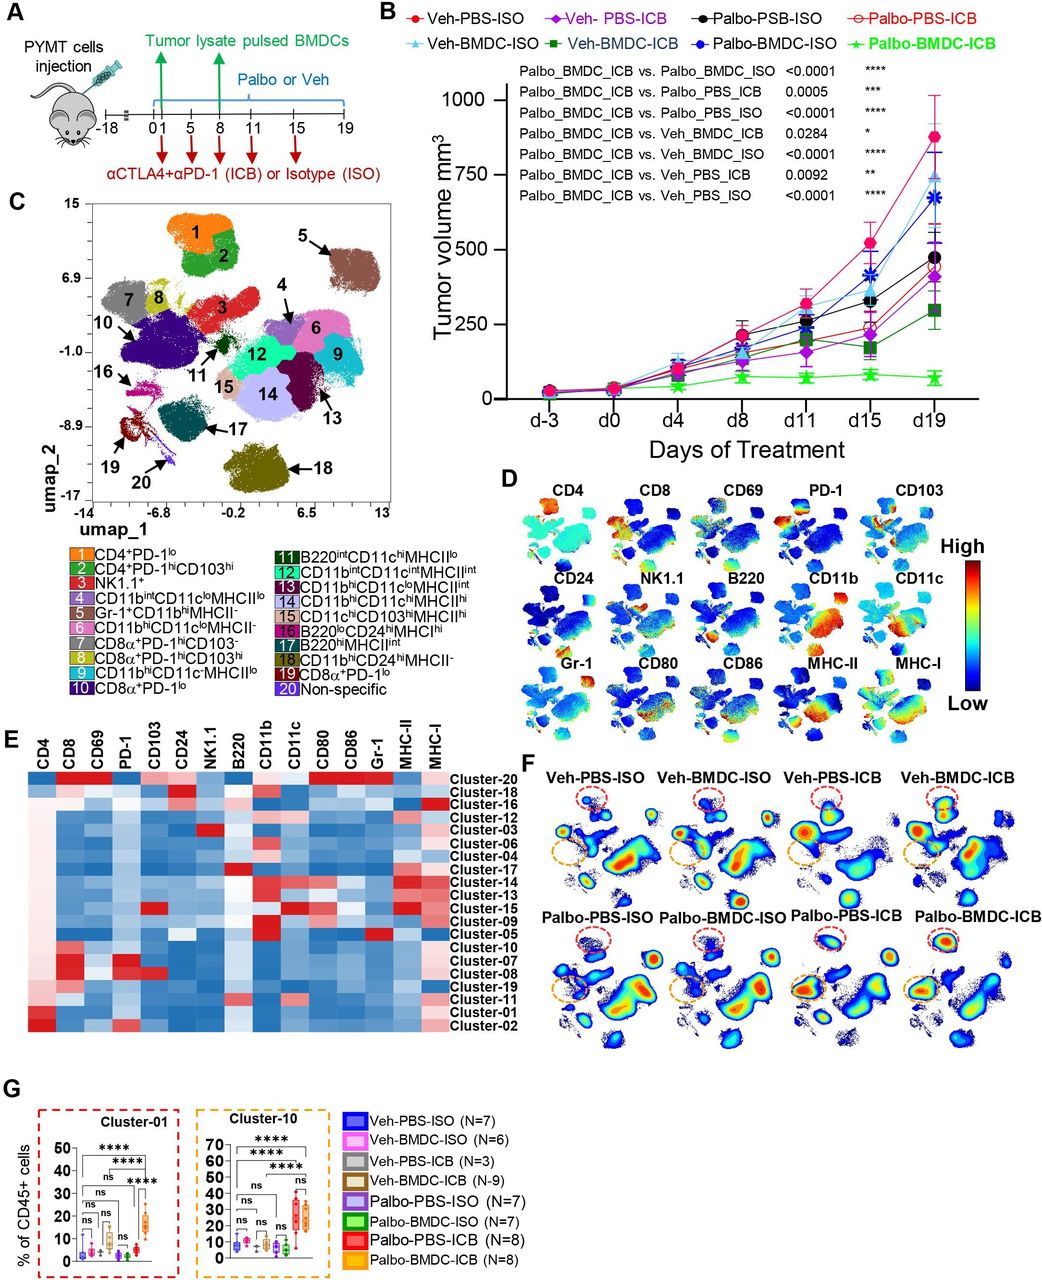
A combination of adoptive bone marrow dendritic cell (BMDC) therapy, palbociclib, and immune checkpoint blockade induced regression of MMTV-PYMT tumor and enhanced abundance of CD4 T cells in tumor microenvironment. (A) Schema of treatment. PYMT tumor-bearing mice were treated with palbociclib or vehicle control and received two intravenous injections of 5×10⁶ BMDCs on d1 and d8. Immunotherapy (cytotoxic T-lymphocyte antigen 4 and PD-1 antibodies) or isotype controls at 100 µg/mouse for each antibody were administered on d1, d5, d8, d11, and d15. Tumors were harvested on day 19. (B) Tumor volume change over time (experimental schema described in A; N=8–10 mice per treatment group on days 0–d17 and N=5–8 mice per treatment group on d19. Statistical analysis using mixed model with Dunnett’s post test was performed to compare tumor growth in different treatment groups. (C–G) The tumor cell suspensions collected on day 19 from indicated groups in the experiment in B were analyzed for immune cell markers expression using spectral flow cytometry, and data were analyzed using OMIQ software (groups and N’s as shown in G (parenthesis). (C–H) UMAP plots were constructed for multiparametrical representation of multicolor flow cytometry data using concatenated sample including 5000 cells per biological replicate. CD45+ cells were clustered using the consensus clustering method to identify 20 distinct immune cell clusters and visualized on UMAP space. A total of 55 samples from all groups were concatenated. (D) Individual marker expression pattern in cell islands is visualized on UMAP space. (E) Cluster-by-marker heat map generated using median expression of flow cytometry markers in each cluster. (F) Contour plots were used to visualize the density of clusters/immune cells throughout the regions of UMAP space. (G) Box plots showing CD4 T and CD8 T cells cluster frequencies in each treatment group. Statistical comparison between treatment groups was performed using one-way analysis of variance with Tukey’s post-test with adjustment for multiple comparisons. ns, not significant (p≥0.05), *p=0.01–0.05, **p=0.001–0.01, ***p=0.0001–0.001, ****p<0.0001. ICB, immune checkpoint blockade; MHC, major histocompatibility complex; PBS, phosphate buffered saline; PD-1, programmed cell death protein-1; UMAP, uniform manifold approximation and projection.
Our studies described above revealed that palbociclib treatment inhibited DC proliferation and significantly decreased the numbers of DCs in TME. Therefore, we explored the possibility that providing ex vivo differentiated DCs could overcome the ICB resistance in CDK4/6i-treated tumors. To generate tumor-specific DCs, we cultured BM cells from C57BL/6 mice in the presence of GM-CSF and IL-4 for 10 days and pulsed them with PYMT tumor lysate and tumor necrosis factor (TNF)-α for 16–18 hours to induce their maturation. Resulting BM-derived DCs (hereafter BMDCs) were injected into PYMT tumor-bearing mice treated with palbociclib or vehicle in combination with ICB or isotype control. Control mice received mock injections with saline (figure 5A). We found that the antitumor effect of palbociclib and ICB therapy was dramatically improved in mice that received BMDCs (figure 5B, online supplemental figure S6A,B). Cumulatively, these data suggest that CDK4/6i-mediated inhibition of DCs limited the efficacy of CDK4/6i and ICB therapy.
Addition of ex vivo activated DCs enabled effective CD4 T-cell responses after CDK4/6i and ICB therapy
To uncover the functional consequences of DC loss in the TME, we assessed the composition of tumor immune infiltrate in mice treated with palbociclib and ICB with or without BMDC using high dimensional spectral cytometry (online supplemental table S1). Using UMAP dimensionality reduction and FlowSOM clustering algorithms, we identified 20 distinct clusters of CD45+ tumor-infiltrating leukocytes (figure 5C). Expression of tested markers across UMAP and in individual clusters is shown in figure 5D,E, respectively. Based on these data, we annotated distinct subpopulations of CD4 T cells (clusters 1, 2), CD8 T cells (cluster 7, 8, 10, 19), B cells (clusters 11, 16, 17), natural killer (NK) cells (cluster 3), and myeloid cells (clusters 4, 5, 6, 9, 12, 13, 14, 15 and 18) (figure 5C, see annotations below the plot). Prominent enrichment of PD-1-negative CD4 T cells (cluster 1, CD4+PD-1lo) was the main distinguishing feature of tumors treated with palbociclib, ICB, and BMDC combination, the only treatment that abrogated tumor growth (figure 5F,G). We also observed a significant enrichment of PD-1-negative CD8 T cells (cluster 10, CD8+PD-1lo) in tumors treated with palbociclib and ICB with and without BMDCs (figure 5F,G). Consistent with prior observations, there was a decrease in proportions of a DC subset in palbociclib-treated tumors (online supplemental figure S6C, cluster 15). No major changes in myeloid subsets in association with BMDC addition to palbociclib and ICB therapy were detected (online supplemental figure S6C). We confirmed enrichment of cells with cluster 1 like phenotype (PD-1lo/CD4+) in triple therapy group and cluster 10 like phenotype (PD-1lo/CD8+) in palbociclib and BMDC groups using traditional gating (online supplemental figure S6D). We also found that treatment with BMDC and ICB (with and without palbociclib) increased CD4 T cells in the tumor, while palbociclib and ICB (with and without BMDC) increased CD8 T cells (figure 6A). PD-1lo phenotype in CD4 or CD8 T cells was associated with palbociclib and ICB treatment (figure 6B). Treatment with ICB (regardless of co-treatment) downregulated the proportion of KLRG1− CD4 T cells, but not CD8 T cells (online supplemental figure S7C). In contrast to PD-1 and KLRG1, CD69 expression on T cells was not significantly affected by any of the tested treatments (online supplemental figure S7D). Based on these data, we defined PD-1–/KLRG1– CD4 T cells as a key population associated with triple therapy. Specifically, palbociclib and ICB treatment converted virtually all tumor CD4 T cells into PD-1–/KLRG1– phenotype, while the addition of BMDC enriched these cells within the tumor (online supplemental figure S7E).

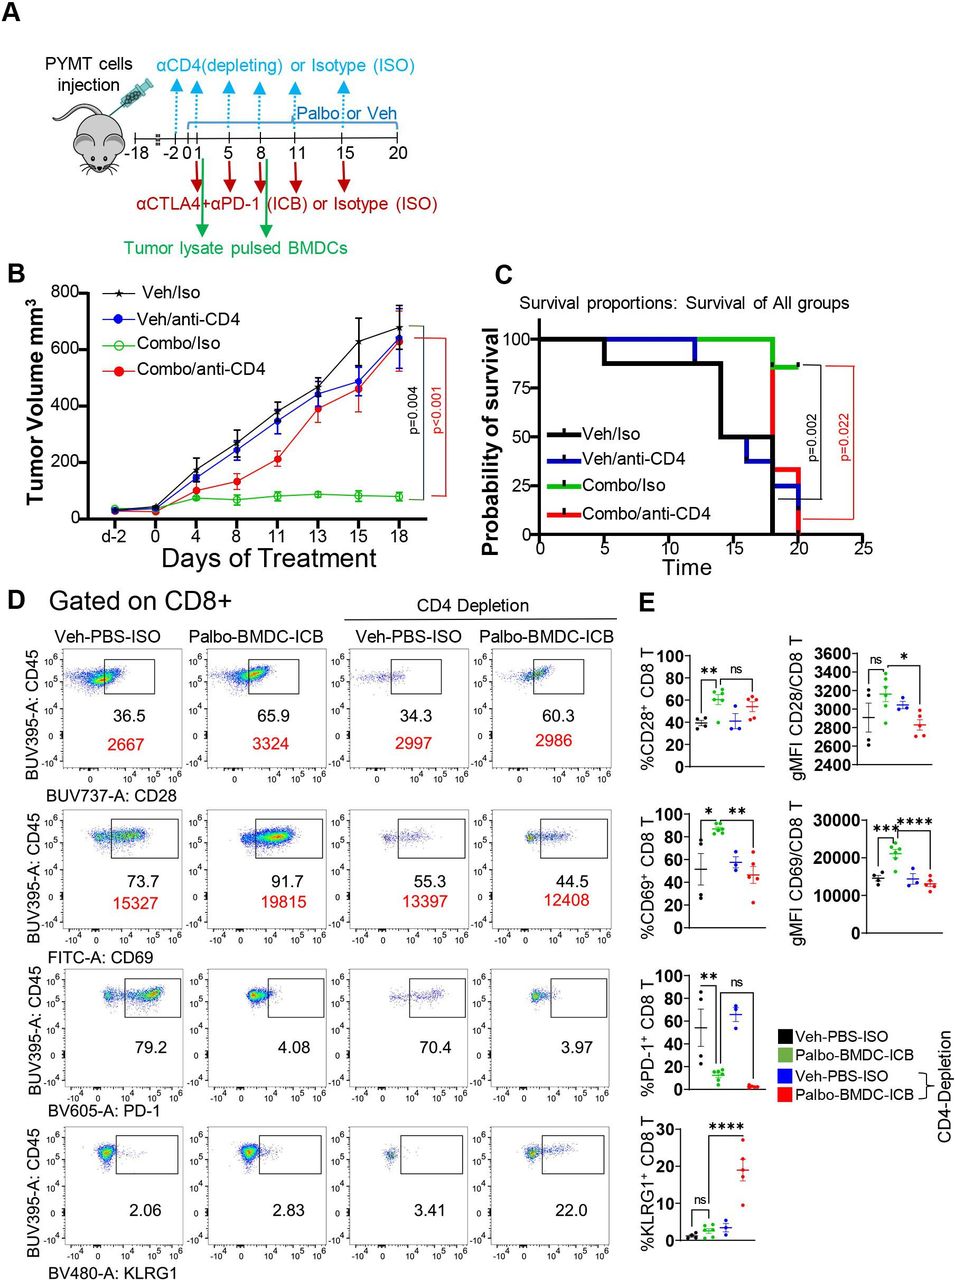
Depleting CD4 T cells in mice treated with CDK4/6i, ICB, and BMDC impairs CD8 T-cell activation and abrogates tumor response. (A) Design of an animal experiment testing the role of CD4 T cells in antitumor immune response induced by CDK4/6i, ICB, and BMDC therapy. Female mice implanted with PYMT tumors were treated with palbociclib or vehicle and received two intravenous injections of 5×10⁶ BMDCs on d1 and d8. Immunotherapy (cytotoxic T-lymphocyte antigen 4 and PD-1 antibodies) or isotype controls at 100 µg/mouse for each antibody were administered on d1, d5, d8, d11 and d15 and CD4 depleting or non-depleting (isotype controls) antibodies were administered on d−2, d1, d5, d8, d11 and d15. (B,C) PYMT tumor-bearing mice were treated as shown in A. (B) Tumor volume change over time (experiment described in A; N=6–8 mice per treatment group days 0–d13 and N=3–6 mice per treatment group on d15−d18. Statistical analysis to compare the differences of different treatment was done using linear mixed model accounting for within-subject correlation. The p values (tabulated) were adjusted by Turkey’s method for multiple comparisons. (C) Survival of mice shown in A. Curves were compared using log-rank test, p values were adjusted in Dunnett’s test. (D,E). Tumor single cell suspensions from groups treated as in A were analyzed using spectral cytometer followed by data analysis using FlowJo. Representative pseudocolor plots (D) from indicated treatment groups and graphs (E) show differences in cell frequencies, N=3–6 mice per group. Statistical comparison between treatment groups was performed using one-way analysis of variance with Tukey’s post-test with adjustment for multiple comparisons. ns, not significant (p≥0.05), *p=0.01–0.05, **p=0.001–0.01, ***p=0.0001–0.001, ****p<0.0001. APC, allophycocyanin; BMDC, bone marrow dendritic cell; CDK 4/6i, cyclin-dependent kinase 4/6 inhibitors; FITC, fluorescein isothiocyanate; gMFI, geometric mean fluorescence intensity; ICB, immune checkpoint blockade; PBS, phosphate buffered saline; PD-1, programmed cell death protein-1.
In summary, palbociclib and ICB therapy enriched PD-1-negative CD8 T cells in the TME, while addition of BMDC to palbociclib and ICB treatment enriched PD-1-negative and KLRG1-negative CD4 T cells. These conclusions remained accurate when we specifically gated T-cell receptor-β+CD11b–CD11c–cells to focus on T cells (online supplemental figures S8,9). Consistent with prior studies, we observed a decrease of CD4+Foxp3+ cells in groups receiving palbociclib, however it was not significantly affected by the BMDC addition (online supplemental figure S10A,B).
Systemic immunity is important for effective cancer immunotherapy.29 30 To gain insight into systemic immune modulation by CDK4/6i, ICB, and BMDC therapy, we examined peripheral blood of mice shown in figure 5A using spectral cytometry (online supplemental figure S11A–C). Similar to TME data, CD4 T cells were most abundant in the blood of mice receiving palbociclib and ICB with BMDC and were significantly enriched compared with vehicle-treated mice (online supplemental figure S11D,E, cluster 1). We also noted that the proportion of NK1.1+CD11c+ cells (cluster 6) was significantly reduced in peripheral blood of groups receiving palbociclib compared with vehicle control (online supplemental figure S11D,E), however the functional significance of these cells remains unclear.
Altogether, these results suggest that mammary tumors had high levels exhausted PD-1hi CD4 and CD8 T cells in TME and neither ICB alone or palbociclib alone were able to deplete these cells. Combining palbociclib and ICB invigorated CD8 T cells in the TME but failed to improve tumor responses. Notably, adding ex vivo differentiated BMDC to CDK4/6i and ICB treatment also engaged CD4 T-cell responses systemically and in the periphery, which were associated with strongly augmented treatment response.
CDK4/6i, BMDC, and ICB combination promoted CD4 T-cell and CD8 T-cell mediated type I and type II immunity
We sought to investigate the phenotype of CD4 T cells enriched by palbociclib-ICB-BMDC combination by comparing gated CD4 T cells in peripheral blood and in TME of mice receiving triple therapy or control mock therapy (online supplemental figure S12). Triple therapy increased the proportion of CD4 T cells expressing co-stimulatory and T-cell activation marker CD28 in peripheral blood and TME (figure 7A–B, online supplemental figure S13A,B). As assessed by geometric mean fluorescence intensity (gMFI), CD4 T cells in triple therapy-treated mice also displayed increased surface expression of CD28 on a per cell basis (figure 7A,B, online supplemental figure S13A,B). We also noted a trend towards an enhanced proportion of activated CD69+CD4 T and CD44hiCD62L−CD4 T cells both in the peripheral blood and the TME of the triple therapy group compared with vehicle control (figure 7A–B, online supplemental figure S13A,B). Consistent with immunophenotyping data above, mice receiving triple therapy lacked CD4+PD-1+ cells in the TME, which was associated with their lower abundance in the peripheral blood (figure 7A,B, online supplemental figure S13A,B). Furthermore, fewer CD4 T cells expressed an exhaustion marker KLRG1 in the triple therapy group compared with the treatment-naive group, and these differences were statistically significant in the TME (figure 7A,B).
Combination of cyclin-dependent kinase 4/6 inhibitors, BMDC, and ICB promotes CD4-Th1 and CD4-Th2 immunity, suppresses CD4+Foxp3+ regulatory T cells, and enhances proportion of Tbethi and Eomeshi CD8+T cells in tumor microenvironment. (A–H) PYMT tumor-bearing mice were treated with triple therapy (palbociclib, BMDC, and anti-PD-1 and anti-CTLA-4 antibodies) as described in figure 5A (N=6) or control treatment (vehicle, PBS, and isotype control antibodies; N=4). Single-cell suspensions from tumors were analyzed for expression of surface receptors and nuclear transcription factors (online supplemental table 2). The gating scheme to identify CD4+ and CD8+ T cells is shown in online supplemental figure S12. (A–F) CD4 T cells were further gated to identify indicated surface and nuclear markers. Representative pseudocolor plots showing surface markers (A, C, E) and graphs (B, D, F) showing differences in frequencies between triple therapy and the corresponding control group are shown. (G–H) CD8 T cells were gated to identify Tbethi and Eomeshi populations. Representative fluorescence-activating cell sorting plots (G) and graph (H) depicting differences in frequencies between the triple therapy and the control group are shown. Statistical significance in B, D, F and H were assessed by t-test. ns, not significant (p≥0.05), *p=0.01–0.05, **p=0.001–0.01, ***p=0.0001–0.001, ****p<0.0001. BMDC, bone marrow dendritic cell; CTLA-4, cytotoxic T-lymphocyte antigen 4; FITC, fluorescein isothiocyanate; gMFI, geometric mean fluorescence intensity; ICB, immune checkpoint blockade; PBS, phosphate buffered saline; PD-1, programmed cell death protein-1; Th, T helper cells.
It has been reported that PD-1 blockade can amplify PD-1+ regulatory T cells (Tregs) linked with cancer hyperprogression.31 Notably, the triple therapy significantly downmodulated CD4+CD25+Foxp3+ Tregs in the TME, including PD-1+ Tregs (figure 7C,D), which was also seen in the periphery (online supplemental figure 13C,D). We further noted that triple therapy suppressed proliferation of Foxp3+ Tregs as assessed by Ki-67 staining (Foxp3+Ki-67+), while proportions of proliferating non-Treg CD4 cells (Foxp3−Ki-67+) in the triple therapy group was similar to the control group in TME (figure 7C,D) and elevated in peripheral blood (online supplemental figure 13C,D). These results suggest that the triple therapy is highly effective in suppressing tumor-promoting Tregs and exhausted/hyporesponsive PD-1+ and KLRG1+ CD4 T cells, while promoting CD4 T cells activation.
Depending on the cytokine milieu, naïve CD4 T cells can differentiate into T helper cells (Th)1, Th2, or Th17 subsets. We assessed the intracellular expression of transcription factors (TFs) driving distinct Th cell differentiation programs. Notably, triple therapy increased the proportion of Tbethi and Eomeshi CD4 T (Th1) cells and the levels of Tbet expression per cell in the TME and periphery, although the difference did not reach statistical significance in the TME (figure 7E F and online supplemental figure S13E,F). We also found significantly enhanced proportions of GATA3hiCD4 T (Th2) cells and overall GATA3 (gMFI) expression on CD4 T cells in the TME and peripheral blood of triple therapy-treated mice compared with treatment-naïve animals (figure 7E,F, online supplemental figure S13E,F). We also evaluated TF expression in CD8 T cells. Tbet and Eomes have been implicated in CD8 T cell-mediated antitumor immunity.32 Notably, triple therapy significantly increased the proportions of Eomes and Tbet-expressing CD8 T cells and increased Eomes expression in peripheral blood and TME (figure 7G,H and online supplemental figure S13G,H). Thus, the triple therapy promoted local and systemic CD4 and CD8 T-cell mediated Th1 immunity and CD4 T-cell mediated Th2 immunity.
CD4 T cells were required for tumor inhibition and activation of CD8 T cells by CDK4/6i, IBC, and BMDC combination
To determine the functional significance of CD4 T cells in tumor response to triple therapy, we used the CD4 depletion strategy. PYMT tumor-bearing mice receiving triple therapy or mock treatment also received injections of CD4-depleting antibody or non-depleting antibody of matched isotype (figure 6A). As expected, mice treated with anti-CD4 displayed nearly complete loss of CD4 T cells in TME and in circulation (online supplemental figure S14). Remarkably, depletion of CD4 T cells completely abrogated the antitumor activity and survival benefit of the triple therapy (figure 6B,C, online supplemental figure S15A,B). Depletion of CD4 T cells in the control group did not affect tumor growth or survival (figure 6B,C, online supplemental figure S15A,B). Based on these results, we concluded that CD4 T cells were critical for tumor response to CDK4/6i, IBC, and BMDC combination.
Adequate CD4 T-cell help is essential for optimal differentiation of CD8 T cells into cytotoxic (CTL) effector and memory cells.33 34 Therefore, we evaluated CD8 T-cell activation status in the presence or absence of CD4 T cells. Consistent with the results presented above, mice treated with triple therapy had significantly enhanced proportions or CD69hi CD8 T cells in TME compared with the control group (figure 6D,E). Importantly, we found that depletion of CD4 T cells significantly reduced the proportions of CD69hi CD8 T cells and CD69 expression on per cell basis (gMFI) in TME of triple therapy-treated mice (figure 6D,E). CD4 depletion also abrogated triple therapy-mediated of CD28 expression (gMFI) on CD8 T cells, while the decrease of PD-1hi CD8 T cells occurred independent of CD4 T-cell depletion (figure 6D,E). Interestingly, we noted a higher proportion of terminally exhausted KLRG1hi CD8 T cells in TME and peripheral blood of CD4-depleted mice compared with animals with intact CD4 T cells (figure 6D,E and online supplemental figure S15C,D). We repeated the experiment with CD4 depletion including dual combination of palbociclib and ICB groups. We found that loss of CD4 T cells limited the antitumor effect of palbo+ICB, similarly to triple combination (online supplemental figure S16A,B). Notably, there was no significant difference in tumor growth inhibition between palbo+ICB and triple combination therapy in the CD4-depleted mice, indicating that improved antitumor activity after the addition of BMDC to palbociclib and ICB required CD4 T cells. These findings suggest that the combination of exogenous BMDC, palbociclib, and ICB boosted antitumor immunity through enhanced abundance and activation of CD4 T cells that were critical for optimal activation of CD8 T cells and effective tumor inhibition.
Discussion
Our study demonstrated the differential effect of CDK4/6i palbociclib on the tumor-infiltrating immune cells and systemic immunity. Specifically, we observed that CDK4/6i inhibited the proliferation of myeloid cell progenitors in the BM. Myelosuppression can lead to a deficit of leukocytes in the blood, or leukopenia, which is considered an immunosuppressive state. Moreover, BM-derived innate immune cells play a major role in jump-starting T cell-mediated adaptive immunity.35 Our findings on the myelosuppressive effect of palbociclib are consistent with the preclinical study by Hu et al showing that palbociclib inhibited the cell cycle in BM cells in rats and dogs.36 Furthermore, a recent study using a melanoma model showed that loss of myeloid subsets after treatment with CDK4/6, BRAF, and MEK was detrimental to antitumor immunity.37
One of the BM-derived cells that are crucial for the processing and presentation of the tumor neoantigens to T cells and T cell cross-priming are DCs (26).38 39 Our analysis of patient samples and mouse model studies revealed that palbociclib treatment was associated with a deficit of DCs in the TME, including cDC1 (CD103+DCs) important for antigen cross presentation and cDC2 implicated in activation of antitumor CD4 T-cell responses.40 41
Restoration of DC function through adoptive transfer of exogenously-matured BMDCs dramatically improved tumor response to CDK4/6i and ICB treatment. Thus, our study provides strong evidence that the limited efficacy of combined CDK4/6i and ICB therapies, observed in clinical trials, is likely linked with the inhibitory effect of CDK4/6i on DCs. It also implies that DC therapy can be applied to enhance CDK4/6 and immunotherapy responses in the clinic. DC-based vaccine therapies have reached phase III clinical trials for melanoma, prostate cancer, malignant glioma, and renal cell carcinoma.42 Also, in patients with breast cancer, HER2/neu (E75)-peptide, Muc-1-peptide and p53-peptide-pulsed DCs have been shown to prevent recurrence.43 44 In addition, adoptive DC therapies have been found to be safe.42 45 Currently DC-based therapies are being extensively explored42 45 with over 20 clinical trials evaluating DC vaccination alone or in combination with T cells or cytokine-induced killer cells in patients with breast cancer.45 46
The role of systemic immune activation in immunotherapy response is being increasingly appreciated.30 Accumulating evidence suggests that rather than reinvigorating existing immune responses, immunotherapies induce de novo immune responses.30 It has been shown that intravenous-transferred BMDCs prime T cells responses and boost systemic antitumor immunity.47 Exogenous BMDCs, with or without antigen pulsing, were effective in controlling metastasis of aggressive B16-F10 melanoma tumors.48 Here we showed that palbociclib, ICB and BMDC treatment promoted CD4 T-cell function systemically and in the TME, however, it remains to be determined whether BMDCs boosted tumor antigen-specific CD4 T-cell responses, non-tumor antigen-specific CD4 T-cell responses, or both. Our working model is that palbociclib, ICB, and BMDC combination generated de novo CD4 T-mediated immune responses in the periphery. We have previously shown that palbociclib causes tumors to produce chemokines that enhance the recruitment of T cells into the tumor.15 Thus, it is plausible that chemokine-mediated migration drove the accumulation of CD4 T cells in the TME. We showed that CD4 T-cell enrichment was critical for enhanced tumor control. This finding align well with the data reported by Spitzer et al that CD4 T cells, isolated from peripheral lymphoid organs of mice that rejected mammary tumors were superior at controlling tumors in treatment-naïve mice compared with CD8 T cells.49 The conclusion from this work and our findings is that peripheral activated CD4 T cells can orchestrate potent antitumor immunity.
During priming, CD8 T cells undergo a phase of reversible dysfunction followed by a state of terminal exhaustion or irreversible dysfunction.33 These (pre-)dysfunctional CD8 T cells are suggested to respond to PD-1 targeted therapy.33 We observed that CD8 T cells undergo terminal exhaustion in the absence of CD4 T cells, which is associated with loss of tumor response to CDK4/6i, IBC, and BMDC therapy. This provides compelling evidence that enrichment of activated CD4 T cells by exogenous BMDCs is critical for priming robust and persistent CD8 T-cell responses.
Our study further refined the understanding of the differential effects of CDK4/6i on CD4 T-cell subsets. It has been previously described that CDK4/6i suppressed Tregs while promoting effector CD8 T-cell functions.10 Notably, our novel therapy combining CDK4/6i, IBC, and BMDC blocked the proliferation of Tregs, while increasing the proportions of CD4-Th1 and CD4-Th2 cells in the periphery and TME. The enrichment of CD4-Th2 cells was remarkable in the triple therapy group, especially in the peripheral blood, where their proportions were almost negligible in the treatment-naïve group but highly enriched in the triple therapy group. Recent studies have suggested that Th2 cells can have an anticancer function in solid tumors.50 Notably, cytotoxic CD4 T cells with direct tumor-killing potential have been described in preclinical and clinical studies.51 Thus, our study provides an evidence of CD4 T-cell mediated antitumor immunity in the context of breast cancer and identifies a clinically-relevant strategy to enhance using palbociclib and DC therapies. It should be noted that the clinical trials combining CDK4/6i with ICB were met with concerns about efficacy and toxicities, particularly hepatic and pulmonary.19 Therefore, future clinical approaches must determine an optimal combination that balances enhanced efficacy with limited toxicities.
In summary, we provide evidence that palbociclib-mediated myelosuppression can limit antitumor immunity and immunotherapy responses. This detriment can be overcome by restoring the DC function via exogenous DC delivery. These findings can empower effective CDK4/6i and immunotherapy combination treatments to establish antitumor immunity and ultimately improve the prognosis for patients with breast cancer.
Materials and methods
Study design
Mouse studies
All animal experiments were approved by the Ohio State University and Vanderbilt University institutional animal care and use committee (IACUC), protocol number #2019A00000119. Female PYMT FVB mice were bred in the house. For the transplanted model, the PYMT C57BL/6 line was provided by Harold Moses (Vanderbilt University, Nashville). This cell line was derived by his group from a spontaneous tumor developed by the MMTV-PYMT mouse crossed to C57BL/6 background. To inoculate tumors, 100,000 PYMT C57BL/6 cells were injected into fourth mammary fat pad of female C57Bl/6 mice. Palbociclib for animal experiments was provided by Pfizer or purchased from LC Laboratories and administered by oral gavage one time per day at 100 mg/kg. Abemaciclib was purchased from MedChemExpress (HY-16297A). A working suspension of the drugs were made in 0.5% methylcellulose and vortexed prior to each administration. Anti-PD-1, Anti-CTLA-4, anti-OX40, and anti-4-1BB were purchased from Bio X Cell and administered via intraperitoneal injection in phosphate-buffered saline (PBS) at 100 µg/mice/injection. Anti-CD4 was injected at 300 µg/mice/injection. Purchase information is as follows: anti-PD-1—clone 29F.1A12, Catalog# BE0273 anti-CTLA-4—clone 9H10, Catalog# BE0131; anti-OX40—clone OX-86, Catalog# BE0031; anti-41BB—clone 3H3, Catalog# BE0239, anti-CD4—clone GK1.5, catalog BE0003-1 (CD4 depleting).
Human studies
A cohort of eight patients was included in this study. Patients were treated at the University of Texas Southwestern Medical Center between June 2021, and January 2022, and had peripheral blood samples collected with appropriate written informed consent (STU2019-1269). Longitudinal blood samples were collected at the start of a new cycle of palbociclib with endocrine therapy, 2 weeks after treatment start, and at the end of 4-week cycle (after 1-week treatment break) (figure 4A). Details on treatment and basic demographics are described in table 1. Medical chart was reviewed to obtain absolute neutrophil, monocyte, and lymphocyte counts for patients who had a standard of care complete blood count analysis at the time of blood draw in addition to research testing with flow cytometry.
Flow cytometry
Mouse samples
Mouse BM cells were obtained by flushing mouse tibias and femurs with PBS. Peripheral blood mononuclear cells (PBMCs) were derived from the blood by density gradient centrifugation. Single cell suspensions from mouse spleen were obtained by triturating spleen through 70 µm cell strainer with back of syringe plunger on a 50 mL conical tubes. To obtain tumor cell suspensions, tumors were minced with a scalpel and processed on gentleMACS dissociator in the presence of tissue digesting enzymes (Miltenyi Biotec). Cell suspensions were filtered through the cell strainers (BD), incubated with antibodies blocking Fc family of receptors (Fc blocking antibody, BD Pharmingen), and a fixable viability dye (Live/Dead Aqua, Thermo Fisher). Lysis of red blood cells (RBCs) was performed using the ammonium-chloride-potassium (ACK) lysis buffer. Next, cells were incubated with fluorescently labeled antibodies (online supplemental table S1), fixed with 0.5% paraformaldehyde, and analyzed by flow cytometry. Analysis of immune cell populations and t-distributed stochastic neighbor embedding (t-SNE) plots were performed using FlowJo V.10.1 (Tree Star) and OMIQ (http://omiq.ai). Spectral flow cytometry analysis measured the expression of surface or intracellular (nuclear) markers (online supplemental table S1) to characterize tumor-infiltrating immune cell subsets. Single-cell suspensions were surface stained followed by nuclear staining using eBiosciences/Invitrogen Foxp3/transcription factor staining buffer set (Ref 00-5523-00) according to the manufacturer’s instructions. We used the UMAP algorithm implemented in OMIQ software for dimensionality reduction of data. The marker expression across the cell islands was visualized on UMAP plots and indicated cell types present within the cell islands. FlowSOM clustering algorithm with consensus clustering metaclustering, which has been demonstrated to scale well to large cytometry data, was used to distinguish cell populations present within the cell islands and visualized on the UMAP plots. A clustered heatmap analysis implemented in OMIQ was created to give an overview of marker expression within each cluster. Immune cell types were annotated by visually investigating median marker expression across clusters in heatmap and expression of these markers in cell islands as visualized on UMAP space. Gating strategies for identifying CD4 T and CD8 T cells to assess surface and nuclear markers using FlowJo V.10.1 (Tree Star) are shown in online supplemental figure S9. AccuCheck counting beads (Thermo Fisher Scientific) were included in samples to allow for calculation of absolute CD45 cell counts as per the manufacturer’s instructions. Total cell counts of immune cell subsets were calculated from their percentages (% of CD45).
Human samples
Freshly prepared PBMC were isolated from the patients’ blood by Ficoll-Paque (Cytiva). Cells were incubated with RBC Lysis Buffer (Sigma) for 5 min, followed by two times washing with Dulbecco's phosphate-buffered saline (DPBS) . For Fc receptors blocking, cells were blocked with human TruStain (BioLegend) for 10 min at 4°C. Cells were stained with Live/Dead near IR stain (BD Biosciences) for 10 min, followed by a 15 min incubation in a cocktail of surface antibodies (online supplemental table S1) for the dendritic panel in the FACS buffer (3% of bovine serum albumin in DPBS). For intracellular staining, cells were fixed and permeabilized with BD cytofix/cytoperm solution for 20 min at 4°C. Cells were then incubated with a cocktail of intracellular antibodies prepared in FACS buffer for 20 min, followed by two times washing with the buffer. Fluorescence acquisition was carried out on a BD LSRFortessa and analyzed on FlowJo V.10.1 (Tree Star). PBMCs were isolated from blood and gated as shown in online supplemental figure S3.
Cell sorting and RNA-seq
Tumor cell suspensions were obtained similarly as described above in the protocol for flow cytometry. Cells were stained with fluorescently labeled CD45-specific antibody, and CD45-positive cells were isolated by FACS. An RNAeasy (Qiagen) kit was used to extract RNA. Samples were submitted to Vanderbilt Technologies for Advanced Genomics core for RNA QC, library preparation, and sequencing with a mean of ~30 M reads/sample. Samples were sequenced on the Illumina NovaSeq 6000 using 150 bp paired end reads. Reads were then aligned to the STAR aligner for read counts.
T-cell proliferation assay
Mouse splenocytes were plated on flat bottom 6-well plates (5×10⁶ per well) precoated overnight with 5 µg/mL of anti-CD3 antibodies (CD3e, Clone 145–2 C11, BioLegend) and incubated in the presence of 3 µg/mL of anti-CD28 antibodies (Clone 37.51, BioLegend) for 3 days. Anti-CD3 and anti-CD28 antibodies were omitted in the control unstimulated group. Cells were counted manually or using flow cytometry with CountBright cell counting beads (Thermo Fisher). Human cells were processed in the same way, except human-specific anti-CD3 (Clone UCHT1, BD Biosciences, precoating with 5 µg/mL overnight) and anti-CD28 (Clone CD28.2, BD Biosciences, 5 µg/mL) antibodies were used.
CFU
For CFU assay, BM cells were flushed from mouse tibias and femurs and plated in MethoCult Media in 35 mm dishes. CFU assays were performed in accordance with the manufacturer’s recommendations (STEMCELL).
DC differentiation, pulsing with tumor lysate, and adoptive transfer
We followed the BMDC differentiation protocol as described in Lutz et al.52 Briefly, BM cells were obtained as above, and 2×10⁶ cells were cultured in 100 mm non-tissue culture treated plates containing 10 mL of complete RPMI medium supplemented with 10% fetal bovine serum and antibiotic/antimycotic solution (Gibco). On the day (D)−1 of culture, complete RPMI medium consisted of 20 ng/mL of GM-CSF. On D3, the cultures were fed with additional 1 mL of complete medium supplemented with 10 ng/mL of GM-CSF and 10 ng/mL of IL-4. On D6 and D8, BM cultures were harvested, centrifuged, and cultured in fresh complete RPMI supplemented with 10 ng/mL of GM-CSF and 10 ng/mL of IL-4. On D9, cultures were again spun down and supplied with fresh complete RPMI and 10 ng/mL of GM-CSF, 10 ng/mL of IL-4, and 20 ng/mL of TNF-α. In addition, tumor lysates prepared by freeze-thaw of PYMT-C57BL/6 tumors (as described in Alaniz et al53 were added to the BMDC cultures (approximately lysate from three tumor cells for each BMDC). Following 16 hours of culture/pulsing with tumor lysates in the presence of a growth medium, cells were harvested, thoroughly washed with sterile 1×PBS three times, and resuspended in 1×PBS. Mice receiving BMDC were injected intravenously with 5×10⁶ BMDC in 100 µL of PBS. For in vitro studies GM-CSF-BMDCs were grown in GM-CSF and IL-4 as described above in presence or absence of 1 µM palbociclib for 8 days. For FLT3-BMDCs were cultured in complete RPMI medium with 200 ng/mL FLT3L and 2 ng/mL of GM-CSF in presence of absence of 1 µM palbociclib. On D3 and D5 the BMDC cultures were fed with 100 ng/mL FLT3L and 3 ng/mL of GM-CSF and harvested on D8.
Statistical analysis
Student’s t-test and analysis of variance were used to compare the means of two samples and multiple samples, respectively. Tukey method was applied to adjust the multiple comparisons. Wilcoxon matched-pairs signed-rank test was used to analyze paired human peripheral blood samples. The survival difference between the different treatments was assessed by log-rank test. Linear mixed model was used for repeated measurement analysis. GraphPad’s Prism V.7.03 software and R (V.3.3.0) were used for the statistical analysis. Two-sided p<0.05 was considered statistically significant.
Data availability statement
All data relevant to the study are included in the article or uploaded as supplementary information.
Ethics statements
Patient consent for publication
Ethics approval
This study involves human participants and was approved by University of Texas Southwestern Medical Center, STU2019-1269. Participants gave informed consent to participate in the study before taking part.
Acknowledgments
We thank PIIO IMDP core for assistance with spectral cytometry.
References
Supplementary materials
Supplementary Data
This web only file has been produced by the BMJ Publishing Group from an electronic file supplied by the author(s) and has not been edited for content.
Footnotes
Twitter @Amrendra_81, @smreddymd, @avilgelm
Correction notice This author has been corrected since it was first published. The corresponding author details have been updated.
Contributors Conceptualization: AV, SMR, AK. Methodology: AK, AV, SMR, VR, CS, DdLB. Investigation: AK, VR, AV, VB, NS, RU, DdLB. Statistical analysis: CS. Funding acquisition: AV, SMR, AR, CA. Supervision: AV, SMR. Writing—original draft: AK, AV, SMR. Writing—review and editing: AK, AV, SMR, CA, AR, CS, RU. Guarantor: AV, SMR.
Funding National Institutes of Health grant R37CA233770 (AV). National Institutes of Health grant CA116021 (AR). National Institutes of Health grant CA116021-S1 (AR). National Institutes of Health grant CA34590 (AR). National Institutes of Health grant P50CA098131 (AV, pilot award). National Institutes of Health grant P30CA68485 (Vanderbilt Ingram Cancer Center core facilities). National Institutes of Health grant P30CA142543 (UT Southwestern and Simmons Comprehensive Cancer Center core facilities). Department of Defense grant W81XWH2210019 (AV). Breast Cancer Research Foundation grant IIDRP-16-001 (AV, CA). Department of Veterans Affairs grant 5101BX000196-04 (AR). Department of Veterans Affairs Senior Research Career Scientist Award (AR). Cancer Prevention and Research Institute of Texas grant RR190020 (SMR). University of Texas Southwestern Medical Center, Disease Oriented Clinical Scholar Award (SMR).
Competing interests CA has served as scientific advisor to Novartis, Lilly, Merck, Daiichi Sankyo, AstraZeneca, Sanofi, OrigiMed, PUMA Biotechnology, Immunomedics, Athenex, Arvinas, and the Susan G. Komen Foundation; has received grant support from Pfizer, Lilly, and Takeda; and holds minor stock options in Provista. None of these activities have any relationship to the work presented in this manuscript.
Provenance and peer review Not commissioned; externally peer reviewed.
Supplemental material This content has been supplied by the author(s). It has not been vetted by BMJ Publishing Group Limited (BMJ) and may not have been peer-reviewed. Any opinions or recommendations discussed are solely those of the author(s) and are not endorsed by BMJ. BMJ disclaims all liability and responsibility arising from any reliance placed on the content. Where the content includes any translated material, BMJ does not warrant the accuracy and reliability of the translations (including but not limited to local regulations, clinical guidelines, terminology, drug names and drug dosages), and is not responsible for any error and/or omissions arising from translation and adaptation or otherwise.