Article Text

Abstract
Background Emerging data suggest that patients with enzalutamide-treated prostate cancer with increased programmed death-ligand 1 (PD-L1) expression may benefit from anti-PD-L1 treatment. Unfortunately, the Phase III IMbassador250 clinical trial revealed that the combination of atezolizumab (a PD-L1 inhibitor) and enzalutamide failed to extend overall survival in patients with castration-resistant prostate cancer (CRPC). However, the mechanisms underlying treatment failure remain unknown.
Methods Human CRPC C4-2B cells and murine Myc-CaP cells were chronically exposed to increasing concentrations of enzalutamide and the cells resistant to enzalutamide were referred to as C4-2B MDVR and Myc-CaP MDVR, respectively. The mechanisms of action in drug-resistant prostate cancer cells were determined using RNA sequencing analyses, RNA interference, real-time PCR, western blotting, and co-culturing technologies. Myc-CaP and Myc-CaP MDVR tumors were established in syngeneic FVB mice, and tumor-infiltrating leukocytes were isolated after enzalutamide treatment. The stained immune cells were determined by flow cytometry, and the data were analyzed using FlowJo.
Results Immune-related signaling pathways (interferon alpha/gamma response, inflammatory response, and cell chemotaxis) were suppressed in human enzalutamide-resistant prostate cancer cells. PD-L1 was overexpressed and negatively regulated by androgen receptor signaling in resistant cells and patient with CRPC cohorts. Enzalutamide treatment decreased CD8+ T-cell numbers but increased monocytic myeloid-derived suppressor cell (M-MDSC) populations and PD-L1 expression within murine Myc-CaP tumors. Similarly, chemotaxis and immune response-regulating signaling pathways were suppressed, and PD-L1 expression was also increased using enzalutamide-resistant Myc-CaP MDVR cells. Notably, MDSC populations were significantly increased in Myc-CaP MDVR orthotopic tumors compared with those in Myc-CaP parental tumors. Co-culturing bone marrow cells with Myc-CaP MDVR cells significantly promoted MDSC differentiation and shifted towards M2 macrophage skewing.
Conclusions Our study suggests that immunosuppressive signaling can be promoted directly by enzalutamide-resistant prostate cancer cells and may be a potential means by which the efficacy of immune checkpoint inhibitors in enzalutamide-resistant prostate cancer is diminished.
- Prostatic Neoplasms
- Programmed Cell Death 1 Receptor
- Tumor Microenvironment
- Immune Evation
- Drug Therapy, Combination
Data availability statement
Data are available upon reasonable request.
This is an open access article distributed in accordance with the Creative Commons Attribution Non Commercial (CC BY-NC 4.0) license, which permits others to distribute, remix, adapt, build upon this work non-commercially, and license their derivative works on different terms, provided the original work is properly cited, appropriate credit is given, any changes made indicated, and the use is non-commercial. See http://creativecommons.org/licenses/by-nc/4.0/.
Statistics from Altmetric.com
- Prostatic Neoplasms
- Programmed Cell Death 1 Receptor
- Tumor Microenvironment
- Immune Evation
- Drug Therapy, Combination
WHAT IS ALREADY KNOWN ON THIS TOPIC
Programmed death-ligand 1 (PD-L1) expression is increased in enzalutamide-treated prostate cancer. However, a Phase III IMbassador250 clinical trial revealed that the combination of atezolizumab (a PD-L1 inhibitor) and enzalutamide failed to extend overall survival in patients with castration-resistant prostate cancer (CRPC).
WHAT THIS STUDY ADDS
Immunosuppressive alterations in the tumor immune microenvironment can be promoted directly by enzalutamide-resistant CRPC cells which promote self-immune evasion by inducing immunosuppressive cell infiltration and by forming an immunosuppressive tumor microenvironment.
HOW THIS STUDY MIGHT AFFECT RESEARCH, PRACTICE OR POLICY
Our current study provides a theoretical foundation for a deeper understanding of the mechanisms driving the formation of the immunosuppressive microenvironment and immune checkpoint inhibitor escape in enzalutamide-resistant CRPC.
Introduction
Prostate cancer is the second leading cause of cancer-related death in men in the USA.1 2 Food and Drug Administration-approved next-generation androgen receptor signaling inhibitors (ARSI), such as enzalutamide, underscore the great opportunity to extend survival times and improve the quality of life in the patients with advanced prostate cancer.3 Despite these advances, resistance occurs frequently, and there is currently no definitive cure for castration-resistant prostate cancer (CRPC).4 Over the past few decades, new conceptual and technical advances in immunology have led to novel discoveries between the immune system and tumors. The immune checkpoint inhibitor pembrolizumab (a programmed cell death protein-1 (PD1) inhibitor) has been approved for the treatment of solid tumors with mismatch repair genes (MMR) and/or microsatellite instability, including prostate cancer.5–8 However, only approximately 5%–10% of metastatic CRPC cases have MMR mutations.9 10 Emerging data suggest that patients with enzalutamide-treated prostate cancer with increased programmed death-ligand 1 (PD-L1) expression may benefit from anti-PD1/PD-L1 therapy.11 12 Unfortunately, a recent phase III IMbassador250 study reported that the addition of atezolizumab (a PD-L1 inhibitor) to enzalutamide failed to extend the overall survival of patients with CRPC.13 However, the mechanisms underlying treatment failure remain unknown.
Prostate cancer has an immunosuppressive microenvironment and is defined as a ‘cold immune phenotype’. The presence of tumor-infiltrating leukocytes (TILs) is generally associated with better patient outcomes in many cancer types, but not in prostate cancer. CD4+ and CD8+ TILs are more leaning toward a regulatory phenotype (eg, expression of Foxp3), suggesting that prostate cancer may recruit and promote the accumulation of regulatory T cells (Treg) cells, thereby suppressing antitumor immunity and promoting tumor growth.14–16 Various immunosuppressive cell subtypes are also present in the tumor microenvironment (TME) in prostate cancer, including myeloid-derived suppressor cells (MDSC) and tumor-associated macrophages (TAM), which can inhibit the function of immune effector cells.17 MDSC have been identified as a key factor in establishing immunosuppressive and tumor-promoting TME in prostate cancer.18 The abundance of MDSCs in the blood of patients with prostate cancer correlates with disease burden and circulating prostate-specific antigen(PSA) levels.19 Furthermore, sustained disease control in metastatic CRPC mouse models has been achieved by therapeutically targeting MDSCs or neutralizing cytokines recruited by MDSCs.20 In addition, as a major component of the TME, TAM has low cytotoxicity and antigen-presenting capacity, promotes matrix remodeling and angiogenesis, favors the formation of immunosuppression, and plays an important role in the progression of many cancers.21 Studies have shown that the proportion of CD206+ macrophages (M2) is significantly higher in CRPC than in local prostate cancer tumors.22 Importantly, a meta-analysis showed that higher density of prostate TAM in localized disease was ultimately associated with poorer overall survival.23 Moreover, emerging evidence suggests that chemokines and cytokines are responsible for the pleiotropic effects of cancer, including growth, angiogenesis, endothelial-mesenchymal transition (EMT), lymphocyte infiltration, metastasis in advanced prostate cancer, and treatment resistance.24 For example, CXCL9, CXCL10, and CXCL11 bind to the CXCR3 receptor on T cells to enhance their migration and activation and promote their recruitment to the TME to exert antitumor effects. Upregulation of these chemokines in prostate cancer selectively enhances the attractiveness of type 1 effector immune cells and decreases the local attractiveness of MDSCs and Tregs.25 However, regulation of the immunosuppressive microenvironment in ARSI-resistant prostate cancer has not been fully investigated yet.
Here, we aimed to determine the effects of ARSI directly on the tumor cells and assess effects downstream on immune functions using enzalutamide-resistant prostate cancer cells and Myc-CaP animal models. We found that the interferon alpha/gamma response, T-cell activation, and cell chemotaxis pathways were suppressed in enzalutamide-resistant prostate cancer. PD-L1 is overexpressed and negatively regulated by androgen receptor (AR) in enzalutamide-resistant prostate cancer. Enzalutamide treatment decreased the population of CD8+ T cells and polymorphonucler (PMN) -MDSCs but increased the population of monocytic MDSCs (M-MDSCs) and PD-L1 expression. Moreover, the MDSC population was highly enriched in enzalutamide-resistant Myc-CaP MDVR tumors. Myc-CaP MDVR cells promote bone marrow cell differentiation into MDSC and polarize macrophages from the M1 to M2 phase. These data provide a theoretical foundation for a deeper understanding of the mechanisms driving the formation of the immunosuppressive microenvironment and immune checkpoint inhibitor escape in enzalutamide-resistant CRPC.
Methods
Reagents and cell culture
C4-2B (human CRPC cell line) cells were maintained in Roswell Park Memorial Institute (RPMI) 1640 supplemented with 10% fetal bovine serum (FBS), 100 units/mL penicillin and 0.1 mg/mL streptomycin. RAW264.7 (murine macrophage cell line) and Myc-CaP (murine prostate cancer cell line) cells were maintained in Dulbecco’s Modified Eagle’s Medium supplemented with 10% FBS, 100 units/mL penicillin and 0.1 mg/mL streptomycin. All cell-line experiments were performed within 6 months of receipt from the American Type Culture Collection or resuscitation after cryopreservation. C4-2B cells were kindly provided and authenticated by Dr Leland Chung Lab at the Cedars-Sinai Medical Center (Los Angeles, California, USA). The resistant cells were isolated and referred to as C4-2B MDVR (C4-2B enzalutamide resistant), C4-2B AbiR (C4-2B abiraterone resistant), and C4-2B APALR (C4-2B apalutamide resistant) as previously described.26 27 C4-2B MDVR, C4-2B AbiR, and C4-2B APALR were maintained in media containing 20 µM enzalutamide, 10 µM abiraterone acetate, and 40 µM apalutamide, respectively. Parental C4-2B cells were passaged alongside the resistant cells as an appropriate control. Myc-CaP cells were chronically exposed to increasing concentrations of enzalutamide (10–50 µM) by passaging in media containing enzalutamide for >12 months in complete FBS and stored for further analysis. Cells resistant to enzalutamide are referred to as Myc-CaP MDVR (Myc-CaP enzalutamide resistance). Parental Myc-CaP cells were passaged along with enzalutamide-treated cells as an appropriate control. Myc-CaP MDVR cells were maintained in a medium containing 50 µM enzalutamide. Myc-CaP-RFP and Myc-CaP MDVR-RFP cells were stably overexpressed pDsRed2-C1 (Clontech, 6974–1) and maintained in 400 µg/mL G418 medium. All cells were maintained at 37°C in a humidified incubator with 5% carbon dioxide. All cell lines were validated via short tandem repeat DNA profiling analysis (Promega’s PowerPlex 18D System), mycoplasma contamination detection via PCR. Enzalutamide, apalutamide, and abiraterone acetate were purchased from Selleck Chemicals.
Flow cytometry
For flow cytometry analysis, unstained controls, and total antibody compensation beads (A10497, Invitrogen, Waltham, Massachusetts, USA) were used to identify the gating boundaries. To determine PD-L1 expression, cells were collected, washed, and resuspended in flow cytometry staining (FACS) buffer containing CD274 antibodies for 30 min before detection by flow cytometry. To detect lymphocytic infiltration of mouse tumor tissues, same size tumors from each group were collected and ground into a single-cell suspension with a 70 µm strainer, and mononuclear cells were isolated using Ficoll-Paque PREMIUM (17544602, Cytiva, Marlborough, Massachusetts, USA) according to the manufacturer’s instructions. The mononuclear cell layers containing tumor-infiltrating cells above the Ficoll-Plaque will be collected and labeled with fluorescence-conjugated antibodies to determine the T cell (CD45, CD3, CD4, CD8, Foxp3, IFN-γ), MDSC (CD45, CD11b, Gr1), and macrophage (CD45, CD11b, Ly6G, Ly6C, F4/80) populations. Briefly, after washing twice with RPMI 1640 medium containing 10% FBS, all samples were subjected to detection of extracellular and intracellular markers with antibodies (online supplemental table S2) at room temperature. Extracellular staining was performed for 30 min, followed by fixation/permeabilization using Foxp3/Transcription Factor Staining buffer (00-5532-00, Invitrogen) for 30 min and 60 min of intracellular staining. Propidium iodide (11348639001, 1:600 dilution, Sigma-Aldrich) was added to all samples and stained for 10 min to differentiate between dead and live cells. All data were collected on a BD Canto A Flow Cytometer and analyzed using FlowJo software (Tree Star, V.10.0.7, USA).
Supplemental material
In vivo tumorigenesis assay
All experimental procedures involving animals were approved by the Institutional Animal Care and Use Committee of UC Davis complied with ethical regulations and humane endpoints (animal protocol number is #22246). Mice were housed in association for assessment and accreditation of laboratory animal care (AAALAC)-accredited animal facilities at UC Davis Sacramento campus under specific-pathogen-free conditions. For short-term enzalutamide treatment, Myc-CaP cells (1×10⁶) were mixed with Matrigel (1:1) and injected subcutaneously into the flanks of 12-week-old male FVB/NJ mice (Jackson Laboratory). After the tumor volume reached approximately 200 mm3, mice were randomly divided into two groups (n=8) and treated with enzalutamide (25 mg/kg orally (p.o.)/M-F) or vehicle control (0.5% Methocel A4M p.o.) for 2 weeks, as we described previously,28 tumor infiltrating cells were isolated and subjected to flow cytometry analysis. For longer-term enzalutamide treatment, Myc-CaP cells (0.5×10⁶) were mixed with Matrigel (1:1) and injected subcutaneously into the flanks of 12-week-old male FVB mice. Mice were randomly divided into two groups (n=5) and treated with enzalutamide (25 mg/kg p.o./M-F) or vehicle control (0.5% Methocel A4M p.o.), and the tumor volume was monitored. Tumors were measured twice a week using calipers and tumor volumes were calculated as length × width2/2. The animals were sacrificed if tumor size reached 20 mm. After 2 months of treatment, the tumor tissues were embedded in paraffin and stained with immunohistochemistry (IHC). To establish the orthotopic model, 1×10⁶ Myc-CaP parental and Myc-CaP MDVR cells were orthotopically injected into the dorsolateral prostate of FVB mice (n=4 each group) using a Hamilton syringe. Tumors were allowed to develop for over 1 month and harvested to collect tumor infiltrated leukocytes and subjected to flow cytometry and pathological analysis.
Immunohistochemistry and immunofluorescence
Tumors were fixed in formalin and paraffin-embedded tissue blocks were dewaxed, rehydrated, and blocked for endogenous peroxidase activity. Antigen retrieval was performed in sodium citrate buffer (0.01 mol/L, pH 6.0) in a microwave oven at 1000 W for 3 min and then at 100 W for 20 min. Non-specific antibody binding was blocked by incubation with 10% FBS in phosphate-buffered saline for 30 min at room temperature. The slides were then incubated with anti-PD-L1 (64988, 1:200 dilution, Cell Signaling Technology) or anti-CD8 (98941, 1:200 dilution, Cell Signaling Technology) at 4°C overnight. The slides were washed and incubated with biotin-conjugated secondary antibodies for 30 min, followed by incubation with avidin DH-biotinylated horseradish peroxidase complex for 30 min (Vectastain ABC Elite Kit, Vector Laboratories). The sections were developed using a diaminobenzidine substrate kit (Vector Laboratories) and counterstained with hematoxylin. The nuclear staining of the cells was scored and counted in five different fields of vision. Images were captured using an Olympus BX51 microscope equipped with a DP72 camera. The immunofluorescent staining of the paraffin embedded slides was performed using the androgen retrieved slides and incubated overnight with fluorescently conjugated Gr1 (25-5931-82, 1:100 dilution, Invitrogen) and F4/80 (11-4801-82, 1:100 dilution, Invitrogen) antibodies to identify tumor infiltrated MDSCs and macrophages. The slides were then washed, mounted with propidium iodide (PI) staining and observed by Zeiss LSM710 confocal laser scanning microscope.
Co-culturing experiments
Femur bones were excised from a healthy FVB mouse, and the bone marrow was flushed with RPMI medium and filtered through a 70 µM cell strainer. Cells collected from the bone marrow were counted and mixed with Myc-CaP or Myc-CaP MDVR cells in a 10:1 ratio and incubated for 3 days in the absence or presence of enzalutamide. The educated bone marrow cells were collected, and total RNA was extracted. The number of Myc-CaP and Myc-CaP MDVR cells was determined. Meanwhile, the spleen from the same animal was minced and passed through a 70 µM cell strainer to collect T lymphocytes. These cells were subsequently activated by treatment with anti-CD3 and anti-CD28 antibodies for 3 days. At the end of activation, the activated T cells were mixed with the bone marrow and/or tumor cell mixture setup with or without enzalutamide treatment, and after an additional 4 days of incubation, the cells were labeled with the respective antibodies and subjected to flow cytometric analysis.
For macrophage co-culture experiments, 0.5×10⁴ RAW264.7 cells were plated at the bottom of a 6-well plate. Myc-CaP parental or Myc-CaP MDVR cells were plated on the top of the insert (0.1×10⁴) at a 5:1 ratio the next day and incubated for an additional 6 days with addition of dimethylsulfoxide (DMSO) or enzalutamide. Tumor-educated RAW264.7 cells were collected, and total RNA was extracted. The M1 and M2 markers were determined using real-time PCR. For the growth inhibition assay, RAW264.7 were mixed with Myc-CaP-RFP or Myc-CaP MDVR-RFP cells, and fluorescence confluency was observed under a fluorescence microscope on different days.
Additional methods are presented in online supplemental methods.
Statistical analysis
Statistical analyses were performed using SPSS software. Raw data were summarized by means, SD, and graphical summaries and then transformed if necessary to achieve normality. Data from the in vitro experiments are presented as the mean±SD from three independent experiments. Differences between individual groups were analyzed using a two-tailed Student’s t-test for single comparisons or one-way analysis of variance, followed by the Scheffé procedure for multiple group comparisons. In the tumor growth experiments, the size of the tumor at sacrifice served as the primary response measure. Tumor growth between the two groups was analyzed using two-tailed Student’s t-test. No sample or data point from the analysis was excluded. The experiments and data process were not blinded. Sample size was chosen based on the power to detect significant differences (p<0.05). Concordance between gene levels in clinical patient samples was determined using Spearman’s rank correlation. A p value less than 0.05 was considered statistically significant.
Results
Immunosuppressive signaling is altered in enzalutamide-resistant prostate cancer
Understanding the mechanisms by which drug resistance develops in prostate cancer cells is critical for developing early intervention strategies for treating CRPC. Towards this end, we successfully generated multiple ARSI-resistant prostate cancer cell lines, including abiraterone-resistant C4-2B AbiR, enzalutamide-resistant C4-2B MDVR, and apalutamide-resistant C4-2B APALR cells.26 27 To understand the potential mechanisms underlying resistance, we performed RNA sequence analysis of the C4-2B MDVR and parental cells, as shown in figure 1A, where a significant enrichment of immune-related signaling was suppressed in C4-2B MDVR cells by gene sets enrichment analysis (GSEA). The interferon alpha/gamma response, inflammatory response, and cell chemotaxis pathways were significantly suppressed in C4-2B MDVR cells. Similar results were found in VCaP MDVR cells. As shown in online supplemental figure S1, regulation of T-cell migration, interferon signaling, and interferon responses were suppressed in resistant cells compared with the parental cells. Further gene expression data revealed that the immune checkpoint CD274 (PD-L1) was significantly upregulated in C4-2B ARSI-resistant cells (figure 1B). Similar results were found in VCaP MDVR cells (online supplemental figure S1B). We used exogenous interferon-γ (IFN-γ) to stimulate the C4-2B MDVR and parental cells. As shown in figure 1C, the expression of several key genes (CXCL9, CXCL10, CXCL11, CCL20, IL15, IRF1, IFI44, and CD274) significantly increased in response to IFN-γ treatment in C4-2B parental cells. However, the expression of these genes showed lesser response to IFN-γ treatment in C4-2B MDVR cells. We also confirmed PD-L1 and CXCL10 protein expression by western blotting. As shown in figure 1D, IFN-γ significantly increased PD-L1 and CXCL10 expression in C4-2B parental cells, but not in C4-2B MDVR cells. Collectively, these data suggest that immune-related signaling pathways are suppressed in enzalutamide-resistant prostate cancer cells.
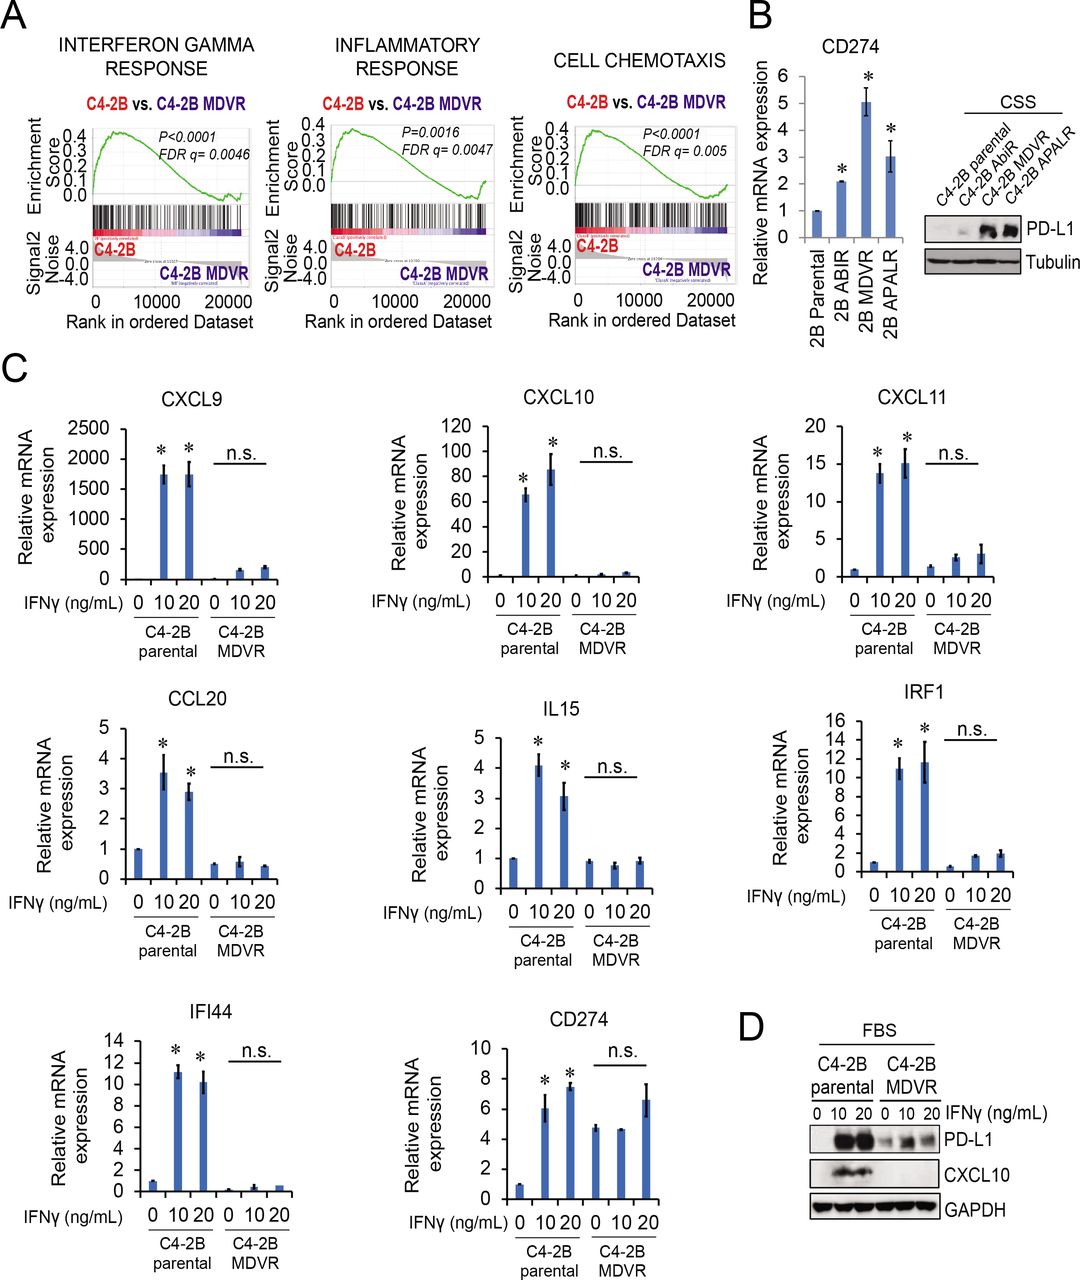
Immunosuppressive signaling is activated in ARSI-resistant prostate cancer. (A) RNA sequencing data from C4-2B parental and C4-2B MDVR cells was analyzed using GSEA. The IFN-γ response, inflammatory response, and cell chemotaxis pathways showed suppression of a significant enrichment of immune-related signaling in C4-2B MDVR compared with the parental cells. (B) C4-2B ARSI-resistant cells, AbiR, MDVR, and ApalR, were examined for the PD-L1 mRNA and protein expression by RT-qPCR and western blotting, respectively. (C) C4-2B parental and MDVR cells were stimulated with IFN-γ (0, 10, 20 ng/mL) and total RNA extracted for RT-qPCR to assess the mRNA expression of several key genes (CXCL9, CXCL10, CXCL11, CCL20, IL15, CD274, IRF1 and IFI44) from the IFN-γ response and T-cell activation pathway. (D) Whole cell lysates from C4-2B parental and MDVR cells treated with IFNγ (0, 10, 20 ng/mL) for 3 days were collected and subjected to western blotting analysis for PD-L1 and CXCL10 protein expression. *p<0.05. ARSI, androgen receptor signaling inhibitor; CSS, charcoal-stripped FBS; FBS, fetal bovine serum; FDR, false discovery rate; GSEA, gene sets enrichment analysis; IFN, interferon; IL, interleukin; mRNA, messenger RNA; PD-L1, programmed death-ligand 1; RT-qPCR, quantitative real-time PCR.
AR signaling negatively regulates expression of PD-L1 in enzalutamide-resistant prostate cancer
We previously found that classical AR signaling was suppressed in C4-2B MDVR cells.29 Intriguingly, PD-L1 protein expression was highly upregulated in charcoal-stripped FBS condition compared with FBS condition (figure 2A). Dihydrotestosterone (DHT) treatment significantly suppressed the RNA and protein expression of PD-L1 in a dose and time-dependent manner in C4-2B MDVR cells (figure 2B–2C), suggesting that AR signaling might negatively regulate PD-L1 expression. Further DHT and enzalutamide combination experiments showed that enzalutamide rescued both PD-L1 messenger RNA (mRNA) and protein expression inhibited by DHT in C4-2B MDVR cells (figure 2D–E). The inhibition of PD-L1 promoter-mediated luciferase activity was also reversed by the addition of enzalutamide (figure 2F). Flow cytometric analysis also demonstrated changes in cell surface PD-L1 expression under the influence of enzalutamide, DHT, or their combination. DHT significantly reduced the population of PD-L1 expressing cells, the addition of enzalutamide again demonstrated significant increases in surface expression (figure 2G–2H). To determine if the AR protein affects PD-L1 expression, full-length AR (AR-FL) or AR-V7 was knocked down with the respective small interfering RNA s (siRNAs) in C4-2B MDVR cells. As shown in figure 2I, the knockdown of AR-FL, but not AR-V7, significantly increased PD-L1 expression. The expression levels of AR downstream genes, such as KLK3, were assessed to validate the knockdown. AR-FL knockdown did not affect PD-L1 expression under CS-FBS conditions. DHT significantly suppressed PD-L1 expression. However, DHT did not decrease the expression of PD-L1 when AR-FL was knocked down.(figure 2J). This was also confirmed by interrogating patient with CRPC databases. As shown in figure 2K, AR and its downstream markers (KLK3, NKX3-1, and FKBP5) were negatively correlated with CD274 in Stand Up to Cancer/Prostate Cancer Foundation (SU2C/PCF) patient cohort.30 In three additional patient cohorts, the AR mRNA levels were negatively correlated with the CD274 levels (online supplemental figure S2). Collectively, these data suggest that AR signaling negatively regulates PD-L1 expression in the resistant tumor cell directly.

AR negatively regulates expression of PD-L1 in enzalutamide-resistant prostate cancer. (A) C4-2B parental and MDVR cells were collected after grown in FBS and CSS growth media for 3 days and subjected to immunoblotting analysis using antibodies against PD-L1. (B) Total RNA extracted from C4-2B parental and MDVR cells treated with different doses (0, 0.1, 1, 10, or 100 nM) of DHT for 3 days and the level of PD-L1 expression was assessed by RT-qPCR. (C) Total cell lysates from C4-2B parental and MDVR cells after 3-day treatment with various concentrations (0, 0.1, 1, 10, or 100 nM) of DHT or 10 nM of DHT for different length of time (0, 8, 24, 72, or 120 hours) were immunoblotted with anti-PD-L1 antibodies. (D) C4-2B MDVR cells after DHT (0, 1, or 10 nM) treatment alone or with addition of enzalutamide (20 µM) for 3 days were examined for the PD-L1 RNA expression by RT-qPCR. (E) C4-2B MDVR cells were treated with DHT (0, 1, or 10 nM) in the absence or presence of enzalutamide (20 µM) for 3 days. The whole cell lysates were collected for western blot analysis probed for the PD-L1 protein expression. (F) C4-2B MDVR cells were transiently transfected with PD-L1-Luc (0.5 µg) followed by DHT alone or in combination with enzalutamide. Cell lysates were harvested 3 days after transfection and assayed for the luciferase activity. (G–H) C4-2B MDVR cells maintained in CS medium were treated with enzalutamide (20 µM) DHT (10 nM) or in combination for 3 days and the expression of surface PD- L1 was assessed by flow cytometric analysis. Percentage of PD-L1 positive cells were numerated in a figure format. Cells void of PD-L1 antibody were used as the unstained control. (I) Total RNA were extracted from C4-2B MDVR cells transfected with siControl, siAR-V7 or siAR-FL and the expression levels of CD274, AR-FL, AR-V7, and KLK3 were determined by RT-qPCR. A duplicate set of cells transfected with siControl, siAR-V7 or siAR-FL were harvested at the end of treatments and subjected to western blot analysis for PD-L1, AR-FL and AR-V7 protein levels. (J) Total lysates from C4-2B MDVR cells transfected with or without siAR-FL and treated with or without 10 nM DHT were examined for PD-L1 and AR protein expression by western blots. (K) Expression of AR, KLK3, NKX3-1, and FKBP5 were correlated with that of CD274 in SU2C/PCF patient cohort. *p<0.05. AR, androgen receptor; AR-FL, full-length AR; CSS, charcoal-stripped FBS; DHT, dihydrotestosterone; FBS, fetal bovine serum; mRNA, messenger RNA; PD-L1, programmed death-ligand 1; SU2C/PCF, Stand Up to Cancer/Prostate Cancer Foundation; RT-qPCR, quantitative real-time PCR.
Enzalutamide treatment regulates the population of CD8+ T cells and MDSC in Myc-CaP tumors
To further investigate the effects of enzalutamide treatment on the populations of tumor-infiltrating cells in the tumor microenvironment, we established a murine Myc-CaP tumor and treated mice with vehicle control or enzalutamide for 2 weeks to determine the initial immune response by the treatment. Tumor-infiltrating cell (online supplemental figure S3A) analysis by flow cytometry revealed that 2 weeks of enzalutamide treatment did not affect the total population of CD45+ and CD3+ T cells (online supplemental figure S3A–C). However, the CD8+ cells were significantly decreased by enzalutamide treatment compared with untreated tumor-bearing mice (figure 3A). Interestingly, the myeloid cell CD11b+ population was not significantly altered by enzalutamide treatment (online supplemental figure S3D). However, while the PMN-MDSC (CD11b+Ly6G+Ly6Clow) population appeared decreased in the treated mice, the M-MDSC (CD11b+Ly6G−Ly6Chigh) population was significantly increased by enzalutamide treatment (figure 3B) and also observed that enzalutamide treatment slightly increased the total macrophage (CD11b+Ly6G−Ly6ChighF4/80+) population within the tumors (online supplemental figure S3E). To further evaluate the effects of enzalutamide in vivo, we then treated Myc-CaP tumor-bearing mice with enzalutamide for 2 months. As shown in figure 3C, enzalutamide treatment initially slowed Myc-CaP tumor growth mirroring the clinical scenario. However, even with prolonged treatment, the majority of the treated mice had tumors eventually recur after 2 months although survival was improved in the enzalutamide group compared with that in the vehicle-treated group (figure 3D). IHC staining again confirmed that CD8+ T cells were significantly reduced by 2 months of enzalutamide treatment (figure 3E). In agreement with the in vitro data, PD-L1 expression on the tumors was again increased by the treatment (figure 3F). Notably, both MDSC (Gr1+) and macrophage (F4/80+) were significantly infiltrated into the enzalutamide-treated tumors. The large amount of double positive cells also indicated that most of the infiltrated MDSC cells were Ly6Chigh cells after enzalutamide treatment (figure 3G). Collectively, these data demonstrate that while androgen receptor blockade with enzalutamide treatment does indeed suppress Myc-CaP tumor growth, it also results in decreased CD8+ T cells but increased PD-L1 expression, MDSC, and macrophages in the TME.

Enzalutamide treatment affects tumor infiltrating cells in Myc-CaP tumors. (A–B) Tumor infiltrating cells from Myc-CaP tumors grown in FVB mice treated with vehicle only or enzalutamide (25 mg/kg, orally, 5 days/week) were isolated and incubated with fluorophores-conjugated antibodies to determine the CD4+ T cell (CD45+CD3+CD4+CD8−), CD8+ T cell (CD45+CD3+CD4−CD8+), PMN-MDSC (CD45+CD11b+Ly6G+Ly6Clow), and M-MDSC (CD45+CD11b+Ly6G−Ly6Chigh) using flow cytometry. The output histograms were analyzed by FlowJo software and the percentage of population between sublines were plotted. The gating strategy was shown in online supplemental figure 3. (C) FVB mice were injected with 0.5×10⁶ Myc-CaP cells subcutaneously and then treated with vehicle only or enzalutamide (25 mg/kg, orally, 5 days/week). Tumor progression was monitored by the measurement with a caliper biweekly to calculate tumor volumes. The tumor carried mouse was sacrificed when tumor volume reached around 4000 mm3. (D) Kaplan-Meier curves showing survival benefits of enzalutamide treatment in Myc-CaP tumors (tumor size >500 mm3 set up as end event). (E–F) IHC staining of representative tumor sections from the control or enzalutamide treatment groups (2 months treatment) with specific CD8 or PD-L1 antibodies. Numbers of CD8 or PD-L1 positive cells between the control and enzalutamide groups were counted in multiple fields and plotted. (G) Immunofluorescent staining of representative tumor sections from the control or enzalutamide treatment groups (2 months treatment) with specific Gr1 (red) and F4/80 (green) antibodies. All nuclei were stained with DAPI and the merged micrograms showed the compiled staining of Gr1, F4/80, and DAPI. Gr1 or F4/80 positive cells in multiple fields were numerated and compared between the control and enzalutamide groups. *p<0.05. IHC, immunohistochemistry; M-MDSC, monocytic myeloid-derived suppressor cell; PMN, Polymorphonuclear neutrophils; PMN-MDSC, polymorphonuclermyeloid-derived suppressor cell, PD-L1, programmed death-ligand 1.
Enzalutamide resistance causes the suppression of immune signaling pathways in Myc-CaP MDVR cells
To further understand the effects of enzalutamide on tumor immunosuppressive signaling activation, we generated a murine enzalutamide-resistant prostate cancer cell line by continuously culturing Myc-CaP cells in media containing enzalutamide. As shown in figure 4A–4C, after over 12 months of chronical exposure to enzalutamide, Myc-CaP MDVR (Myc-CaP enzalutamide-resistant line) cells exhibited more resistance to enzalutamide and apalutamide treatment than Myc-CaP parental cells. RNA sequencing analysis revealed that multiple immune-related pathways were significantly enriched in Myc-CaP MDVR cells (figure 4D). Specifically, the T cell/immune response and chemokine/cytokine categories, such as mononuclear cell migration, cell chemotaxis, and immune response related signaling pathways were significantly suppressed in Myc-CaP MDVR cells (figure 4E–4F). Multiple chemokines related to these pathways were suppressed in Myc-CaP MDVR cells, including CXCL5, CXCL15, CXCL9, CXCL10, and CXCL11 (figure 4G). However, PD-L1 and AR expression were upregulated in Myc-CaP MDVR cells (figure 4H). Flow cytometry data confirmed that the population of PD-L1 positive cells in Myc-CaP MDVR cells was higher than that in the parental cells (figure 4I). Similar to what we observed in human C4-2B MDVR cells, PD-L1 expression in Myc-CaP MDVR cells was negatively regulated by AR signaling. As shown in online supplemental figure S4A, DHT treatment decreased the mRNA expression of PD-L1, enzalutamide treatment blunted the effects of DHT on PD-L1 inhibition. The results were confirmed by determining surface PD-L1 protein levels. As shown in online supplemental figure S4B, DHT significantly reduced the population of PD-L1 expressing cells, and the addition of enzalutamide reversed the surface expression levels reduced by DHT. Collectively, the enzalutamide-resistant Myc-CaP MDVR cells were successfully established, similar to human C4-2B MDVR cells, in which immune-related signaling pathways such as T-cell regulation, and cell chemotaxis are suppressed in Myc-CaP MDVR cells.
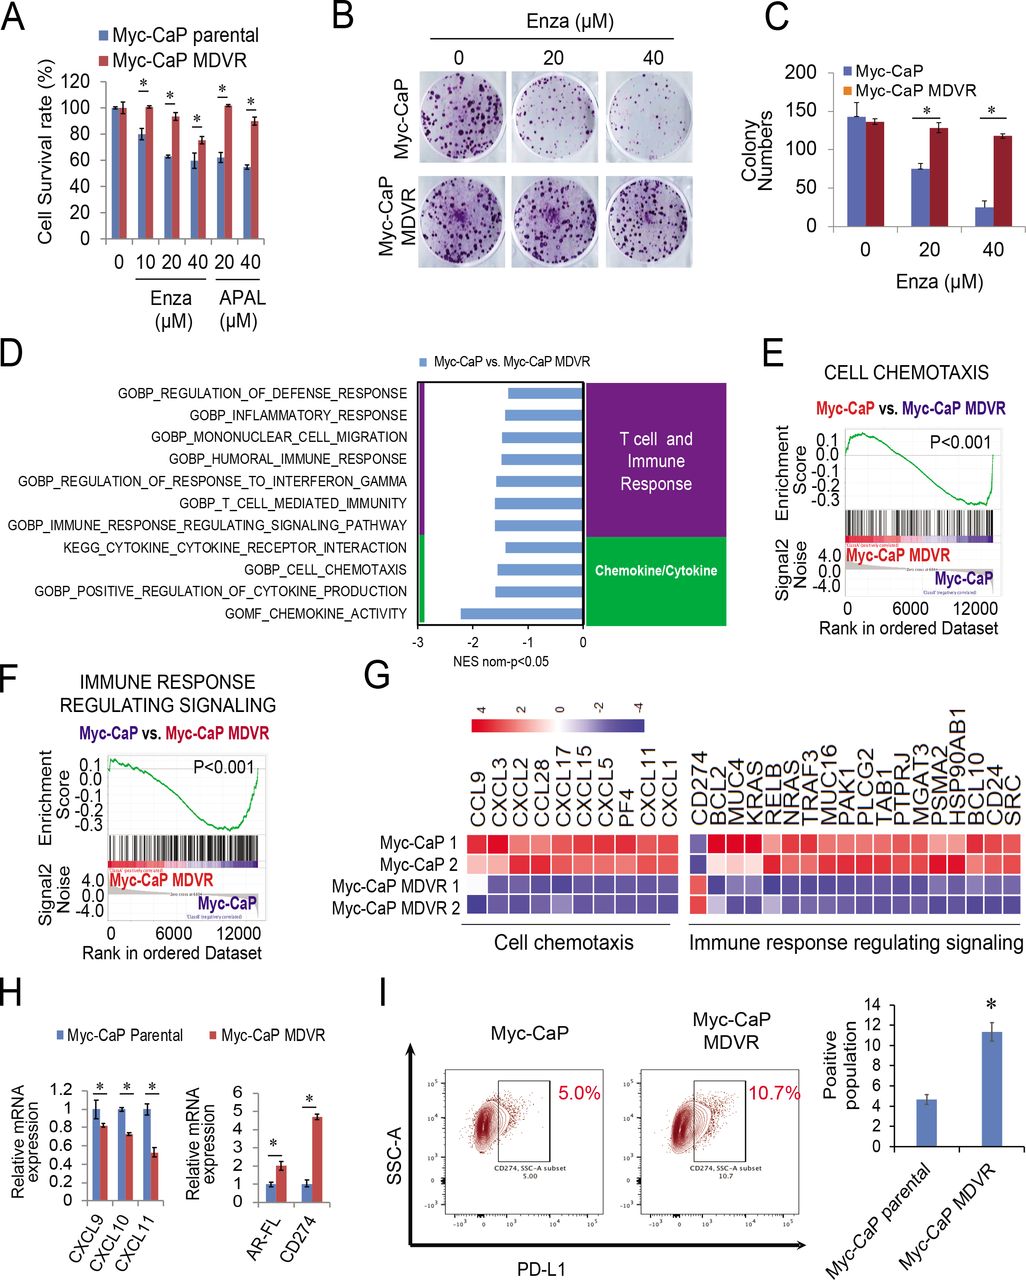
Enzalutamide resistance causes the suppression of immune signaling pathways in Myc-CaP MDVR cells. (A) Myc-CaP parental and MDVR cells were treated with enzalutamide (0, 10, 20, 40 µM) and apalutamide (20, 40 µM) for 3 days and the cell viability was examined for the cell survival rate. (B–C) Myc-CaP parental and MDVR cells were treated with enzalutamide (20 and 40 µM) for clonogenic assays, and colony numbers were compared. (D) RNA extracted from Myc-CaP parental and MDVR cells were subjected to sequencing analysis followed by the GSEA to identify pathways enriched or downregulated between the two sublines. (E–F) Two representative enrichment plots of immune-related pathways by GSEA. (G) The heatmaps of cell chemotaxis and immune response regulating signaling were plotted using R. (H) Total RNA was isolated from Myc-CaP parental and MDVR cells and the gene expression of CXCL9, CXCL10 and CXCL11, AR, and PD-L1 were compared using RT-qPCR. (I) The population of Myc-CaP and Myc-CaP MDVR cells expressing PD-L1 on the surface was analyzed by flow cytometry. *p<0.05. GSEA, gene sets enrichment analysis; mRNA, messenger RNA; PD-L1, programmed death-ligand 1; RT-qPCR, quantitative real-time PCR.
MDSC populations are elevated in Myc-CaP MDVR tumors
To determine whether Myc-CaP MDVR cells were resistant to enzalutamide treatment in vivo, subcutaneous tumor-bearing mice were treated with enzalutamide. As shown in figure 5A–5B, enzalutamide had no effect on suppressing Myc-CaP MDVR tumor growth and reducing tumor weight. Enzalutamide treatment increased CD45+ leukocytes but did not change CD3+ T-cell infiltration in tumors (figure 5C–5D). Notably, MDSC populations were significantly increased by enzalutamide treatment (figure 5E). To further characterize the tumor-infiltrating cell population in enzalutamide-resistant prostate tumors, we established Myc-CaP parental and Myc-CaP MDVR orthotopic tumors (online supplemental figure S5A–B) and characterized their tumor-infiltrating cell populations. Previous report has suggested that immune infiltration into subcutaneous prostate tumors may differ significantly from that into the prostate.31 The orthotopic implantation model offers the advantage of a more reflective tumor microenvironment. Our data suggest that Myc-CaP and Myc-CaP MDVR tumors infiltrated a similar number of leukocytes (online supplemental figure S5C). CD3+ total T cells and CD4+, and CD8+ T-cell populations were not changed in Myc-CaP MDVR tumors compared with Myc-CaP parental tumors (online supplemental figure S5D–E). However, IFN-γ levels were significantly decreased in CD8+ T cells in Myc-CaP MDVR tumors (figure 5F) while Treg cells were increased (figure 5G). Notably, the MDSC population significantly increased in Myc-CaP MDVR tumors (figure 5H). IHC staining of representative tumors from each group further showed that PD-L1 expression was significantly elevated in the Myc-CaP MDVR tumors (figure 5I). Collectively, these data suggest that enzalutamide-resistant Myc-Cap MDVR tumors gain immunosuppressive features through upregulation of PD-L1 and increasing MDSC populations within the tumor.

MDSC populations are elevated in Myc-CaP MDVR tumors. (A) FVB mice were subcutaneously injected with 1×10⁶ of Myc-CaP MDVR cells and treated with vehicle only or enzalutamide (25 mg/kg, orally, 5 days per week). Tumor progression was monitored by biweekly measurement and represented by tumor volumes versus days post injections. (B) Tumor weights at the end of the experiment. (C–E) Tumor infiltrating cells were isolated and incubated with fluorophores-conjugated antibodies to determine the total leukocytes (CD45+), total T cells (CD45+CD3+), and MDSC (CD45+CD3-GD11b+Gr1+) population using flow cytometry. The output histograms were analyzed by FlowJo software and the percentage of population between sublines were plotted. (F–H) Tumor infiltrating cells from Myc-CaP and Myc-CaP MDVR orthotopic tumors were isolated respectively and incubated with fluorophores-conjugated antibodies to determine the IFN-γ from CD8+ T cells, Treg cells, and MDSC (CD45+CD3-GD11b+Gr1+) population using flow cytometry. The output histograms were analyzed by FlowJo software and the percentage of population between sublines were plotted. (I) IHC staining of PD-L1 in three representative Myc-CaP parental and MDVR tumors. PD-L1 positive cells were counted and compared. *p<0.05. IFN, interferon; IHC, immunohistochemistry; PD-L1, programmed death-ligand 1; Treg, regulatory T cell.
MDSC differentiation and macrophage polarization are regulated by Myc-CaP MDVR cells
To determine whether enzalutamide-resistant Myc-CaP MDVR cells can educate bone marrow cells (BMs) into differentiation, we performed admixture experiments by co-culturing the BMs with Myc-CaP parental or Myc-CaP MDVR cells. Further CD3/CD28 activated T cells were co-cultured with the treated BMs (tBMs), and Treg cells and IFN-γ were determined (figure 6A). From the tumor cell perspective, we found that co-culturing with BMs imposed a drastic growth inhibition effect on Myc-CaP parental cells, but not on Myc-CaP MDVR cells. Enzalutamide treatment slightly increased the growth inhibition effects of BMs on Myc-CaP cells but not on Myc-CaP MDVR cells (figure 6B). The cell proliferation assay further confirmed the suppression effects of tumor-educated BMs on Myc-CaP cells (figure 6C). Flow cytometric analysis showed that both Myc-CaP parental and Myc-CaP MDVR cells significantly increased the MDSC population in tumor-educated BMs. However, Myc-CaP MDVR cells showed an approximately two-fold increase in MDSC compared with Myc-CaP cells. Enzalutamide treatment significantly increased MDSC populations in Myc-CaP co-culturing group but only minimally increased in Myc-CaP MDVR co-culturing group (figure 6D). Furthermore, we characterized the macrophage population in tumor-educated BMs (online supplemental figure S6A) and found that the population of F4/80+ macrophages was significantly increased by both Myc-CaP and Myc-CaP MDVR cells compared with BMs alone. There was no difference in percentage between the Myc-CaP and Myc-CaP MDVR groups or by enzalutamide treatment (figure 6E). To determine whether macrophages affect prostate cancer cell proliferation, RAW264.7 cells were mixed with Myc-CaP-RFP or Myc-CaP MDVR-RFP cells. Similar to the BMs co-culturing data, fluorescence confluency was significantly reduced in the Myc-CaP co-culturing group compared with the Myc-CaP MDVR group (online supplemental figure S6B). We then determined the expression of M1 and M2 macrophage markers in Myc-CaP and Myc-CaP MDVR educated RAW264.7 cells. As shown in figure 6F, M2 polarization markers (CD206, TGM2) were significantly increased whereas M1 markers (MHC Class II, CD80) were decreased in RAW264.7 cells after the Myc-CaP MDVR cell exposure. The results suggested that Myc-CaP MDVR cell alters M1/M2 polarization skewing towards M2 phenotypes compared with Myc-CaP parental cell. Consistent with the in vivo findings, co-culturing of tBMs cells and T cells with Myc-CaP cells also significantly increased the number of Treg cells, and co-culturing with Myc-CaP MDVR cells further increased the population. Enzalutamide treatment slightly increased Treg cells in Myc-CaP co-culturing group but not in Myc-CaP MDVR co-culturing group (figure 6G). Notably, co-culturing with Myc-CaP cells also significantly increased IFN-γ levels in CD8+ T cells. Enzalutamide treatment further increased the IFN-γ levels. In marked contrast, IFN-γ levels in CD8+ T cells were significantly decreased when co-cultured with Myc-CaP MDVR cells and not affected by enzalutamide treatment (figure 6H). Collectively, these data suggest that enzalutamide-resistant Myc-CaP MDVR cells can promote BMs differentiation into MDSC, polarize macrophages from the M1 to M2 phase, and increase Treg cells. Enzalutamide treatment promotes MDSC differentiation and increases IFN-γ levels in CD8+ T cells when co-culturing with enzalutamide sensitive cells.

MDSC and macrophage differentiation are regulated by Myc-CaP MDVR cells. (A) Scheme shows the preparation of tumor (Myc-CaP and Myc-CaP MDVR), BMs (from bone marrow flush) and T (from spleen) cells to constitute the co-culture admixture. (B–C) Myc-CaP parental and MDVR cells were alone or co-cultured with BMs in the absence or presence of enzalutamide and incubated for 4 days for clonogenic staining and cell survival (by cell counting). (D) The control and enzalutamide-treated BMs and tumor co-cultured admixtures were analyzed by flow cytometry for MDSC (CD45+CD11b+Gr1+) populations. The percentage of the MDSC population was compared. (E) BMs alone or co-cultured with Myc-CaP parental or Myc-CaP MDVR cells treated with or without enzalutamide were gated for macrophage differentiation. The percentage of the macrophage population was compared. (F) Total RNA extracted from RAW264.7 co-cultured with Myc-CaP parental or MDVR cells in the absence or presence of enzalutamide for 5 days were assessed for the expression of M1 markers (CD80, CD86, H2-EB1, and CXCL11) and M2 markers (CD68, CD206, ARG1, and TGM2) by RT-qPCR. (G) Admixtures of BMs and T cells co-cultured with Myc-CaP parental or Myc-CaP MDVR cells with or without enzalutamide treatment were profiled for Treg (CD45+CD3+CD4+CD8-Foxp3+) cell populations by flow cytometry. Percentages of Treg cell populations in admixtures were plotted for comparison. (H) The CD8+ T cells were further gated for IFN-γ expression. Percentages of IFN-γ+ in CD8+ cells populations in respective admixtures were plotted for comparison. *p<0.05. BMs, bone marrow cells; IFN, interferon; RT-qPCR, quantitative real-time PCR; Treg, regulatory T cell.
Discussion
Various pro-inflammatory cytokines such as IFN-γ, tumor necrosis factor-alpha (TNF-α), interleukins (ILs), and chemokines (CXCL10) contribute to the initiation, progression, and establishment of metastatic prostate cancer.24 Among them, antitumor immune responses largely depend on activation of the IFN-γ signaling pathway in tumor cells.32 In contrast, loss of IFN-γ signaling activity is associated with resistance to anti-PD-1 and anti-CTLA-4 therapies.33 Emerging studies have shown that AR inhibits IFN-γ transcription in T cells.34 AR blockade restores the ability of CD8+ T cells to produce IFN-γ. Enzalutamide combined with androgen deprivation therapy further enhanced T-cell response to PD-1 antibodies and prolonged survival in a mouse model of prostate cancer, suggesting that complete blocking of androgen signaling in the TME is essential for maximizing therapeutic benefits.34 Moreover, a preliminary ad-hoc analysis of the failed Phase III IMbassador250 trial revealed that IFN signaling activation in patients with CRPC favored the addition of PD-L1 inhibitor. Notably, the patients with CPRC recruited in this clinical trial were abiraterone resistance, who were likely enzalutamide resistant due to the cross-resistance.13 In our attempts to characterize the immune features of the enzalutamide-resistant C4-2B MDVR cell line, we identified that immune-related signaling pathways, especially IFN-γ response signaling, were suppressed in enzalutamide-resistant prostate cancer cells. We further determined the expression of multiple key IFN-γ-induced genes and confirmed that the response to IFN-γ was significantly reduced in C4-2B MDVR cells. Meanwhile, the expression of the immune checkpoint molecule PD-L1 is upregulated in these cells. These results suggest that enzalutamide-resistant prostate cancer cells are immunosuppressed as they transition to the resistant stage; although PD-L1 expression is upregulated, the immune response to anti-PD1/PD-L1 treatment may decrease.
PD-L1 is normally expressed on the surface of tumor cells and interacts with the PD-1 receptor expressed on the surface of immune cells. This interaction can inhibit the function/activation of TILs and natural killer cells, induce TILs apoptosis, and affect T helper cells and myeloid differentiation.35 On the other hand, it promotes the secretion of immunosuppressive cytokines and reduces the production of effector cytokines, thereby promoting immunosuppression and evading the lymphocyte targeting of tumor cells. Blockade of the PD-1/PD-L1 signaling pathway with immunotherapeutic drugs can prevent tumor immune escape and increase the antitumor activity of immune cells by enhancing T-cell activation and cytotoxic T cell-killing activity. It can also reduce the exhaustion of TILs by increasing the proliferation of effector CD8+ T cells and inhibiting Tregs and MDSCs, thereby yielding more powerful tumor control.36 In prostate cancer, PD-L1 expression is regulated by the intracellular ERK/MEK, Akt-mTOR, NF-kB, WNT, and JAK/STAT pathways, as well as extracellular cytokines such as IFN-γ, IL-6, and TNF-α.37 Additionally, epigenetic factors play a role in the regulation of PD-L1 expression. Studies have shown that acetylase p300/CBP can promote the recruitment of IRF-1 to the PD-L1 promoter and induce histone H3 acetylation, thereby promoting PD-L1 transcription and expression.38 A preclinical study found that PD-L1 expression is elevated in enzalutamide-resistant CRPC cells, suggesting that these tumors use PD-L1 expression as a major driver of immune evasion, which may represent a unique enzalutamide resistance mechanism.39 Moreover, a comprehensive evaluation of prostate cancer showed that PD-L1 expression is rare in primary prostate cancer but is increased in metastatic CRPC.40 Consistently, our study confirmed that the expression of PD-L1 was significantly higher in enzalutamide-resistant prostate cancer cells than in parental cells. Importantly, we found that inhibition of AR by siRNA or enzalutamide could upregulate the expression of PD-L1 in vitro and in vivo, revealing that AR signaling negatively regulates PD-L1 expression. These data provide the rationale for combining PD-L1 inhibitors and enzalutamide treatment in patients with CRPC. Unfortunately, the phase III IMbassador250 study revealed that the addition of atezolizumab to enzalutamide failed to extend overall survival in patients with CRPC. The ad hoc analysis found that patients with prostate cancer harbored low expression of key immune markers, such as T-effector cells and macrophages. Importantly, GSEA revealed that activation of immune-related pathways was associated with better outcomes in the atezolizumab + enzalutamide group.13 Consistent with our findings, although PD-L1 was upregulated in enzalutamide-resistant prostate cancer cells, immune-related pathways were suppressed. Importantly, enzalutamide treatment significantly exhausted CD8+ T cells in the tumors. IFN-γ levels of CD8+ T cells were also decreased in enzalutamide-resistant Myc-CaP MDVR tumors. Therefore, we suspected that AR may promote the formation of an immunosuppressive microenvironment in ARSI-resistant CRPC. Combining this study with previous studies on the cancer-promoting role of AR in prostate cancer contributes to our broader understanding of the role of AR in drug resistance and promotion of tumor immune escape.
Androgen blockage suppresses AR signaling in prostate cancer and leads to the initiation of tumor-specific adaptive immune responses.41 For example, it induces regeneration of the thymus and increases the release of naive T-cells. It also increases and suppresses the infiltration of immune effector cells and Treg cells, respectively, into prostate tumors.42 43 It can also induce the production of several inflammatory cytokines.44 Additionally, androgen deprivation has been shown to improve the efficacy of immunotherapy, including antigen-specific vaccines, immune checkpoint inhibitors, and adoptive T-cell transfer in prostate cancer.45 However, this immune augmentation was short-term, as the castration-resistant disease recurred and was eventually dominated by immunosuppressive cell populations in many patients. Previous studies have shown that inhibition of AR in myeloid cells by enzalutamide increases their tumor-promoting ability by inhibiting adaptive immunity and enhancing the suppressive activity of MDSC.46 Therefore, there are potential associations between antiandrogen resistance and immune escape in CRPC. In the present study, enzalutamide treatment initially inhibited the growth of prostate tumors in mice; however, CD8+ T cells were significantly suppressed in the tumors. When mice developed enzalutamide resistance, Treg, MDSC infiltration, and PD-L1 expression in the tumor tissues were increased. MDSC is one of the major players in antiandrogen resistance in prostate cancer, and their infiltration contributes to the immunosuppressive microenvironment formation.18 We found that Myc-CaP MDVR cells could significantly induce BMs to differentiate into MDSC cells compared with parental cells, and the mechanisms that induce MDSC differentiation are currently under investigation. Notably, co-culture with Myc-CaP MDVR cells also significantly increased Treg cells and decreased CD8+IFN-γ+ cytotoxic T-cell population. In addition to MDSC, TAM has also been found to promote tumor progression by inducing inflammation, immunosuppression, and angiogenesis, thereby supporting therapeutic resistance in prostate cancer.47 Studies have shown that enzalutamide induces tumor cells to express macrophage colony-stimulating factor 1 (CSF-1), resulting in a marked increase in TAM infiltration and polarization towards the M2 phenotype. Inhibition of the CSF1-CSF1R axis improves the efficacy and durability of enzalutamide.48 Our results indicated that prostate cancer cells can induce the differentiation of BMs into macrophages. However, co-culture with Myc-CaP MDVR cells significantly increased macrophage polarization from the M1 phase to M2 phase, and the underlying mechanisms related to AR signaling and macrophage polarization need to be further investigated. Taken together, these results suggest that enzalutamide-resistant CRPC cells promote self-immune evasion by inducing immunosuppressive cell infiltration and by forming an immunosuppressive microenvironment.
In conclusion, our study revealed that enzalutamide-resistant CRPC cells promote immunosuppressive cell recruitment and differentiation, thereby supporting the formation of an immunosuppressive microenvironment. These results highlight the interaction of the immune system during the drug resistance transition in prostate cancer and provide a theoretical foundation for the development of effective therapeutic strategies against CRPC.
Data availability statement
Data are available upon reasonable request.
Ethics statements
Patient consent for publication
Ethics approval
Not applicable.
Acknowledgments
We sincerely thank Dr. Junwei Zhao in the Department of Biochemistry and Molecular Medicine at UC Davis for their assistance in our study. We sincerely thank Flow Cytometry Core at UC Davis Comprehensive Cancer Center which is funded by the UC Davis Comprehensive Cancer Center Support Grant (CCSG) awarded by the National Cancer Institute (NCI P30CA093373).
References
Footnotes
Twitter @liu,chengfei
PX and JCY contributed equally.
Contributors PX, JCY, WJM, and CL conceived of the project and designed the experiments. PX, JCY, JEVD, WJM, and CL developed the methodology. PX, JCY, CN, and BC performed the experiments and acquired the data. CN, CPE, XZ, and H-WC provided the technical and material support. PX and BC performed bioinformatics analysis. PX, JCY, WJM, and CL interpreted and analyzed the data. PX, JCY, and CL wrote the manuscript. CN, WJM, CPE, and CL edited the manuscript. CL supervised the study. CL is responsible for the overall content as guarantor.
Funding This work was supported in part by grants from the NIH/NCI R37CA249108 (Liu) and R01CA251253 (Liu).
Competing interests No, there are no competing interests.
Provenance and peer review Not commissioned; externally peer reviewed.
Supplemental material This content has been supplied by the author(s). It has not been vetted by BMJ Publishing Group Limited (BMJ) and may not have been peer-reviewed. Any opinions or recommendations discussed are solely those of the author(s) and are not endorsed by BMJ. BMJ disclaims all liability and responsibility arising from any reliance placed on the content. Where the content includes any translated material, BMJ does not warrant the accuracy and reliability of the translations (including but not limited to local regulations, clinical guidelines, terminology, drug names and drug dosages), and is not responsible for any error and/or omissions arising from translation and adaptation or otherwise.