Article Text

Abstract
Background Immune checkpoint inhibitors (ICIs) have revolutionized the treatment of cancer. However, only a portion of patients respond to such treatments. Therefore, it remains a prevailing clinical need to identify factors associated with acquired resistance or lack of response to ICIs. We hypothesized that the immunosuppressive CD71+ erythroid cells (CECs) within the tumor and/or distant ‘out-of-field’ may impair antitumor response.
Methods We studied 38 patients with cancer through a phase II clinical trial investigating the effects of oral valproate combined with avelumab (anti-programmed death-ligand 1 (PD-L1)) in virus-associated solid tumors (VASTs). We quantified the frequency/functionality of CECs in blood and biopsies of patients. Also, we established an animal model of melanoma (B16-F10) to investigate the possible effects of erythropoietin (EPO) treatment on anti-PD-L1 therapy.
Results We found a substantial expansion of CECs in the blood of patients with VAST compared with healthy controls. We noted that the frequency of CECs in circulation was significantly higher at the baseline and throughout the study in non-responders versus responders to PD-L1 therapy. Moreover, we observed that CECs in a dose-dependent manner suppress effector functions of autologous T cells in vitro. The subpopulation of CD45+CECs appears to have a more robust immunosuppressive property compared with their CD45− counterparts. This was illustrated by a stronger expression of reactive oxygen species, PD-L1/PD-L2, and V-domain Ig suppressor of T-cell activation in this subpopulation. Lastly, we found a higher frequency of CECs in the blood circulation at the later cancer stage and their abundance was associated with anemia, and a poor response to immunotherapy. Finally, we report the expansion of CECs in the spleen and tumor microenvironment of mice with melanoma. We found that although CECs in tumor-bearing mice secret artemin, this was not the case for VAST-derived CECs in humans. Notably, our results imply that EPO, a frequently used drug for anemia treatment in patients with cancer, may promote the generation of CECs and subsequently abrogates the therapeutic effects of ICIs (eg, anti-PD-L1).
Conclusions Our results demonstrate that anemia by the expansion of CECs may enhance cancer progression. Notably, measuring the frequency of CECs may serve as a valuable biomarker to predict immunotherapy outcomes.
- immunotherapy
- immune checkpoint inhibitors
- biomarkers, tumor
- CD8-positive T-lymphocytes
- immune tolerance
Data availability statement
All data relevant to the study are included in the article or uploaded as supplementary information.
This is an open access article distributed in accordance with the Creative Commons Attribution Non Commercial (CC BY-NC 4.0) license, which permits others to distribute, remix, adapt, build upon this work non-commercially, and license their derivative works on different terms, provided the original work is properly cited, appropriate credit is given, any changes made indicated, and the use is non-commercial. See http://creativecommons.org/licenses/by-nc/4.0/.
Statistics from Altmetric.com
- immunotherapy
- immune checkpoint inhibitors
- biomarkers, tumor
- CD8-positive T-lymphocytes
- immune tolerance
WHAT IS ALREADY KNOWN ON THIS TOPIC
Immune checkpoint inhibitors (ICIs) have provided a novel avenue for cancer treatment, however, identifying responders from non-responders has been a challenge.
WHAT THIS STUDY ADDS
In this study, we have highlighted the role of CD71+ erythroid cells (CECs) in cancer progression and how erythropoietin (EPO) influences CECs.
HOW THIS STUDY MIGHT AFFECT RESEARCH, PRACTICE OR POLICY
Our findings shed light on the adverse effects of EPO on cancer progression and its inter-reference with ICIs
Introduction
Immune checkpoint inhibitors (ICIs) as a novel immunotherapy approach have revolutionized the treatment of cancer. Analysis of clinical trials in different cohorts identifies three broad groups based on their response to ICIs. (1) those who respond to treatments (responders (R)), (2) some who initially respond but eventually demonstrate progressive disease (acquired resistance), and (3) those who do not respond at any point (non-responders (NR)).1 Therefore, it remains a prevailing clinical need to identify factors associated with acquired resistance or lack of response to ICIs. Failure of ICIs therapy might be related to the lack of tumor-specific cytotoxic T cells (CTLs) generation, low tumor mutational burden/neoantigens, defects in antigen processing and presentation, or insufficient effector T-cell infiltration and function in the tumor microenvironment (TME).2 3 It is known that CTLs effector functions can be impaired by a variety of tumor-intrinsic and extrinsic immune elements.4 5 For instance, some of the tumor-educated immune cells such as myeloid-derived suppressor cells (MDSCs), regulatory T cells (Tregs), and tumor-associated macrophages are being explored as potential extrinsic factors impairing antitumor T-cell responses in the TME.6 7 Furthermore, it has been shown that the recruitment of neutrophils from distant organs can facilitate tumor metastasis,8 9 and platelets can protect tumor cells from immune system elimination.10 11 These examples demonstrate an important role for other immune cell types, in particular, innate immune cells in interfering with antitumor immunity.
Due to their immunosuppressive properties, erythroid progenitors and precursors have attracted much attention in the cancer field and beyond.12–16 Under normal physiological conditions in human adults, erythrocytes are generated in the bone marrow (BM). However, stresses such as cancer, anemia, and chronic infections can promote erythropoiesis outside of the BM.15–17 This process, so-called ‘extramedullary erythropoiesis (EE)’ occurs in other organs such as the liver and spleen,18 19 which subsequently results in the abundance of erythroid precursors and progenitors defined as ‘CD71+ erythroid cells (CECs)’ in the periphery.20 Alternatively, under certain pathological conditions, a substantial number of CECs may exit the BM and become abundant in the periphery. CECs co-express CD71 (the transferrin receptor) and CD235a (the erythroid lineage marker) in humans but CD71 and TER119 in mice.14 Via cell–cell interactions and/or soluble mediators, it has been shown that CECs exert immunosuppressive properties.15 21 It is reported that CECs impair Epstein-Barr virus (EBV) specific CTL proliferation in anemic patients with advanced cancer.13 Similarly, vigorous suppression of T-cell proliferation in melanoma-bearing mice by splenic CECs has been reported.13 Interestingly, it was reported that CECs via secreted artemin enhance tumor progression in a hepatocellular carcinoma (HCC) model.12 Artemin (ARTN) (a member of the glial cell-derived neurotropic factor family (GDNF) of ligands) activates downstream signals via its receptor GFRa3 resulting in tumor progression.12 ART signaling is mediated via a multicomponent receptor complex including the GDNF family receptor GFRα3 as one ligand-binding component and rearranged during transfection (RET) receptor tyrosine kinase as a common signaling factor.22 However, whether human CECs similar to their counterparts in mice express ARTN requires further investigation.
Furthermore, the intertumoral abundance of CD45+CECs has been linked to immune tolerance and the recurrence of HCC.23 Most recently, it has been reported the hijacking of erythropoiesis for myelopoiesis in patients with cancer and animal tumor models.24 In this fascinating process, erythroid progenitors were converted into highly potent immunosuppressive hybrid cells defined as ‘erythroid differentiated myeloid cells (EDMCs)’.24 Collectively, these studies support the immunosuppressive properties of erythroid progenitors in different physiological and pathological conditions in human and animal models.25–28 Mechanistically, CECs suppress immune responses via transforming growth factor (TGF)-β, arginase-I, arginase-II, reactive oxygen species (ROS) or through cell–cell interactions (eg, programmed cell death protein-1 (PD-1):programmed death-ligand 1 (PD-L1)/PD-L2, V-domain Ig suppressor of T-cell activation (VISTA), galectins) and perhaps promotion of Tregs.13 16 17 29–31 Considering the crucial role of CTLs in eliminating virus-infected and tumor cells, expanded CECs and EDMCs in these scenarios can impair their effector functions. Likewise, vigorous and functional CD4+ T cells can play an essential role in combating viral infections and cancer. In the context of cancer, CD4+ T cells can destroy tumor cells via cytolytic mechanisms or by modulating the TME.32 Besides, CD4+ T cells can enhance the recruitment of CTLs into the TME and facilitate their differentiation into effector and memory CTLs.33 Therefore, the expansion of CECs and EDMCs can indiscriminately suppress the effector functions of both CD4+ and CD8+ T cells.24 34 35
Chronic viral infections (eg, EBV and human papillomavirus (HPV)) are causative factors for the development of multiple cancers, including squamous cell cancers of the head and neck (HNSCC), gynecological cancers, cancers of the penis and cancer of the anal canal.36
Over the past two decades, a sharp rise in the proportion of virus-associated HNSCC has recently been noted.37 The immune evasion of virus-associated HNSCC, which is well characterized by the upregulation of PD-L1/PD-L2 in TME, often results in cancer recurrence and metastasis.38 Since CECs exhibit immunosuppressive properties, they might play a role in virus-associated solid tumors (VASTs). Although the role of CECs in cancer biology in a few cancer types has been documented,39 there is no evidence about their potential roles (eg, impairing T cells effector functions and tumor progression) in solid tumors arising due to chronic viral infections.
Cancer-related anemia (CRA) is frequently observed in late-stage human cancers and is associated with poor clinical outcomes, however, it is linked to multiple etiologies factors.40 For example, inflammation and proinflammatory cytokines such as tumor necrosis factor (TNF)-α, interleukin (IL)-6, and IL-1 contribute to the suppression of medullary erythropoiesis.41 Also, IL-1 and TNF-α reduce the expression of erythropoietin (EPO) receptors and impair EPO synthesis.42 Alternatively, inflammatory cytokines such as IL-1 by activating macrophages promote erythrophagocytosis, which results in the premature elimination of erythrocytes.43 Subsequently, anemia as a compensatory mechanism to meet the host’s demand initiates EE, which results in the expansion of CECs in the liver, spleen, and blood circulation.44 Nevertheless, EE does not necessarily overcome the hypoxia as the tumor manipulates the erythropoiesis to convert erythroid progenitors to EDMCs to evade antitumor immunity.24
EPO has widely been used in different clinical trials to overcome hypoxia in patients with cancer, however, these trials have been associated with poor clinical outcomes.45 This suggests that EPO-induced erythroid progenitors (eg, CECs) may enhance resistance to immunotherapy.
Here, we report the expansion of CECs as a novel mechanism associated with immune non-responsiveness to ICIs in a cohort of patients with VAST. In particular, we show that CECs vigorously suppress both CD4+ and CD8+ T cells derived from the peripheral blood of patients with VASTs. We also reveal that cancer-associated CECs partially mediate their immunosuppressive properties via ROS. Besides, we suggest anemia as a possible contributing factor to the expansion of CECs. Notably, our results indicate that the abundance of CECs is associated with poor clinical outcomes in patients with VAST receiving anti-PD-L1 immunotherapy. Finally, using a B16-F10 melanoma model, we investigated the possible interference of EPO with the anti-PD-L1 therapy.
Material and methods
Study population
We conducted a non-randomized, single-arm, basket phase II clinical trial investigating the effects of oral valproate combined with avelumab (anti-PD-L1) in patients with VASTs.46 These patients were all positive for virus-associated cancers (majority head and neck, HPV-related, and a few EBV-related nasopharyngeal carcinomas) but there were also patients with other cancer types (ie, HPV-related gynecological cancer, anal canal, and penile cancers (online supplemental figure S1A). For comparison, 20 age-sex-matched cancer-free, HIV, SARS-CoV-2, hepatitis C virus (HCV), and hepatitis B virus (HBV) seronegative individuals were recruited.
Supplemental material
Supplemental material

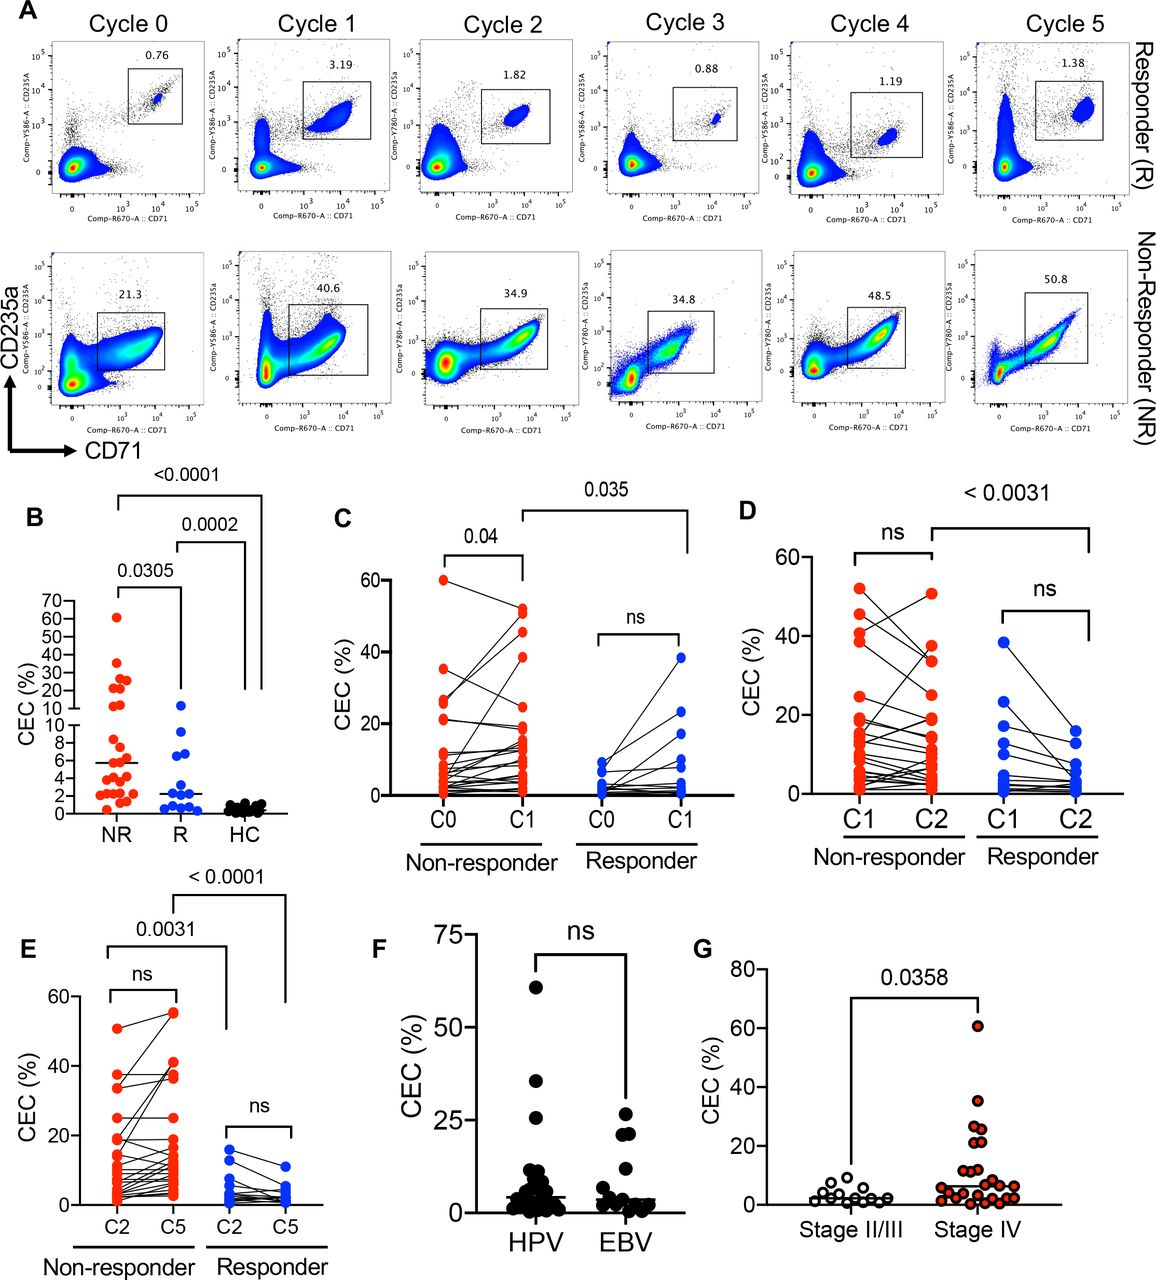
A higher frequency of CECs in non-responders versus responders. (A) Representative flow cytometry plots of the percentage of CECs in PBMCs of a responder (R, n=13) versus a non-responder (NR, n=25) patient with VAST at cycle (0) or baseline, 2 weeks post valproate treatment (cycle 1), 2 weeks post avelumab therapy (cycle 2), 4 weeks (cycle 3), 6, and 8 weeks post avelumab therapy. (B) Cumulative data of the frequency of CECs in PBMCs of NR, R and HCs. (C) Cumulative data of the percentages of CECs at cycle 0 (C0) and cycle 1 (C1) in non-responders versus responders to avelumab therapy. (D) Cumulative data of the percentages of CECs at cycle 1 (C1) and cycle 2 (C2) in non-responders versus responders to avelumab therapy. (E) Cumulative data of the percentages of CECs at cycle 2 (C2) and cycle 5 (C5) in non-responders versus responders to avelumab therapy. (F) Cumulative data showing percentages of CECs in VAST-associated HPV (n=26) versus EBV (n=12). (G) Data showing the percentages of CECs in stage II/III (n=13) versus stage IV (n=25) including (IV, IVA, IVB, and IVC) of patients with VAST. Each dot represents a patient and mean±SEM, p value as indicated for each data set or not significant (ns). Non-responder (NR), responder (R), healthy control (HC), cycle (C). CEC, CD71+ erythroid cell; EBV, Epstein-Barr virus; HPV, human papillomavirus; PBMC, peripheral blood mononuclear cell; VAST, virus-associated solid tumor.
Peripheral blood was collected at the baseline/day 0 (prior to the initiation of treatment), 2 weeks post valproate (cycle 1), 2 weeks post-avelumab (cycle 2), and different cycles (2 weeks apart).
The peripheral blood processing and cell culture
Peripheral blood mononuclear cells (PBMCs) were isolated from fresh blood of either HCs or patients with VAST using Ficoll-Paque gradients and cultured in Roswell Park Memorial Institute Medium (RPMI) 1640 (Sigma) supplemented with 10% fetal bovine serum (Sigma) and 1% penicillin/streptomycin (Sigma). For proliferation assay, autologous T cells were isolated from PBMCs, labeled with carboxyfluoroscein succinimidyl ester (CFSE) dye and stimulated with anti-CD3/CD28 antibodies in the presence or absence of CECs at 1:1 or 1:2 ratios for 3 days according to our protocols.47 Similarly, the intracellular cytokine staining (ICS) was performed on stimulation of PBMCs with anti-CD3/CD28 in the absence or presence of different rations of CECs and Golgi blocker for 5 hours before flow cytometry staining and analysis as we have reported elsewhere.48 CECs were purified from PBMCs using magnetic cell isolation according to previous reports.27 34 In some experiments, apocynin (Sigma, 1 mM), which is the nicotinamide adenine dinucleotide phosphate (NADPH)-dependent ROS inhibitor was used.49
Biopsies and TIL isolation
Needle-core biopsy samples were collected from tumor sites before the commencement of treatment (screening) and immediately processed for cell isolation and analysis.
Animal study
Animal studies were approved by the animal research ethics boards at the University of Alberta with protocols # AUP0001021 and # AUP00002737. Adult male C57BL/6 mice were purchased from the Charles River Institute. They were either treated with EPO (0.3 µg/mouse) or phosphate buffered saline (PBS) (intraperitoneal injection) every other day for 6 days. Following three treatments, spleens were harvested and processed for cell isolation and flow cytometry staining according to our protocols.50 For the cancer model, B16-F10 melanoma cells that were originally obtained from the American Type Culture Collection (ATCC) were injected (1×10⁵ cells) subcutaneously on the left flank of B57BL/6 male mice under anesthesia conditions. Mice were grouped as control (PBS-treated), EPO-treated (0.3 µg/mouse, R&D, and Sino Biological), the anti-PD-L1-antibody treated (200 µg/mouse, Bio X Cell), or combination therapy (EPO+ anti-PD-L1). All were administered intraperitoneally.
Flow cytometry
Fluorophore antibodies specific to human cell antigens and cytokines were purchased from BD Biosciences, Thermo Fisher Scientific, and BioLegend. The following antibodies were used in our study: anti-CD3 (SK7), anti-CD4 (RPA-T4), anti-CD8 (RPA-T8), CD71 (MA712), CD235a (HIR2), PD-L1 (M1H1), PD-L2 (M1H18), anti-IL-2 (MQ1-17H12), anti-TNF-α (MAB11), and IFN-γ (4S.B3). Also, the following mouse antibodies were used in this study: anti-CD71 (C2F2), anti-TER119 (TER-119), anti-CD45 (30-F11), anti-PD-L1 (10 F-9G2), anti-PD-L2 (TY25), and anti-ARTN (R&D, AF-1085). Purified NA/LE mouse anti-human CD3 (UCHT1), anti-human CD28 (CD28.2), and Protein Transport Inhibitor (Containing Brefeldin A) were purchased from the BD Bioscience and ROS staining from Sigma. To assess cell viability, we used the LIVE/DEAD Kit (Life Technologies). Surface staining and ICS were performed as we described previously.51 52 After fixation with paraformaldehyde (4%), stained cells were acquired on a Fortessa-X20 or LSRFortessa-SORP (BD Bioscience) and analyzed using FlowJo software (V.10).
ELISA assays
Frozen plasma samples at −80°C were thawed and centrifuged for 15 min at 1500 g followed by dilution at twofolds. TGF-β (R&D, DY240), human ARTN (R&D, DY 2589), and mouse ARTN (R&D, DY1085) were quantified according to the manufacturer’s protocols.
Statistical analysis
P values displayed on cumulative flow cytometry plots were determined by the non-parametric Mann-Whitney test. When more than two groups were compared, one-way analysis of variance followed by Tukey’s test was used to compare the results. Prism software V.8 was used for statistical analysis. Results are presented as mean±SEM with p values<0.05 being considered statistically significant.
Results
A higher frequency of CECs in non-responders versus responders
To compare R versus NR and evaluate clinical outcomes of avelumab therapy, we used the standardized and validated guidelines according to the Response Evaluation Criteria in Solid Tumors.53 Based on these criteria, we classified our patients into immune complete response (iCR), immune partial response (iPR), immune unconfirmed partial responder (iUPR), immune confirmed/unconfirmed progressive disease (iCPD/iUCPD) and immune stable disease (iSD) categories. Considering the small sample size in some groups we combined iCPD/iUCPD as the NR and iCR/iPR/iSD/iUPR as the R group. Based on these classifications, we had 25 NR versus 13 R in our cohort (online supplemental table 1). The frequency of CECs in fresh PBMCs was measured at the baseline (cycle 0), 2 weeks after valproate treatment (C1), 2 weeks (C2), and 8 weeks (C5) after the initiation of avelumab therapy. Also, the frequency of CECs in biopsy samples (four samples) at the baseline was assessed. The clinical outcomes were evaluated at 12 and 24 weeks following the initiation of therapy. We observed that patients with progressive disease at the baseline had a significantly higher proportion of CECs in their PBMCs compared with the R group (figure 1A,B, and online supplemental figure S1B). Of note, both groups had a significantly higher abundance of CECs in their PBMCs compared with age-sex-matched HCs (figure 1B and online supplemental figure S1B). On the initiation of valproate administration (12.5 mg/kg orally), we found a significant increase in the frequency of CECs in the NR group when analyzed 2 weeks later (C1) (figure 1A,C). However, this change appeared to be transient and faded away 2 weeks later (C2). Although a similar trend was observed in the R group, it did not reach a significant level (figure 1A,C). We also quantified the frequency of CECs at 2, 4, 6 and 8 weeks post-initiation of avelumab therapy but we did not notice any remarkable changes in both groups (figure 1A–D). Intriguingly, the frequency of CECs remained significantly higher in NR compared with R in all examined cycles (figure 1B–E). Considering the impact of viral infections on the frequency of CECs,16 30 49 we segregated patients based on the type of the viral infection (HPV or EBV). However, we did not detect any significant difference in the frequency of CECs between groups at the baseline (figure 1F). Finally, we assessed the cancer stage according to cancer staging system54 with the frequency of CECs, which showed those at the later cancer stage (IV, IVA, IVB, IVC) had elevated levels of CECs compared with those at the earlier cancer stage II/III (figure 1G). These observations support the notion that CECs were expanded in all patients with VAST but more so in NR.
Supplemental material
CD45+CECs are the prominent cells expressing ROS and VISTA
To better understand the immunomodulatory functions of CECs, we subjected them to ROS, PD-L1/PD-L2, and VISTA expression analysis. As anticipated, we found that in general CECs express a higher level of ROS compared with their matured siblings (red blood cells (RBCs)) in PMBCs of patients with cancer (figure 2A). In particular, we noted that CECs-derived from the TME express significantly higher levels of ROS compared with their counterparts in PBMCs (figure 2B,C). Moreover, we measured PD-L1/PD-L2 expression in CECs and noticed that these co-inhibitory ligands were highly expressed in the TME-derived CECs compared with their counterparts in PBMCs (figure 2D–F). Given that CD45+CECs compared with their CD45− siblings display a prominent immunomodulatory function,30 35 we compared the expression of ROS in CD45+/CD45–CECs. These studies revealed that CD45+CECs had significantly a greater level of ROS (figure 2G,H). It is reported that a subpopulation of CECs that express VISTA promotes the induction of Tregs via TGF-β in mice.31 Therefore, we analyzed the expression of VISTA in CECs. We found that the expression of VISTA was mainly restricted to CD45+CECs (figure 2I,J). Notably, VISTA+CECs had the most prominent levels of ROS compared with CD45+VISTA− CECs (figure 2K,L). Although CECs via TGF-β and arginase-I/II mediate their immunomodulatory functions, we were unable to quantify this. It is impossible to perform intracellular staining on human cancer-derived CECs as they do not resist the permeabilization buffer. However, we have detected TGF-β and arginase messenger RNAs (mRNAs) in human CECs in other conditions.34 55 Moreover, we have observed that SARS-CoV-2 infection influences the membrane of CECs and makes them resistant to permeabilization buffer.16 56 Therefore, we were able to analyze the expression of arginase-I/II in CECs-derived from patients with COVID-19.16 Collectively, these results imply that CECs via PD-L1/PD-L2, VISTA, or soluble factors (eg, ROS, TGF-β, and arginase) exhibit their immunological properties.

CD45+CECs are the prominent cells expressing ROS and VISTA. (A) Representative plot of ROS expression in CECs versus RBCs from a PBMC sample. (B) Representative plot of ROS expression in CECs from the TME. (C) Cumulative data comparing the expression of ROS in RBCs, CECs from PBMCs and from the TME. (D) Representative plot of PD-L1-/PD-L2 expression in CECs from PBMCs, or (E) from the TME. (F) Cumulative data of percentages of PD-L1–PD-L2 expressing CECs in PBMCs versus TME. (G) Representative plots, and (H) cumulative data of ROS expression in CD45− versus CD45+ CECs of PBMCs. (I) Representative plots, and (J) cumulative data of percentages of VISTA-expressing cells within CD45− and CD45+CECs from PBMCs of patients with virus-associated solid tumor. (K) Representative plots, and (L) cumulative data of ROS expression among CD45+VISTA+ and CD56+VISTA−CECs. Cumulative data of percentages of VISTA+CECs in CD45− and CD45+CECs from PBMCs as measured by the mean fluorescence intensity (MFI). Each dot represents a patient and mean±SEM, p value as indicated for each data set or not significant (NS). CEC, CD71+ erythroid cell; FMO, fluorescence minus one; PBMC, peripheral blood mononuclear cell; PD-L1, programmed death-ligand 1; RBC, red blood cells; ROS, reactive oxygen species; VISTA, V-domain Ig suppressor of T-cell activation; TME, tumor microenvironment.
CECs in a dose-dependent fashion suppress effector functions of CD4+ and CD8+ T cells
To determine whether CECs modulate cytokine production and T-cell proliferation, we isolated CECs from PBMCs of patients with VAST with high purity (>95%) (figure 3A) and added at 1:1 or 1:0.5 to autologous T cells. We found that CECs, in a dose-dependent manner, suppress TNF-α and IL-2 expression in CD4+ T cells following stimulation with anti-CD3/CD28 antibodies for 6 hours (figure 3B–E). Moreover, we found that CECs suppress the proliferative capacity of autologous CD4+ T cells in a dose-dependent manner (online supplemental figure S2A,B). The same observation was made for the suppression of CD8+ T cells by autologous CECs in a dose-dependent manner (figure 3F,G). Also, we analyzed the expression of TNF-α/interferon (IFN)-γ in CD8+ T cells in the presence and absence of CECs, which once again showed that CECs, in a dose-dependent fashion, suppress cytokine expression by CD8+ T cells following stimulation with anti-CD3/CD28 antibodies (figure 3H,I). Notably, we noticed that apocynin (1 mM), the NADPH-dependent ROS inhibitor, partially but significantly abrogated the immunosuppressive effects of CECs (figure 3H,I) as we have reported elsewhere.35 Therefore, abundant CECs in patients with cancer display immunosuppressive properties that may impair adaptive immune response against the tumor.
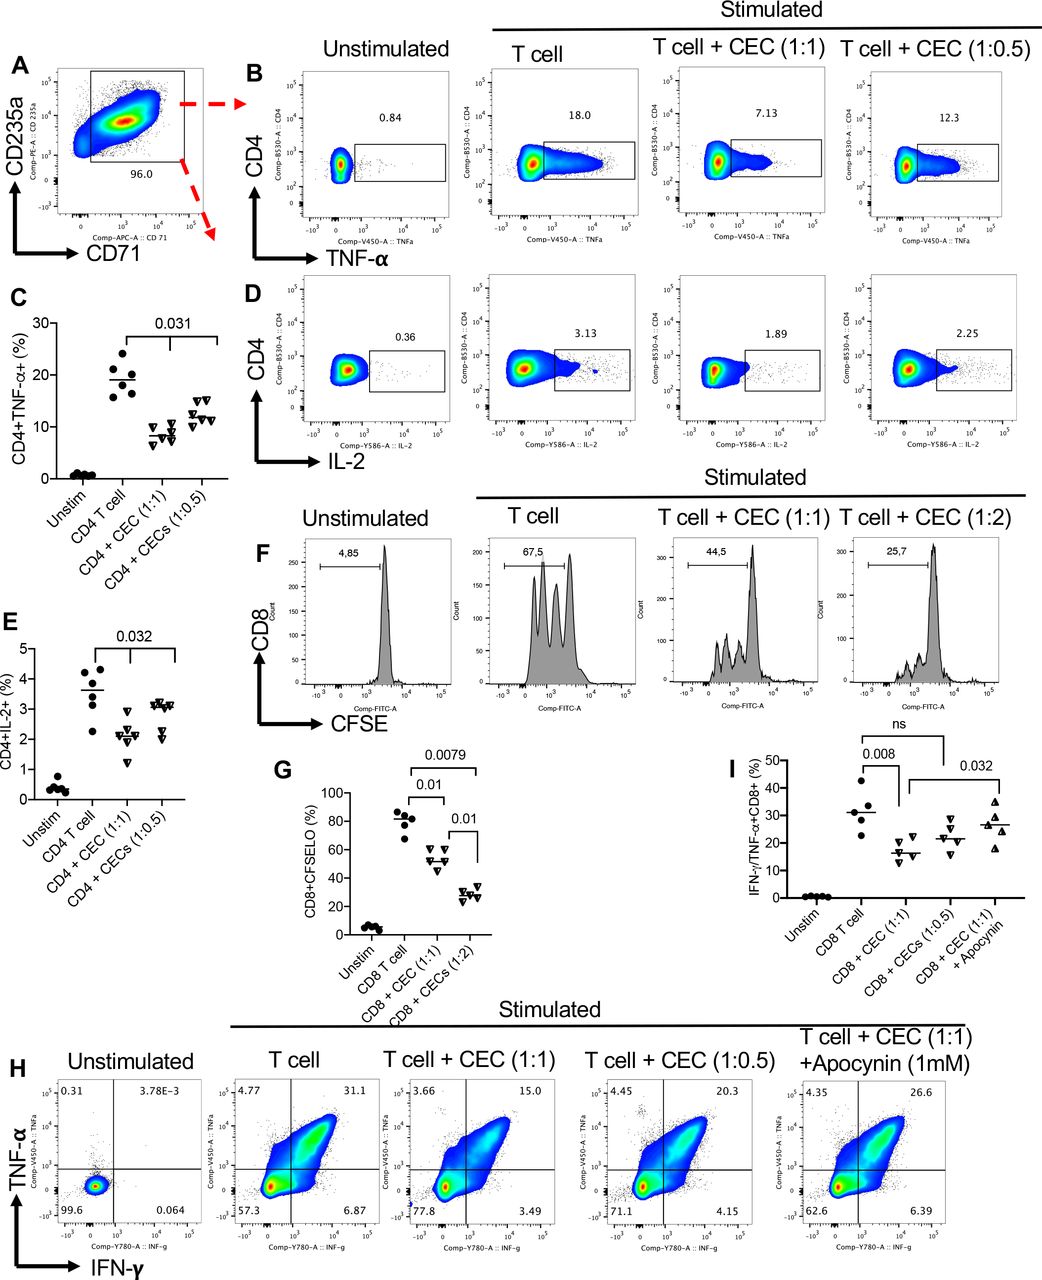
CECs from the peripheral blood of patients with virus-associated solid tumors exhibit immunosuppression. (A) Representative flow cytometry plot showing the purity of isolated CECs from peripheral blood mononuclear cells of a patient with cancer. (B) Representative flow cytometry, and (C) cumulative data showing TNF-α expression in CD4+T cells in the absence or presence of CECs (at 1:1 or 1:05 ratio) on stimulation with anti-CD3/CD28 antibodies for 6 hours as measured by the intercellular staining (ICS). (D) Representative flow cytometry, and (E) cumulative data showing IL-2 expression in CD4+T cells in the absence or presence of CECs (at 1:1 or 1:05 ratio) on stimulation with anti-CD3/CD28 antibodies for 6 hours as measured by ICS. (F) Representative flow cytometry, and (G) cumulative data showing proliferation of CD8+T cells in the absence or presence of CECs (at 1:1 or 1:2 ratio) on stimulation with anti-CD3/CD28 antibodies for 3 days as measured CFSE. (H) Representative flow cytometry, and (I) cumulative data showing TNF-α/IFN-γ expression in CD8+T cells in the absence or presence of CECs (at 1:1 or 1:05 ratio) on stimulation with anti-CD3/CD28 antibodies for 6 hours as measured by the ICS. Each dot represents a patient and mean±SEM, p value as indicated for each data set. CEC, CD71+ erythroid cell; IFN, interferon; IL, interleukin; ns, not significant; TNF, tumor necrosis factor.
No association between the frequency of CECs with the plasma concentrations of ARTN and TGF-β1 but a direct correlation between the plasma concentrations of ARTN with TGF-β1
Given the expression of TGF-β1 by mice-derived CECs,15 31 we quantified the plasma levels of TGF-β1 in R and NR in different cycles. We did not find any difference in the plasma TGF-β1 level between R and NR but neither was a significant change with time after beginning treatment in both groups observed (figure 4A). Moreover, we analyzed the frequency of CECs with the plasma concentration of this cytokine but once again we did not detect any remarkable correlation at C0 (figure 4B). The same results were observed for other cycles as we did not find any difference between cycles in terms of TGF-β1 level (figure 4A). Next, we quantified the levels of plasma ARTN in HCs versus patients with VAST. These analyses supported a significant increase in plasma ARTN concentrations in patients with VAST (figure 4C). However, the plasma ARTN concentrations were neither significantly different between R versus NR nor between cycles of treatment (figure 4D). Similar to TGF-β1, we did not observe any significant correlation between the ARTN levels and the frequency of CECs in patients with VAST (figure 4E). Considering that elevated serum ARTN level is reported to be associated with poor prognosis in patients with HCC,12 we compared ARTN levels in our patients with VAST. However, we did not notice any significant difference between stages II/III and IV in our cohort (figure 4F). The lack of correlation between the frequency of CECs with the plasma ARTN concentration is further highlighted in two NR and R patients in figure 4G. However, we found a positive correlation between the plasma ARTN and TGF-β1 in patients with VAST regardless of their response status to avelumab (figure 4H). Although it was not practical to perform intracellular staining for ARTN in human CECs as they get lysed once treated with the permeabilization buffer,34 we performed quantitative PCR (qPCR) analysis. These studies did not support the expression of ARTN mRNA in CECs from patients with VAST (figure 4I). Although we were able to detect ARTN mRNA in tumor tissues, this was not the case for isolated CECs from patients with VAST and human cord blood (figure 4I). Moreover, we performed intracellular staining in CECs from B16-F10 mice, as they resist the permeabilization buffer, which enabled us to detect significantly higher levels of ARTN in CD45+CECs than their negative counterparts (figure 4J,K). Finally, we isolated CECs from the spleen of tumor-bearing mice (B16-F10) and the peripheral blood of patients with VAST and cultured them for 48 hours in the absence of any cytokines/stimulation. The culture supernatants were subjected to an ELISA assay, which confirmed our qPCR results (figure 4L). Although CECs from tumor-bearing mice constitutively secrete ARTN, this was not the case for CECs from human patients with cancer (figure 4L). We also did not find any correlation between either CD45+ or CD45−CECs with plasma ARTN levels in patients with VAST. These observations reveal that there are substantial differences between human and mouse CECs in terms of their biological properties and should be considered.
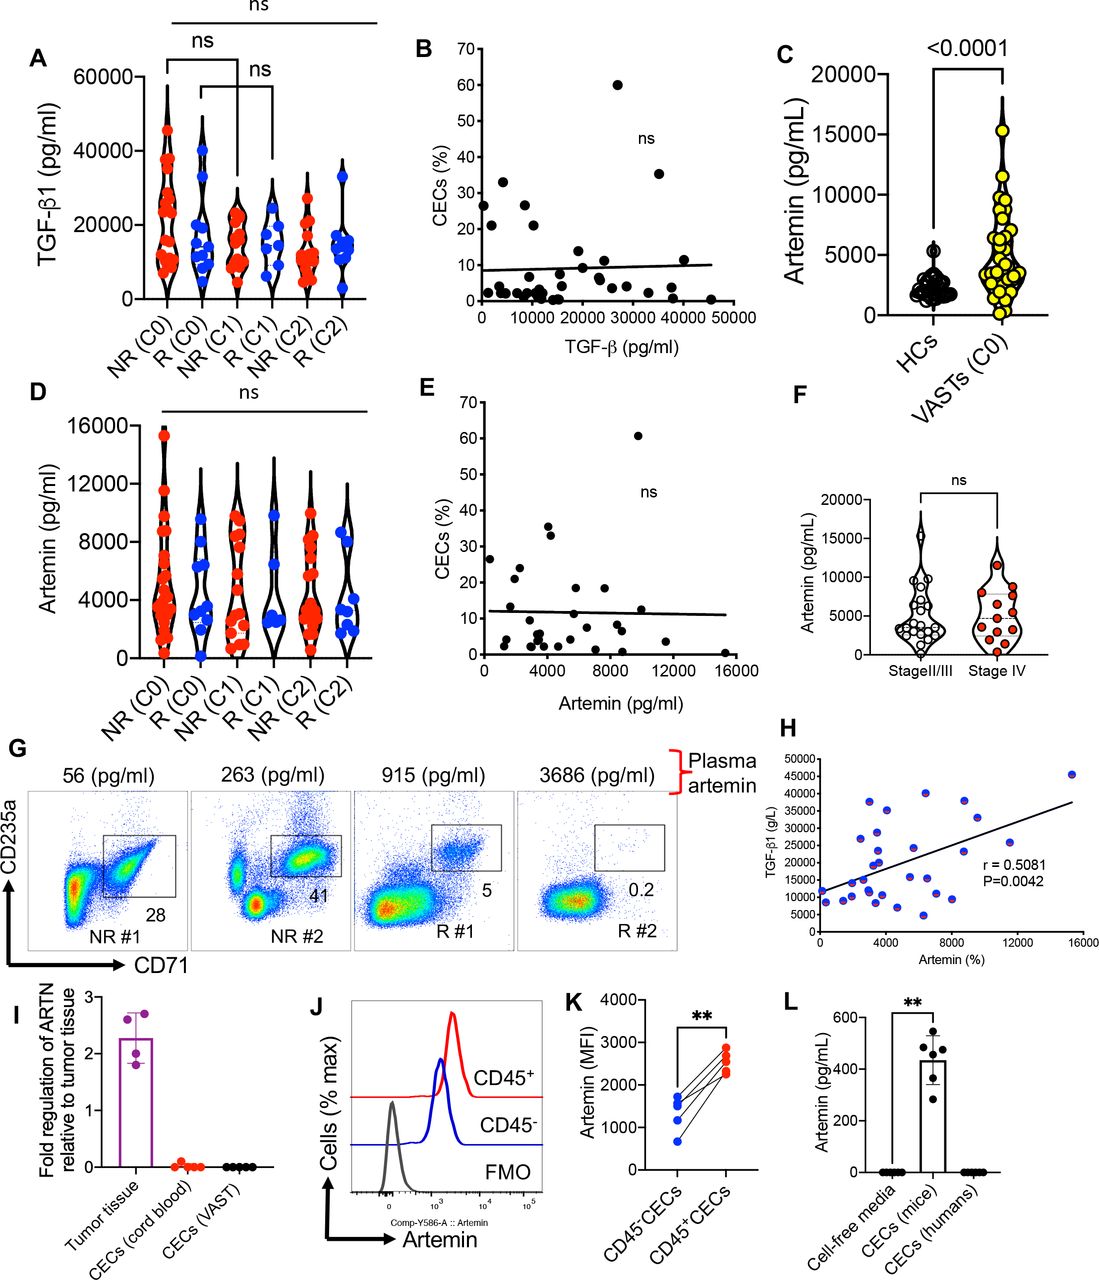
Lack of association between CECs and ART/TGF-β1 but a direct correlation between the plasma concentrations of ART with TGF-β1. (A) The plasma TGF-β1 level in non-responders (NR) and responders (R) at different cycles. (B) The plot showing the correlation of TGF-β1 concentration with the frequency of CECs in PBMCs of patients with VAST (combined NR and R). (C) Comparing the concentration of ART in HCs versus patients with VAST. (D) The plasma ART level in NR and R at different cycles. (E) The plot showing the correlation of ART concentration in the plasma with the frequency of CECs in PBMCs of patients with VAST (combined NR and R). (F) Comparing the concentration of ART in patients with VAST (stages II/III vs stage IV). (G) Representative plots of % CECs with the plasma concentration of ARTN in two NR and two R . (H) The plot showing the correlation of ART with TGF-β1 concentration in the plasma of patients with VAST (combined NR and R). (I) Fold regulation of ARTN gene expression in tumor tissues and isolated CECs from human cord blood or patients with VAST. (J) Representative, and (K) cumulative data of ARTN expression in CD45−CECs versus CD45+CECs from the spleen of B16-F10 mice. (L) Cumulative data of ARTN concentrations in culture supernatants of CECs from B16-F10 splenic CECs or VAST-derived CECs after 48 hours culture. Each dot represents a patient or an animal and mean±SEM, p value as indicated for each data set or not significant (NS). ARTN, artemin; CEC, CD71+ erythroid cell; FMO, fluorescence minus one; HCs, healthy controls; MFI, mean fluorescence intensity; PBMC, peripheral blood mononuclear cells; VAST, virus-associated solid tumors; TGF, transforming growth factor.
Anemia is associated with a higher frequency of CECs
Anemia remains a major clinical concern in patients with cancer and it is mainly tied to fatigue and poor quality of life.57 However, the potential immunological consequences of anemia due to the expansion of CECs have not been well-appreciated. We found an inverse and significant correlation between the hemoglobin (Hb) levels with the percentages of CECs in all patient groups (R+NR) (figure 5A). However, when R and NR were segregated we only observed a significant inverse correlation between Hb concentrations with the percentages of CECs in PBMCs of NR but not R even though a trend was noted (figure 5B,C). Next, we segregated anemic patients (women <120 Hb g/L and men <135 Hb g/L) and found that anemic women had significantly lower levels of Hb compared with men at C0 and C1 (figure 5D). Subsequently, we observed a significantly higher frequency of CECs in PBMCs of anemic women (figure 5E) compared with anemic men as reported in healthy women.27 Finally, we found an inverse correlation between the concentrations of Hb with the frequency of CECs in anemic women but not men (figure 5F,G). Overall the higher frequency of CECs was associated with poor clinical outcomes (eg, survival) when analyzed 18 months post ICI therapy. Consistently, most anemic patients with VAST with a higher frequency of CECs experienced cancer progression (68% compared with 23%). Taken together, these observations imply a higher predisposition of women to anemia-induced CECs and a higher CEC frequency was associated with poor clinical outcomes.
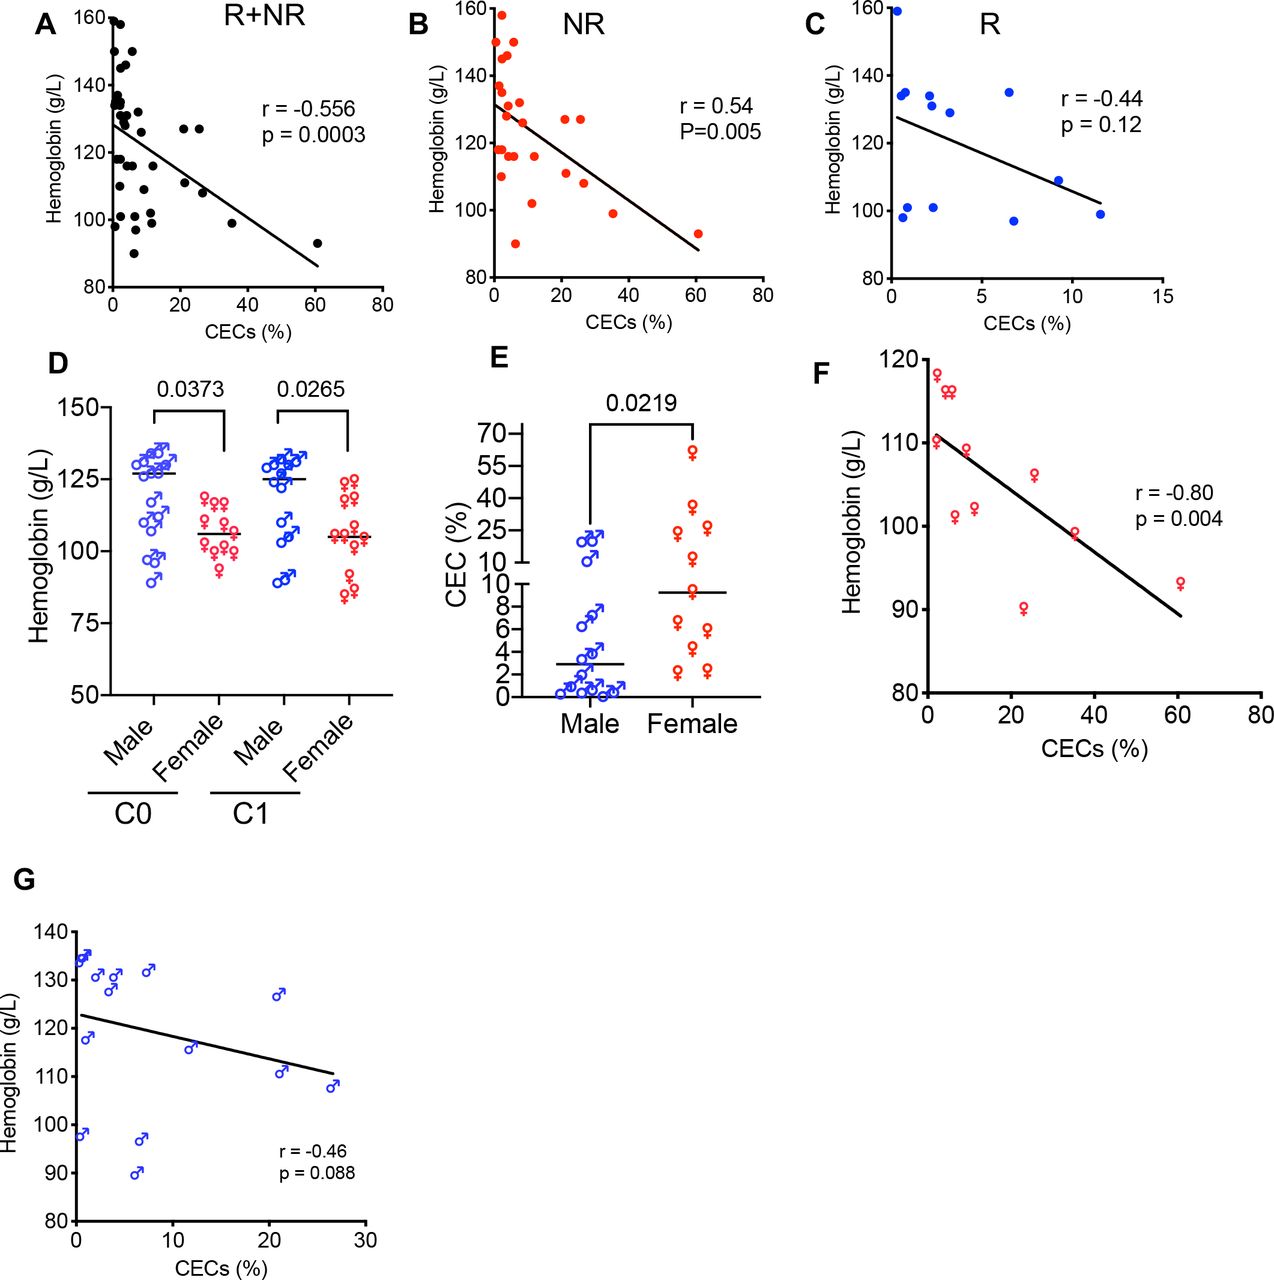
Anemia is associated with a higher frequency of CECs. (A) Data showing an inverse correlation between the frequency of CECs in PBMCs with the concentration of blood hemoglobin (Hb) levels in both groups (NR+R), (B) only NR, and (C) R patients. (D) Cumulative data of the concentration of Hb in anemic male versus anemic female patients with VAST. (E) Cumulative data of the percentages of CECs in PBMCs of anemic male versus anemic female patients with VAST. (F) The plot showing an inverse correlation between the Hb concentration with the frequency of CECs in PBMCs of anemic women and (G) anemic men with VAST. Each point represents a human study subject. Mean±SEM, p value as indicated for each data set. CEC, CD71+ erythroid cell; NR, non-responders; PBMC, peripheral blood mononuclear cell; R, responders; VAST, virus-associated solid tumor.
Erythropoietin expands CECs in cancer naïve mice and it abrogates the therapeutic effects of anti-PD-L1 therapy
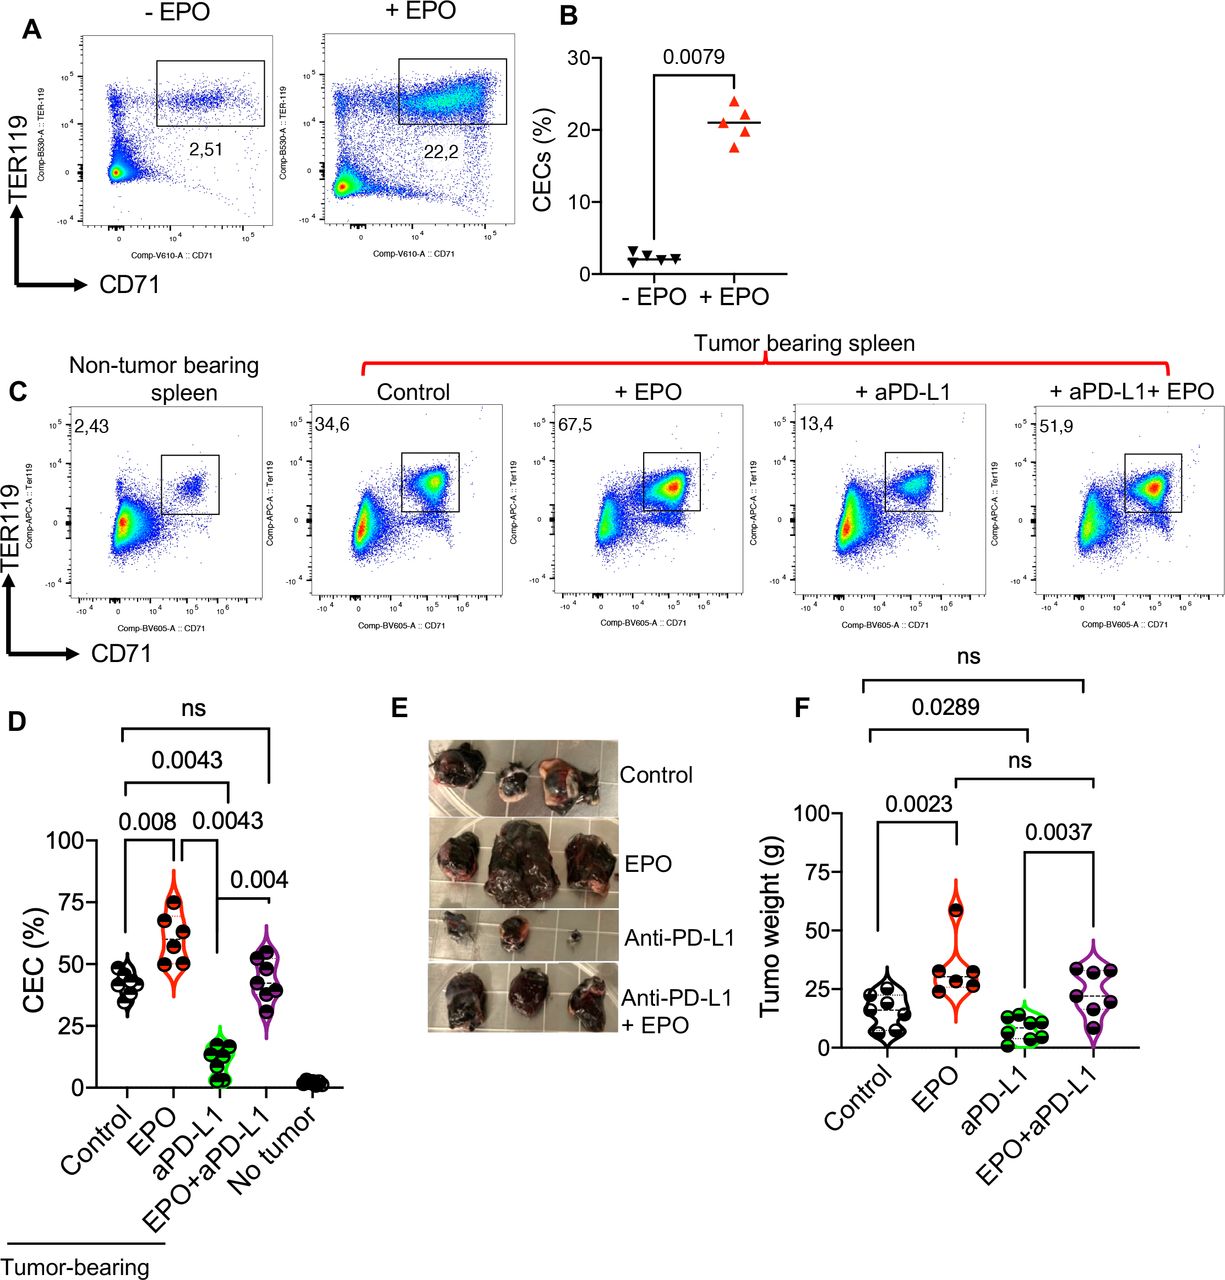
Given the common use of EPO for the treatment of CRA, we investigated the effects of EPO on the CEC population in the spleen of cancer naïve adult mice. We found that EPO significantly expands CECs in the spleen of mice (figure 6A,B and online supplemental figure S2C). This observation suggests that EPO may indirectly influence antitumor response in patients with cancer. Therefore, we decided to delineate the effects of EPO in the B16-F10 animal model. For this, we designed a study with four groups of mice; treated with PBS (control), EPO, anti-PD-L1, or EPO+ anti-PD-L1 as illustrated in online supplemental figure S2D. We found a significant expansion of CECs in the spleen of tumor-bearing control mice once analyzed at day 16 post-tumor implantation (figure 6C,D). However, the administration of EPO exhibited a synergistic effect but the anti-PD-L1 antibody resulted in an opposite outcome (figure 6C,D). We further investigated the impact of EPO on tumor progression by measuring tumor weight when the study was terminated. These analyses revealed that while anti-PD-L1 therapy reduced the tumor size, EPO alone enhanced the tumor growth and its combination with anti-PD-L1 resulted in reversing the therapeutic effects of this monoclonal antibody (figure 6E,F). These observations imply that EPO may enhance tumor progression via the expansion of potent immunosuppressive CECs.
EPO abrogated the therapeutic effects of anti-PD-L1 therapy via increased CECs. (A) Representative, and (B) cumulative data of the frequency of CECs in the spleen of untreated (− EPO) and treated mice with EPO (+ EPO). (C) Representative flow cytometry plots, and (D) cumulative data of the percentages of CECs in the spleen of cancer-free versus B16-F10 mice either untreated (control) or treated with EPO, anti-PD-L1, and the combination of anti-PD-L1/EPO. (E) Representative tumor size, and (F) and cumulative data showing tumor weight in different animal groups. Each point represents an animal. Mean±SEM, p value as indicated for each data set. Data are from two independent experiments. aPD-L1, anti-programmed death-ligand 1; CEC, CD71+ erythroid cell; EPO, erythropoietin; ns, not significant.
Considering that 20–30% of splenic CECs under normal physiological conditions express PD-L1 in mice17; and to gain a mechanistic insight into the interference of EPO with anti-PD-L1 therapy we quantified PD-L1+CECs in tumor-bearing mice. We found that the frequency of PD-L1 expressing CECs in the spleen and TME of B16-F10 mice was substantially higher than their counterparts in the spleen of tumor-free mice (online supplemental figure S3A,B). Moreover, the intensity of PD-L1 expression was more prominent in CECs-derived from the TME versus the spleen (online supplemental figure S3C). Of note, the intensity of PD-L1 expression in CECs was much higher than in CD11b cells (online supplemental figure S3C). These observations suggest that the anti-PD-L1 antibody may directly target PD-L1-expressing CECs in animal cancer models. However, this might not be the case for human CECs in the peripheral blood as they express a negligible amount of PD-L1 (figure 2A).
Discussion
CECs exhibit T-cell immunosuppression via direct cell–cell interactions (eg, PD-L1:PD-1), soluble factors (eg, ROS, arginase-I/II, and TGF-β), and induce Tregs, impair antigen-presenting cells function, and ultimately suppress adaptive cellular and humoral immune responses.16 17 23 29 31 34 51 Previous studies have investigated the role of CECs in human and animal models of melanoma and HCC.12 13 23 However, there is evidence of disparities between human CECs and their counterparts in animal models.21 In this study, we analyzed the frequency and functionality of CECs in PBMCs and TME in patients with VASTs. We observed that CECs were present in tumors and significantly expanded in the peripheral blood of patients with VASTs compared with HCs. It is worth mentioning that this expansion was more pronounced in NR than R to PD-L1-directed therapy. Our observations indicate that while valproate transiently expanded CECs, the anti-PD-L1 antibody did not substantially affect CECs in the periphery. This might be explained by the negligible expression level of PD-L1 on peripheral CECs. Although we were unable to obtain tumor biopsies pretreatment/post-treatment, our results imply that avelumab may modulate/deplete PD-L1+CECs in the TME. However, this hypothesis needs to be examined.
Functionally, we found that accumulated CECs in the periphery exhibited robust T-cell immunosuppressive properties through the generation of ROS and possibly arginase-I/II, cell–cell interactions, and TGF-β.21 Notably, this immunosuppression was non-discriminatory for both CD4+ and CD8+ T cells. Although it was not practical to isolate CD45+CECs, our observations suggest that this subpopulation displays a more vigorous immunosuppressive property than their CD45− siblings. In particular, we noted that VISTA+CD45+ CECs had a more vigorous ROS expression than their VISTA−CD45+ counterparts. This observation explains a novel link between VISTA with ROS in CECs, beyond the reported TGF-β/VISTA association.31 Considering the role of VISTA in immune exhaustion and tolerance,58 the possible interaction of VISTA+CECs via cell−cell contact with other immune cells (eg, T cells) merits further investigation.
Given the role of ARTN in tumor progression,12 59 it has been reported that CECs ‘referred to as Ter-like cells’ through ARTN release promote tumor growth in an animal model of HCC.12 In support of this concept, another group has reported that radiation therapy and/or anti-PD-L1 antibody treatment significantly decreases the frequency of CECs and ARTN in the spleen of mice.60 The underlying mechanism associated with the depletion of CECs has been proposed to be through the enhanced production of IFN-γ and CD8+ T-cell function.60 We argue that the mechanism could be due to the direct depletion of CECs since these cells express an elevated level of PD-L1 in mice under physiological17 or pathological conditions such as the B16-F10 melanoma model. However, we did not find any correlation between the plasma level of ARTN with the frequency of CECs or the disease stage in our cohort. More importantly, we observed that CECs from patients with VAST lacked ARTN at the mRNA and prorenin levels. As we have reported elsewhere, there are disparities in the properties of CECs in mice versus humans.15 21 Therefore, these differences should be taken into serious consideration when extrapolating the data from animal studies to human health and disease.
The presence of immunosuppressive cells in the TME is considered a promoting element in cancer progression,61 Therefore, we speculate that the abundance of CECs is associated with poor clinical outcomes. In agreement, we found that the frequency of CECs in the periphery at the baseline was correlated with disease stage and prognosis. However, we were unable to obtain tumor biopsies to determine the frequency and functionality of CECs in the TME with the disease progression although we confirmed their presence in four tumor biopsies.
CECs mainly originate from the spleen in neonates and animal cancer models13 14 62 but their origin in patients with VASTs is unknown. In addition to the spleen, the liver is another common EE niche,63 which supports the accumulation of CECs in HCC tissues.23 There are also reports of EE in other malignant tumors (eg, breast cancer, lung cancer, and Kaposi’s sarcoma).64 It is likely to suggest that CECs may originate from the BM or they could be directly generated through EE. The mechanism underlying the expansion of CECs is very complicated and the etiology of EE in patients with solid tumors remains ill-defined. There are multiple factors that can influence hematopoiesis including granulocyte colony-stimulating factor, IL-3, IL-7, EPO, macrophage colony-stimulating factor levels, conventional dendritic cells, and chemoradiotherapy-related BM suppression.65 66 Simply, anemia may promote the generation of RBCs to meet the host’s oxygen demand as a compensatory mechanism. Indeed, the shortage of RBCs/hypoxia to a certain extent might be associated with elevated frequency of CECs in patients with cancer. In line with this hypothesis, we found an inverse correlation between the frequency of CECs in the periphery of anemic patients with VAST with the Hb concentrations. This observation implies that anemia might be a compensatory driving mechanism for the generation of CECs and their early egress from the BM.
Notably, we observed that anemic female patients had a significantly increased frequency of CECs in their circulation compared with their anemic male counterparts, which is consistent with what has been reported in healthy women.27 This observation suggests that women could be more prone to the anemia-induced expansion of CECs than men.
Finally, our data indicate that EPO administration increases the frequency of CECs in the spleen of cancer naïve and tumor-bearing mice. Subsequently, the expansion of CECs was associated with tumor progression in EPO-treated mice. While anti-PD-L1 therapy inhibited tumor growth, EPO abrogated the therapeutic effects of this monoclonal antibody. These observations imply the indirect impact of EPO on the expansion of CECs and possible interference with ICIs, which may impair antitumor immunity and jeopardize the survival of patients with cancer.
Overall, our results demonstrate that immunosuppression is a crucial feature of CECs. Nevertheless, the underlying mechanism may differ under various circumstances. Most studies have reported that CECs through soluble factors such as ROS, TGF-β, arginase-I/II, cell–cell interactions, and by promotion of Tregs mediate their immunosuppressive properties.13 16 21 56 A recent study has reported that intertumoral CD45+CECs exhibited a more robust suppressive property than MDSCs.23 Mechanistically, this group revealed that CD45+CECs suppress T cells via cell−cell interaction and paracrine manner.23 Also, this study reported that tumor-associated CD45+CECs secrete IL-10.23 Therefore, CECs use diverse mechanisms to exert their immunosuppressive properties, and further investigations are needed to better define their characteristics and functions in different pathological conditions. Finally, the concept of EDMCs24 is another potential mechanism associated with anemia and tumor progression, which merits further investigation in other cancer models.
This study has several limitations. The major limitation of our study is the sample size. Also, this study did not investigate the prognostic value of tumor CECs. It is impractical to obtain tumor biopsies from most patients. The present study focused on VASTs, the results may differ for CEC frequencies in non-VASTs. We measured the global T-cell stimulation and were unable to evaluate antigen-specific responses. As such, further studies on the functionality of CECs on antigen-specific T cells are required. However, it has been reported that CECs suppress antigen-specific T cells in other conditions.13 16 Moreover, although poor clinical outcomes were observed in patients with VAST with a higher frequency of CECs at the baseline, these observations need to be validated in larger cohorts. Therefore, prospective studies targeting the prognostic values and testing methodologies of CECs frequency in larger patient with cancer cohorts are needed.
Taken together, in this study, we identified the accumulation of CECs in the circulation and the TME and highlighted their distinct immunosuppressive properties. Our results reveal that CECs might have a crucial role in immunosuppression/cancer progression due to their unique dual erythroid and immunomodulatory properties during health and disease.62 67 The current study determines the prognostic value of CEC frequency in circulation when assessed throughflow cytometry as a clinical utility of monitoring immune response to immunotherapy. Therefore, screening for the frequency of CECs might be a novel clinical approach to predicting immunotherapy outcomes.
Lastly, although animal studies are valuable in better appreciating the role of CECs in tumor progression, further investigations are needed to explore differences between human and mouse CECs. Without these, the translational value of such animal models in clinical settings will remain insufficiently characterized.
Data availability statement
All data relevant to the study are included in the article or uploaded as supplementary information.
Ethics statements
Patient consent for publication
Ethics approval
The Health Research Ethics Board of Alberta (HREBA protocol # HREBA CC-17-0374) and the University of Alberta approved blood collection from healthy controls with protocol # Pro00063463. Participants gave informed consent to participate in the study before taking part.
Acknowledgments
The authors would like to thank the University of Alberta, Faculty of Medicine and Dentistry, Flow cytometry facility, which has received financial support from the faculty of Medicine and Dentistry and the Canadian Foundation for Innovation (CFI) awards to contributing investigators. We also thank patients with cancer and healthy individuals who participated in this study.
References
Supplementary materials
Supplementary Data
This web only file has been produced by the BMJ Publishing Group from an electronic file supplied by the author(s) and has not been edited for content.
Footnotes
Contributors Conceptualization: SE, JW. Investigation: NB, IO, SM, JL, PK. Formal analysis: NB, IO, SM, JL, PK, SE. Funding acquisition: SE, JW. Project administration: SE. Supervision: SE. Validation: NB, IO, SM, JL, PK, SE. Writing-original draft: SE. Review and editing: SE, JW, NB, IO, JL, SM, PK. Guarantor: SE.
Funding This work was supported by a Foundation grant from the Canadian Institutes of Health Research (CIHR # 148442 to SE). In addition, Alberta Cancer Foundation supported the phase II cancer study (to JW and SE).
Competing interests None declared.
Provenance and peer review Not commissioned; externally peer reviewed.
Supplemental material This content has been supplied by the author(s). It has not been vetted by BMJ Publishing Group Limited (BMJ) and may not have been peer-reviewed. Any opinions or recommendations discussed are solely those of the author(s) and are not endorsed by BMJ. BMJ disclaims all liability and responsibility arising from any reliance placed on the content. Where the content includes any translated material, BMJ does not warrant the accuracy and reliability of the translations (including but not limited to local regulations, clinical guidelines, terminology, drug names and drug dosages), and is not responsible for any error and/or omissions arising from translation and adaptation or otherwise.