Article Text

Abstract
Background Although immune checkpoint inhibitors have been a breakthrough in clinical oncology, these therapies fail to produce durable responses in a significant fraction of patients. This lack of long-term efficacy may be due to a poor pre-existing network linking innate and adaptive immunity. Here, we present an antisense oligonucleotide (ASO)-based strategy that dually targets toll-like receptor 9 (TLR9) and programmed cell death ligand 1 (PD-L1), aiming to overcome resistance to anti-PD-L1 monoclonal therapy.
Methods We designed a high-affinity immunomodulatory IM-TLR9:PD-L1-ASO antisense oligonucleotide (hereafter, IM-T9P1-ASO) targeting mouse PD-L1 messenger RNA and activating TLR9. Then, we performed in vitro and in vivo studies to validate the IM-T9P1-ASO activity, efficacy, and biological effects in tumors and draining lymph nodes. We also performed intravital imaging to study IM-T9P1-ASO pharmacokinetics in the tumor.
Results IM-T9P1-ASO therapy, unlike PD-L1 antibody therapy, results in durable antitumor responses in multiple mouse cancer models. Mechanistically, IM-T9P1-ASO activates a state of tumor-associated dendritic cells (DCs), referred to here as DC3s, which have potent antitumor potential but express the PD-L1 checkpoint. IM-T9P1-ASO has two roles: it triggers the expansion of DC3s by engaging with TLR9 and downregulates PD-L1, thereby unleashing the antitumor functions of DC3s. This dual action leads to tumor rejection by T cells. The antitumor efficacy of IM-T9P1-ASO depends on the antitumor cytokine interleukin-12 (IL-12), produced by DC3s, and Batf3, a transcription factor required for DC development.
Conclusions By simultaneously targeting TLR9 and PD-L1, IM-T9P1-ASO amplifies antitumor responses via DC activation, leading to sustained therapeutic efficacy in mice. By highlighting differences and similarities between mouse and human DCs, this study could serve to develop similar therapeutic strategies for patients with cancer.
- immunotherapy
- immune checkpoint inhibitors
- combined modality therapy
- dendritic cells
Data availability statement
All data relevant to the study are included in the article or uploaded as supplementary information.
This is an open access article distributed in accordance with the Creative Commons Attribution Non Commercial (CC BY-NC 4.0) license, which permits others to distribute, remix, adapt, build upon this work non-commercially, and license their derivative works on different terms, provided the original work is properly cited, appropriate credit is given, any changes made indicated, and the use is non-commercial. See http://creativecommons.org/licenses/by-nc/4.0/.
Statistics from Altmetric.com
WHAT IS ALREADY KNOWN ON THIS TOPIC
A state of intratumoral dendritic cells (DCs), referred here to as DC3s, can efficiently promote antitumor T-cell responses, but also express immunoregulatory molecules such as programmed cell death ligand 1 (PD-L1). Monoclonal antibodies targeting PD-L1, or its ligand programmed cell death 1 (PD-1), have transformed cancer treatment, but control cancer only in a minority of patients.
WHAT THIS STUDY ADDS
Insufficient activation of DC3s is linked to tumor resistance to PD-L1 targeting. However, the immunomodulatory antisense oligonucleotide IM-T9P1-ASO can simultaneously trigger toll-like receptor 9 (TLR9) signaling and downregulate PD-L1 expression in DC3s, overcoming treatment resistance and achieving an effective and durable antitumor response.
HOW THIS STUDY AFFECT RESEARCH, PRACTICE OR POLICY
Despite differences in TLR9 expression on human and murine DC3s, this study shows important mechanisms in DC activation to overcome resistance to PD-L1 monoclonal antibodies, thus providing a roadmap for the application of these findings to the treatment of human cancer.
Background
Blocking immune checkpoints has transformed cancer treatment, demonstrating unprecedented responses in patients with several types of metastatic tumors that were otherwise refractory to available treatment options.1–3 Monoclonal antibodies that target programmed cell death 1 (PD-1) or its ligand, programmed cell death ligand 1 (PD-L1), are the most widely used immune checkpoint inhibitors (ICIs). These drugs can inhibit immune-suppressive signals and reinstate cancer immunosurveillance. However, despite the early clinical success, progress has been thwarted by both intrinsic and acquired resistance to treatment, with only a minority of patients showing durable responses.4 Furthermore, the efficacy of PD-L1 blockade varies between cancer types and individuals, and PD-1/PD-L1 expression within the tumor is not a clear predictor of response.5
In addition to an incomplete understanding of the mechanisms that contribute to treatment efficacy or resistance, the use of blocking antibodies targeting the PD-1/PD-L1 axis is limited because they can be internalized by intratumoral cells, such as macrophages,6 7 thereby reducing antibody bioavailability and consequently the efficacy of treatment. Thus, other approaches are being explored to overcome these challenges and develop more effective therapeutic modalities targeting the PD-1/PD-L1 axis.
The clinical success of PD-1/PD-L1 blockade likely relies on the activation of a network of cellular and molecular processes, leading to the activation of antitumor T cells. PD-L1 can be expressed by different immune cells, including some intratumoral macrophages and dendritic cells (DCs), as well as tumor cells,8 all of which can influence the functions of PD-1+ T cells. Although blocking the PD-1/PD-L1 axis is associated with CD8+ T-cell reinvigoration,9 intratumoral DCs, including those expressing PD-L1, appear to be essential for promoting effective treatment-induced antitumor T-cell responses.10 11
Despite being highly conserved between mice and humans,12 tumor-infiltrating DCs are a sparse and heterogeneous population, which can be divided into plasmacytoid DC (pDC), known to produce type I interferons (IFNs), and conventional DCs (cDC). The latter can be further categorized into three transcriptionally distinct states: cDC1s, which can cross-present antigens to CD8+ T cells, cDC2s, which are able to activate CD4+ helper T cells and, to some extent, CD8+ T cells, and DC3s, which express high levels of T-cell stimulatory genes, including CD80, CD86, major histocompatibility complex (MHC)-II and interleukin (IL)-12, making them crucial mediators in T cell-mediated antitumor immunity and for successful cancer immunotherapy.10 12 13
Tumor-associated DC3s were initially identified in lung adenocarcinoma14 and have been subsequently found in many cancer types. They have also been attributed different names, including LAMP3+ DC,15 mregDC16 and CCR7+ DC17; however, all describe the same cellular state.12 The chemokine receptor CCR7 can guide DCs to lymph nodes via lymphatic vessels to traffic tumor antigens and prime tumor-specific CD8+ T cells,18 and is expressed by DC3s. However, at least some of these cells remain within tumors, where they can promote antitumor immunity by supporting incoming T cells with survival signals13 and enabling them to perform their effector functions.10 Interestingly, DC3s also express immunomodulatory factors, such as the immune checkpoint molecule PD-L1, which may limit their antitumor activity.16 19 20
In light of the advances in understanding the mechanisms of resistance to anti-PD-1/PD-L1 therapies, we hypothesized that developing drugs that overcome the barriers to successful inhibition of the PD-1/PD-L1 axis while concurrently licensing potent DC responses could be a powerful means to induce durable antitumor immunity. In this context, we considered Gapmer-locked nucleic acid (LNA) antisense oligonucleotides (ASOs) for several reasons. First, their high-affinity ASOs recruit the cellular enzyme RNase H upon binding to the target pre-messenger RNA (mRNA), allowing for efficient degradation of the latter.21 Second, ASOs achieve specific target knockdown of all types of proteins (eg, intracellular, secreted, surface),22 making them possibly relevant to treat a wide range of diseases. For example, the combination of a CD39-targeting ASO with an anti-PD-1 monoclonal antibody (mAb) improves antitumor responses in preclinical models.23 Third, due to their DNA-based chemical structure, extracellular oligonucleotides such as ASOs can mimic microbial infections and elicit immune stimulation by activating pattern recognition receptors (PRRs). For instance, toll-like receptor 9 (TLR9) is a PRR expressed by different types of immune cells including DCs and is activated by extracellular DNA, especially DNA-containing unmethylated cytosine-phosphate-guanine (CpG) motifs frequently present in bacterial DNA.24
In this study, we sought to overcome the limited therapeutic efficacy of anti-PD-1/PD-L1 mAb by using an ASO-based therapeutic strategy with the dual capacity to trigger DC activation via TLR9 engagement and control of PD-L1 expression by these cells.
Methods
Study design
This study was designed to identify combinatorial treatment strategies to overcome resistance to PD-L1 mAb treatment and lead to durable antitumor responses revealing critical elements driving long-term immunity. To this aim, we treated tumor-bearing wild-type (WT) or transgenic mice with IM-T9P1-ASO and typically measured tumor growth up to 3 months post-tumor inoculation. As controls, we used a non-targeting ASO (Ctr-ASO) and evaluated CpG, PD-L1-ASO, and PD-L1-mAb in comparison to IM-T9P1-ASO. To validate IM-T9P1-ASO activity, we performed in vitro studies with cell lines and bone marrow-derived DCs and assessed PD-L1 downregulation and DC activation by flow cytometry. To understand the mechanisms behind IM-T9P1-ASO-mediated antitumor immunity, we analyzed tumors and draining lymph nodes (dLNs) shortly after treatment (between days 2 and 8) by flow cytometry. We also performed intravital imaging to examine IM-T9P1-ASO biodistribution and activity in the tumor.
Antisense oligonucleotides
Using the mouse Cd274 mRNA as basis (NM_021893.3), we identified a Cd274-specific ASO with a length of 15 nucleotides. The basic sequence CTTACGTCTCCTCGA contains two CpG motifs which have been described to have the potential to activate TLR9 when Cs are not methylated. In order to generate a high-affinity ASO, we modified the flanks with LNAs resulting in the sequence+mC+T+TACGTCTCCT+mC+G+A (IM-T9P1-ASO, mC=5-methyl C), still containing one CpG motif without a methylated C. The following PD-L1-ASO sequence was used to target PD-L1 downregulation in the absence of TLR9 activation +G*+T*+T*G*A*T*T*T*T*G*C*G*G*+T*+A*+T, and a control oligonucleotide was used in all experiments+mC+G+TTTAGGCTATGTA+mC+T+T (Ctr-ASO). All internucleotide linkages in IM-T9P1-ASO, PD-L1-ASO, and Ctr-ASO are phosphorothioates. The sequence alignment of human with mouse CD274 mRNA (CLUSTAL multiple sequence alignments by MUSCLE (3.8)) shows an identity of 69,22%.
Cell lines
MC38, MC38-H2B-mApple10 and D4M3.A (kindly provided by David E. Fisher and T. Mempel from MGH, Boston, USA) were cultured in Dulbecco's Modified Eagle Medium (DMEM, Gibco) with 10% of heat-inactivated fetal bovine serum (FBS, Gibco)+1% penicillin/streptomycin (P/S, Gibco). EMT6 murine breast cancer cells were cultured in DMEM with 10% FBS+1% P/S+0.5% Ciproxin+0.1% β-mercaptoethanol. MOC22 (purchased from Kerafast, Boston, USA) were cultured in Iscove's Modified Dulbecco's Medium (IMDM)/F12 (2:1) + 5% FBS + 1% P/S + human Epidermal Growth Factor (hEGF) (Millipore, 5 ng/mL) + hydrocortisone (Sigma, 40 ng/mL) + insulin (Sigma, 5 µg/mL). Cells were routinely tested and resulted negative for Mycoplasma.
Bone marrow-derived dendritic cells
Bone-marrow cells from mice were isolated by flushing femurs and tibiae of 8–11 weeks old WT C57BL/6 or transgenic mice. Cells were strained through a 70 µm filter and centrifuged before resuspension in 1×red blood cell (RBC) lysis buffer (eBioscience) for 1 min at room temperature (RT). Cells were washed with phosphate buffered saline (PBS) supplemented with FBS and plated in non-treated tissue culture dishes in RPMI 1640 with GlutaMAX (Gibco)+10% FBS + 1% P/S + 50 µM 2-mercaptoethanol. To generate mature monocyte-derived dendritic cells (moDCs), bone marrow-derived dendritic cells (BMDCs) were cultured with murine granulocyte-macrophage colony-stimulating factor (GM-CSF, PeproTech, 100 ng/mL). IL-4 (PeproTech, 20 ng/mL) and IFN-γ (PeproTech, 100 ng/mL) were added to moDCs on day 3 and 7, respectively, to boost moDC activation. To generate immature cDCs (FL-cDCs), BMDCs were cultured in presence of Flt-3L (PeproTech, 100 ng/mL). Both moDCs and cDCs were analyzed or used in T-cell co-culture assay at day 9 post-isolation as described below. At day 9, F4/80+ macrophages represented a minority of both DC preparations, ranging from 7% to 15% in moDC and FL-cDC, respectively. DCs (defined as F4/80–CD11c+) were the majority, precisely 47% and 78% in moDC and FL-cDC, respectively.
T cells
OT-I CD8+ T cells were isolated from the spleen of 7-week-old female C57BL/6-Tg(TcraTcrb)1100Mjb/J (OT-I) mice using the EasySep CD8+ T-cell isolation kits (STEMCELL), according to the manufacturer’s instructions, leading to a CD8+ T-cell purity of around 96%. T cells were cultured in RPMI 1640 medium supplemented with 10% FBS, L-glutamine, P/S, β-mercaptoethanol (55 µM, Gibco), non-essential amino acids (0.1 mM, Sigma) and sodium pyruvate (1 mM, Gibco) and IL-2 (50 ng/mL, PeproTech).
In vitro stimulation of BMDCs with IM-T9P1-ASO
BMDCs (moDCs and FL-cDCs) generated as described above were seeded (2.5×10⁵ and 5×10⁵ cells/mL, respectively) in a flat bottom 96-well plate on day 6 after isolation. Control or IM-T9P1-ASO (20 µM) was added on days 6 and 8 after isolation. To assess intracellular IL-12 levels, Brefeldin (BioLegend, 1 µg/mL) was added on day 8, 12 hours before flow cytometry staining and analyses. Of note, flow cytometry analyses of cells exposed to control or IM-T9P1-ASO were performed by specifically gating on DCs (F4/80–CD11c+).
Co-culture of BMDCs with OVA-specific OTI
For in vitro T-cell activation assay, moDCs were prepared and treated with control or IM-T9P1-ASO (20 µM) on days 6 and 8 after isolation as described above. Endofit OVA (Invivogen, 100 µg/mL) was added to each well on day 8. OT-I T cells were then stained with CellTrace Violet (Thermo Fisher) according to manufacturer’s protocols; 1×10⁵ cells were added to each well containing mature moDCs (day 9 post-isolation) and cultured for 3 days. T-cell proliferation was assessed by flow cytometry analysis, and the expansion index was calculated using the dedicated tool provided by FlowJo. Granzyme B secretion in the conditioned media was measured with the respective mouse ELISA kit (Thermo Fisher).
TLR reporter assay
The toll-like receptor (TLR) activation profile was assessed by InvivoGen using their PRR Ligand Screening platform service (https://www.invivogen.com/custom-tlr-screening) and blind-coded ASO samples (20 µM). A recombinant HEK-293 cell line not expressing any PRR gene but only the reporter gene (i.e., the inducible NF-kB reporter gene SEAP) was used as a negative control. Poly I:C, R848, TL8-506 and ODN 1826 were used (all at 1 µg/mL) as a positive control to stimulate the TLR3, TLR7, TLR8 and TLR9 reporter cell lines, respectively. TLR9 activation was further confirmed and evaluated in-house using the HEK-Blue mTLR9 cells and HEK-Blue detection system (InvivoGen) following manufacturer’s protocols. Specifically, antisense oligos were added at the indicated concentrations and incubated with the reporter cells for 20 min or 15 hours, followed by measurement of SEAP production with a spectrophotometer (read at 650 nm).
MC38 PD-L1 KO generation
Generation of PD-L1-KO MC38 cells was done using Alt-R CRISPR-Cas9 System (Integrated DNA Technologies, IDT), which consists of the cationic lipid delivery of CRISPR ribonucleoprotein complexes into mammalian cells. Preparation of ribunucleoprotein particles (rRNPs) was done by mixing and incubating equal moles (800 pmol) of tracrRNA (IDT) and Cd274 crRNA (Item # Mm.Cas9.CD274 crRNA (Item # Mm.Cas9.CD274.AA, IDT) or control sgINTERGENIC_27270 (IDT) for 5 min at 95°C. A total of 320 pmol of recombinant Cas9 (Cas9-NLS, Berkeley) was added to each reaction and incubated for 20 min at RT. The SF Cell Line 4D-Nucleofector kit (Lonza) was used to deliver tracrRNA:crRNA:Cas9 complexes into 1×10⁶ MC38 cells according to the manufacturer’s protocols. Specifically, each reaction consisted of 16 µL rRNPs prepared as described above, mixed with 70 µL SF Cell Line solution and 18 µL Supplement (provided by the Lonza kit). After transferring the cell suspension into a Lonza 4D-Nucleofector cuvette, the EN-138 program was used for electroporation. Lack of PD-L1 expression was verified 2 days later by flow cytometry after staining the cells with two clones (MIH5 and 10F.9G2) of PD-L1 antibodies. To ensure the generation of stable PD-L1-KO cells, MC38 cells were stained with a Pe-Cy7-conjugated PD-L1 antibody (clone MIH5, Thermo Fisher) 5 days after electroporation, and PD-L1-negative MC38 cells were FACS-sorted using an FACSMelody Cell Sorter (BD Biosciences).
Mice
C57BL/6N, C57BL/6J, Balb/c, IL-12p40-IRES-eYFP (B6.129-Il12btm1.1Lky /J, JAX 006412), IL-12p40-KO (B6.129S1-Il12btm1Jm/J, JAX 002693) and C57BL/6-Tg(TcraTcrb)1100Mjb/J OT-I TCR transgenic mice were bred in-house either at the University Hospital of Basel (Switzerland), Agora Cancer Research Center (Lausanne, Switzerland) or Massachusetts General Hospital (Boston, USA). In case of unavailability, mice were also obtained from Janvier Labs (France) or Charles River (France) and Jackson Laboratories (USA). PD-L1 KO (B6/JCD274<em(ex3HindIII)JZvB>) were kindly provided by Johannes vom Berg, University of Zürich (Switzerland). Batf3 KO ((B6.129S(C)-Batf3<tm1Kmm>/J) were obtained from the Jackson Laboratory, USA. IFNgR KO (B6.129S7-Ifngr1<tm1Agt>/J) was kindly provided by Daniel D. Pinschewer, University of Basel, Switzerland. TLR9-KO mice (C57BL/6-Tlr9tm1Aki) were kindly provided by Maries van den Broek, University of Zürich (Switzerland), and Michel Gilliet, University of Lausanne (Switzerland). Each experiment included age and sex-matched littermates from 8 to 13 weeks of age and animals were housed under specific pathogen-free conditions.
Tumor models
WT or transgenic mice in the C57BL/6 background were implanted subcutaneously into the right flank with 0.5–2×10⁶ MC38 colorectal carcinoma or 1×10⁶ D4M.3A melanoma cells. EMT6 murine breast cancer cells (0.25×10⁶) were injected into the right mammary gland of female Balb/c mice. All cells were suspended in PBS or phenol red-free DMEM without additives. MOC22 squamous cell carcinoma (1×10⁶) were resuspended in PBS and injected by tail vein injection. Cells were routinely tested for Mycoplasma contamination before treatment. All tumor models were allowed to grow at least for 1 week before therapy and, right before treatment initiation, mice were stratified into experimental groups with comparable average tumor size. Tumor volume was calculated according to the formula: D/2×d×d, with ‘D’ being the longest tumor diameter and ‘d’ the shorter tumor diameter in mm. Mice were monitored and scored three times per week. In tumor growth and survival experiments, mice were sacrificed when reaching the humane endpoints described in the authorized animal protocol of the respective laboratory, which were the following: tumor size exceeding 1000 (Agora), 1500 (University of Basel) or 2000 (MGH) mm3 or the longest diameter exceeding 1.5 (Agora and University of Basel) or 2 cm (MGH). Tumor-bearing mice developing ulcerations were excluded from the studies. In survival experiments, surviving mice were either tumor-free or tumor-bearing mice that did not reach the termination criteria described above.
Therapy treatments, cytokine, and cell modulation
Mice harboring tumors that reached around 50–100 mm3 were treated intraperitoneally (i.p.) with eight doses of 200 µL of PBS suspended solutions of IM-T9P1-ASO at 20 mg/kg, non-targeting ASO (Ctr-ASO) at 20 mg/kg (both daily from days 14–18, and days 21, 23, and 25 for MC38 tumor-bearing mice; and daily from days 7–11, and days 14, 16 and 18 for EMT6 tumor-bearing mice), or left untreated. For anti-PD-L1 mAb treatment, mice were injected i.p. with 10 mg/kg of anti-PD-L1 10F-9G2 antibody (Bio X Cell) on days 14, 16, 18, 21, 23 and, 25 in the MC38 colorectal model and days 7, 9, 11, 14, 16 and 18 in the EMT6 breast cancer model. For CpG-ODN 1826, mice were treated i.p. with 0.4 mg/kg of GpG-ODN 1826 at the indicated schedule (from day 14 to 18, day 21, day 23 and day 25). IL-12p40 neutralization was performed i.p. using 500 µg of anti-IL-12p40 depletion antibody (clone 17.8, Bio X Cell) daily during the first week of IM-T9P1-ASO treatment (day 14–18) and twice during the second week of treatment (day 21 and day 24). pDC depletion was performed by administering i.p. 500 µg of anti-CD317 (PDCA-1, clone 927) the day before IM-T9P1-ASO treatment (day 13) followed by 250 µg of anti-CD317 on days 16, 18, 21, 23 and, 25. For combination therapy of IM-T9P1-ASO with blocking antibodies, mice received either 12.5 mg/kg of anti-PD-1 (clone RPM1-14) or 10 mg/kg of anti-cytotoxic T-lymphocytes-associated protein 4 (CTLA-4, clone 9D9) alone or in combination with 20 mg/kg IM-T9P1-ASO when tumor size was approximately 100–200 mm3.
In vivo tumor rechallenge
Long-term tumor-free survival mice were implanted with the same tumor entity in the contralateral flank, either 500,000 MC38 or 250,000 EMT6 cells, after 60 days after the primary tumor rejection. Naive C57BL/6 or Balb/c mice were inoculated with MC38 or EMT6 cells, respectively, alongside the rechallenged mice, and tumor growth was monitored until the terminal endpoint (1500 mm3).
Phenotypic characterization of tumor-infiltrating and lymph node cells by multiparameter flow cytometry
MC38 tumor-bearing mice were sacrificed at indicated time points. Tumors were collected, weighed and processed using razor blades. Tumor tissue was then digested using collagenase IV (Worthington), accutase (PAA), hyaluronidase (Sigma), DNAse type IV (Sigma), and Brefeldin A (1000× from BioLegend, at 1:1000) for 30 min at 37°C, with constant shaking. The tumor suspension was filtered using a cell strainer (100 µM). Draining and non-draining lymph nodes (ndLNs) were cut into small pieces using surgical scissors prior to digestion using Collagenase D (1 mg/mL), DNAse I (40 µg/mL), 2% FBS and Brefeldin A (1000× from BioLegend, at 1:1000) during 30 min at 37°C, with constant shaking. Lymph node suspensions were filtered and mashed through a 70 µM strainer using the end of a 1 mL syringe. Precision counting beads (BioLegend) were added before the staining to quantify the number of cells per gram of tumor or the total amount of cells within lymph nodes. Single-cell suspensions derived from tumors and lymph nodes were blocked with rat anti-mouse FcγIII/II receptor (CD16/CD32) blocking antibodies (‘Fc-Block’), and stained with live/dead cell-exclusion dye (Zombie UV dye; BioLegend). The cells were then stained with fluorophore-conjugated extracellular antibodies, washed, and resuspended in fluorescence-activated cell sorting (FACS) buffer containing PBS, EDTA, sodium azide and fetal calf serum (FCS). For intracellular and intranuclear staining, cells were fixed and permeabilized using FoxP3/transcription factor staining buffer set (eBioscience) before the incubation with antibodies directed against intracellular antigens. Cell populations were analyzed with BD Fortessa and Cytek Aurora.
Tumor-derived cell types were identified using the following combinations of cell markers:
Macrophages: CD45+ F4/80+.
Total DCs: CD45+ F4/80– MHC-II+ CD11c+.
cDC1: CD45+ F4/80– MHC-II+ CD11c+ CCR7–XCR1+ or CD45+ F4/80– MHC-II+ CD11c+ CCR7– CD103+.
cDC2: CD45+ F4/80– MHC-II+ CD11c+ CCR7– XCR1– CD11b+ or CD45+ F4/80– MHC+ CD11c+ CCR7– XCR1– SIRPα+.
DC3: CD45+ F4/80– MHC-II+ CD11c+ CCR7+.
pDC: CD45+ F4/80– MHC-II+ CD11c+ SiglecH+.
CD8+ T cells: CD45+ F4/80– CD11c– CD8+.
CD4+ T cells: CD45+ F4/80– CD4+.
Regulatory T cells (Tregs): CD45+ F4/80– CD4+ CD25+ FOXP3+.
B cells: CD45+ F4/80– CD4– CD8– CD19+.
Endothelial cells (ECs): CD45– CD31+.
In vivo mRNA measure by PrimeFlow analysis
Tumor-cell suspensions were prepared as described above. Antibody staining and Cd274 mRNA detection by flow cytometry were done using the PrimeFlow RNA assay (Thermo Fisher) following the manufacturer’s protocol (procedure validated for 96-well plates). Cd274 (assay ID: VB1-17218-PF) and AF647 were used as Target Probe and Label Probe, respectively, diluted 1:20 and 1:100 in their respective PrimeFlow RNA diluents.
FTY720 treatment
C57BL/6N mice were implanted in the right flank with 500,000 MC38 tumor cells subcutaneously and randomized into groups of similar tumor volume between 50 and 100 mm3. Mice were treated daily with 1.25 mg/kg of FTY720 (Cayman Chemical) i.p. throughout the duration of the experiment. FTY720 injections started the day before IM-T9P1-ASO or Ctr-ASO treatment.
Intravital imaging
IL-12p40 reporter (IL-12p40-eYFP) mice were anesthetized and dorsal skin-fold window chambers were installed as previously described.10 Forty-eight hours after window implantation, MC38-H2B-mApple cells (2×10⁶ in 20 µL) were injected into the fascia layer. One week after cell injection and 10 min before imaging, mice were injected intravenously with Pacific Blue-dextran (60 µL of a 4 mg/mL solution) for labeling of the vasculature (within 1 hour after injection) and macrophages (which take up the dye and are consequently labeled within 1 day after injection). The PacBlue-dextran solution was generated by mixing 10 mg of 500,000 MW dextran (Thermo Fisher) with a 10-fold molar excess of Pacific Blue Succinimidyl Ester (Thermo Fisher) for 2 hours in slight agitation at RT and overnight at 4°C, followed by removal of unconjugated dye by washing three times with PBS and Amicon (Sigma) concentrators. AF647-conjugated IM-T9P1-ASO was delivered at 20 mg/kg via a 30-gauge catheter inserted in the tail vein of the anesthetized mouse (2% isoflurane in oxygen) during imaging. Anesthetized mice were kept on a heating pad kept at 37°C and imaged using an Olympus FluoView FV1000MPE confocal imaging system (Olympus America). A 2× air objective XL FLUOR 2×/340 (NA 0.14; Olympus America) was used to select regions near tumor margins and tumor vasculature. Higher magnification Z stack images were acquired using a XLUMPLFL 20× water immersion objective (NA 0.95; Olympus America) with 1.5× digital zoom. Sequential scanning with 405, 473, 559, and 635 nm lasers was performed using voltage and power settings that were optimized prior to time-lapse acquisition. Samples were excited using 405 nm, 473 nm, 559 nm and/or 633 nm diode lasers with a multiband DM405/473/559/635 nm dichroic excitation filter, and emission light separated using SDM473, SDM560, and SDM 640 dichroic mirrors in combination with emission filters (BA430-455, BA490-540, BA575-620, BA655-755) from Olympus America.
Analyses of CD274 and TLR expression in human cancers from published data sets
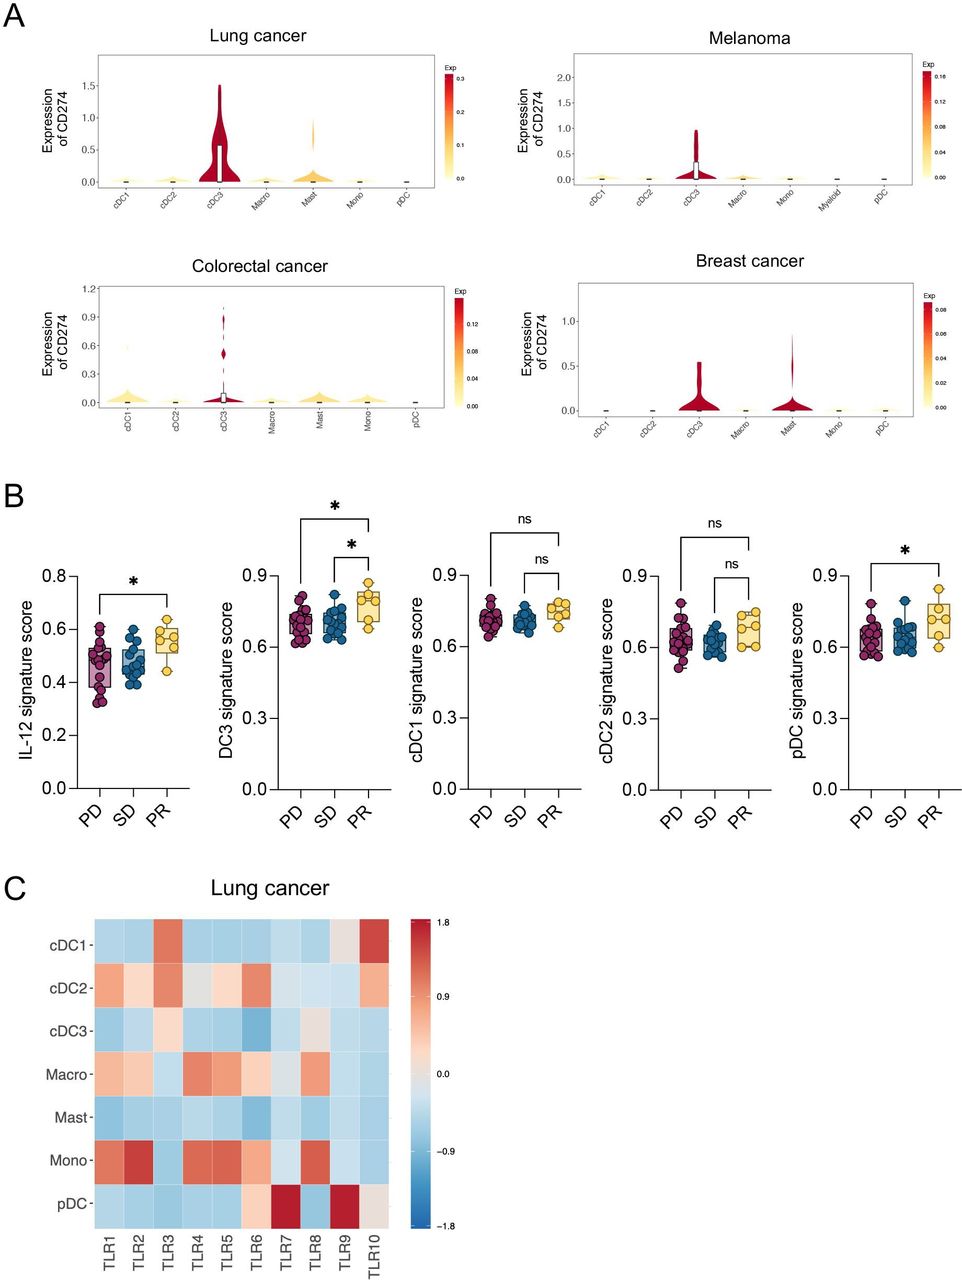
Data showing the expression of CD274 and TLRs across different myeloid cells were obtained using an interactive web-based tool (http://panmyeloid.cancer-pku.cn) for visualization of human pan-cancer single-cell data.19 Specifically, we explored data sets of lung,14 25 melanoma,26 colorectal27 and breast28 cancers. Of note, we focused our analyses on cells of the tumor microenvironment, excluding cells detected in other tissues (eg, peripheral blood, normal tissue, lymph nodes).
Bioinformatic analysis of published gene expression data
The DC3, cDC1, cDC2 and pDC gene signatures were derived from,12 and IL-12 signature was generated using CytoSig (https://cytosig.ccr.cancer.gov/). CytoSig is a web platform that predicts response signatures of the selected cytokines based on a sample’s gene expression profile under development in National Cancer Institute (NCI).29 The analysis was performed as reported by Kirchhammer et al.30 In detail, we reanalyzed the data set by,31 consisting of bulk mRNA sequencing data of melanoma tumors treated with nivolumab (anti-PD-1). The patients were stratified according to their response to the therapy as progressive disease, stable disease, partial response and complete response (CR). Complete responders were excluded from the analysis for two reasons: (1) the sample size (n=3), and (2) the signature of CD8 T and B cells, which usually correlates with good prognosis, showed no enrichment in CR. We retrieved the data from the Gene Expression Omnibus under accession number GSE91061. We analyzed only patients with reported responses to therapy and both pretreatment and post-treatment samples. EdgeR was used to normalize counts by library size. Immune cell signature score was calculated as described by.32 All transcripts for each sample were ordered by decreasing expression, and the signature score was defined as (1−mean rank of transcripts in signature)/(number of all transcripts). Therefore, high signature scores indicate enrichment of signature gene expression.
Statistical analysis
All statistical analyses were performed using GraphPad Prism software. Results were shown as mean±SEM. Student’s two-tailed t-test were done to compare two groups. One-way analysis of variance (ANOVA) was used to compare multiple groups. Two-way ANOVA was used for comparisons between multiple groups and variables (eg, time). The Mantel-Cox log-rank test was used for survival analyses.
P values>0.05 were considered not significant; p values<0.05 were considered significant. *p value<0.05, **p value<0.01, ***p value<0.001, ****p value<0.0001.
Results
PD-L1 antibody treatment triggers insufficient DC and T-cell antitumor immunity in the MC38 tumor model
Durable responses to ICIs are observed only in a minority of patients.33 To mirror this clinical situation, we treated mice bearing established subcutaneous colorectal MC38 tumors or orthotopic breast EMT-6 tumors with anti-PD-L1 mAb. We observed a delay in MC38 tumor growth in anti-PD-L1-treated mice; however, none (0/8) of the mice showed durable tumor control (figure 1A,B, online supplemental figure 1A), making this experimental set-up a poor responder model to anti-PD-L1-mAb treatment. In parallel, the same treatment triggered long-term survival in 28% (5/18) of EMT6 tumor-bearing mice (online supplemental figure 1B), indicating that durable responses could be seen in this model, but only in a minority of mice.
Supplemental material
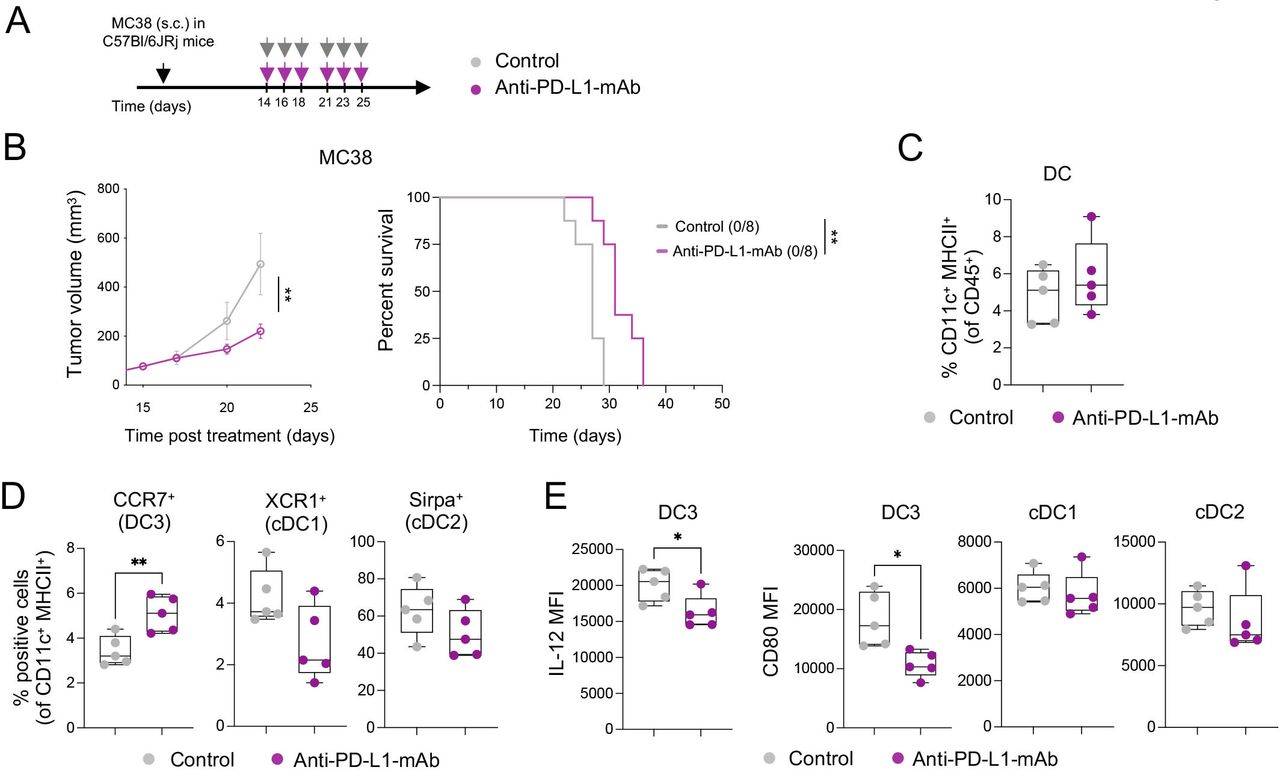
Anti-PD-L1-mAb does not stimulate sufficient DC3 and T-cell activation in MC38 tumors. (A) Diagram of MC38 tumor-bearing mice receiving anti-PD-L1-mAb. (B) Average tumor growth (left) and Kaplan-Meier survival curve (right) of MC38 tumor-bearing mice treated with anti-PD-L1-mAb or control (n=8 mice/condition). The number of tumor-free mice is indicated in brackets. (C and D) Flow cytometry analysis of MC38 tumors after 4 days of treatment showing proportions of total DCs (C) and DC subsets (D) (n=5 mice/condition). (E) Flow cytometry analysis of IL-12 and CD80 expression (mean fluorescence intensity, MFI) in DC subsets in MC38 tumors 4 days after treatment (n=5 mice/condition). Data are presented as mean±SEM. For comparisons between multiple groups and variables, two-way analysis of variance was used. For survival analysis, the Mantel-Cox log-rank was used. For comparisons between two groups, Student’s two-tailed t-test was used. *p<0.05, **p<0.01, ***p<0.001, ****p<0.0001. cDC, conventional DC; DC, dendritic cell; IL, interleukin; mAb, monoclonal antibody; MHC, major histocompatibility complex; PD-L1, programmed cell death ligand 1; s.c., subcutaneously.
Due to the critical role of intratumoral PD-L1-expressing DCs in regulating responses to ICIs,34 we investigated tumor immune infiltrates in MC38 tumor-bearing mice by multiparameter flow cytometry 4 days after the start of treatment (online supplemental figure 1C). We found comparable frequencies of total intratumoral CD11c+ MHC-II+ DCs in control and anti-PD-L1-treated mice (figure 1C). The proportion of CCR7+ DCs (hereafter DC3s) was higher in anti-PD-L1-treated tumors compared with controls, while that of XCR1+ DCs (hereafter DC1s, also defined by CD103 expression) and CD11b+ DCs (hereafter cDC2s, also defined by SIRPα expression) was not significantly affected and potentially slightly reduced (figure 1D). Examining the maturation status of intratumoral DCs in anti-PD-L1-treated mice, we detected a decrease in IL-12 and CD80 expression in DC3s, but not in cDC1s and cDC2s (figure 1E). Like in the tumor, we found increased CCR7+ DCs (online supplemental figure 1D) in the tumor-dLN, as well as CD80 downregulation on CCR7+ DCs and macrophages in response to anti-PD-L1 (online supplemental figure 1E).
In line with previous data,3 these findings suggest a reduced capacity of antigen-presenting cells (APCs) to activate T cells through co-stimulatory molecules and cytokine secretion after anti-PD-L1 mAb therapy, reflected in the absence of intratumoral CD8+ T-cell expansion and activation, assessed by CD25 expression (online supplemental figure 1F). While insufficient activation may dampen tumor-specific T-cell responses and prevent durable antitumor immunity, we hypothesized that the therapeutic efficacy of targeting PD-1/PD-L1 might be amplified by strategies that simultaneously promote DC activation.
IM-T9P1-ASO downregulates PD-L1 and stimulates DC maturation in vitro
In this endeavor, we aimed to target TLR9, which can induce innate and adaptive immune responses35 and is expressed by myeloid cells in MC38 tumors, particularly by cDC1s and DC3s (online supplemental figure 2A). To this end, we designed an immunomodulatory IM-TLR9:PD-L1-ASO antisense oligonucleotide (hereafter, IM-T9P1-ASO) able to trigger TLR9 stimulation and downregulate Cd274, encoding the mouse PD-L1, in the same target cell.
To evaluate the ability of IM-T9P1-ASO to activate cells via TLR9, we exposed NF-kB reporter cells expressing different TLRs to IM-T9P1-ASO. We confirmed the capacity of IM-T9P1-ASO to induce NF-kB activity via TLR9 but not TLR3, TLR7 and TLR8 (online supplemental figure 2B). Importantly, a non-targeting control oligonucleotide (later Ctr-ASO) demonstrated no stimulatory activity in these assays (online supplemental figure 2B).
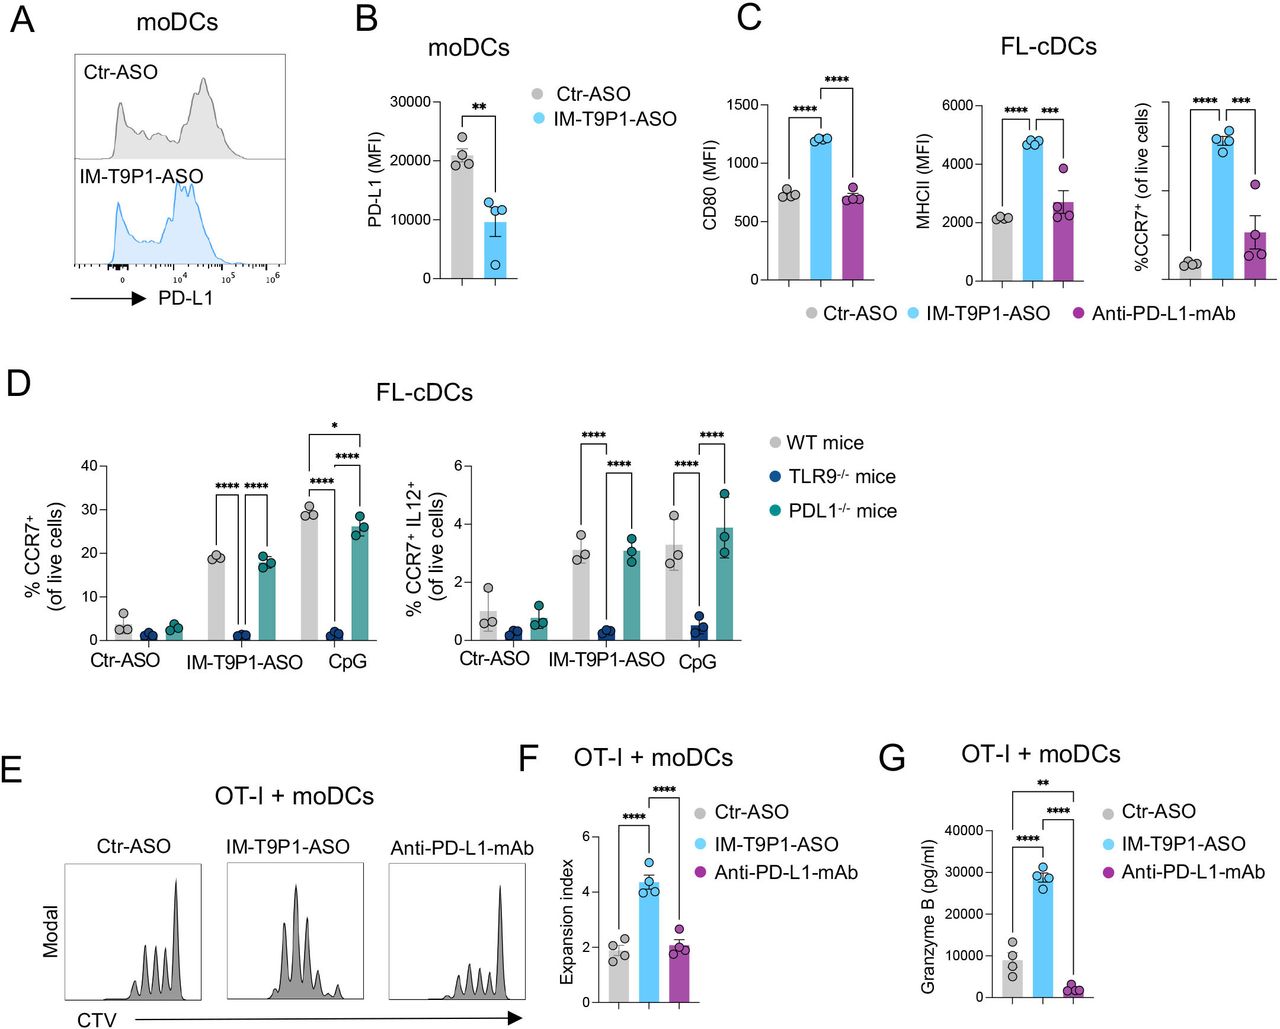
We next tested the ability of IM-T9P1-ASO to downregulate PD-L1 expression. Using two PD-L1+ cell lines we found a reduction of PD-L1 in IM-T9P1-ASO-treated cells compared with Ctr-ASO (online supplemental figure 2C and D). A similar IM-T9P1-ASO-mediated decrease of PD-L1 expression was observed with IL-4-matured and IFN-γ-matured moDCs (figure 2A,B). Finally, considering the blunted activation of intratumoral DC3s after anti-PD-L1 mAb treatment (figure 1E), we used immature Flt-3L-cultured cDC (FL-cDC) to test whether IM-T9P1-ASO treatment could stimulate a DC3 program in vitro. Using this approach, we found that immature FL-cDCs treated with IM-T9P1-ASO upregulated the expression of CD80, MHC-II and CCR7, which was in stark contrast to both Ctr-ASO and anti-PD-L1 mAb (figure 2C).

IM-T9P1-ASO stimulates in vitro DC activation and IL-12 secretion while decreasing PD-L1 expression. (A–B) Flow cytometry analysis of PD-L1 expression in in vitro-cultured moDCs exposed to Ctr-ASO or IM-T9P1-ASO (n=4 cell cultures/condition). Representative histogram plots (A) and cumulative analysis of PD-L1 MFI (B). (C–D) Flow cytometry analysis of activation markers in in vitro-cultured FL-cDCs derived from wild-type mice (C and D), or transgenic TLR9–/– and PD-L1–/– mice (D), and exposed to Ctr-ASO or IM-T9P1-ASO (n=3–4 cell cultures/condition). (E–F) Flow cytometry analysis of CD8+ OT-I cell proliferation after 3 days of culture with OVA-loaded moDCs previously exposed to the indicated agents. (E) Representative histograms showing CellTrace Violet (CTV) dilution. (F) Quantification of the data (n=4 cell cultures/condition). (G) ELISA-based quantification of granzyme B in medium conditioned by CD8+ OT-I cells treated as in (E–F). Data are presented as mean±SEM. For comparisons between two groups, Student’s two-tailed t-test was used. For comparisons between multiple groups or variables, one-way (C, F, G) or two-way (D) analysis of variance was used. *p<0.05, **p<0.01, ***p<0.001, ****p<0.0001. ASO, antisense oligonucleotides; cDC, conventional DC; CpG, cytosine-phosphate-guanine; DC, dendritic cell; IL, interleukin; mAb, monoclonal antibody; MFI, mean fluorescence intensity; MHC, major histocompatibility complex; moDCs, monocyte-derived dendritic cells; PD-L1, programmed cell death ligand 1; WT, wild-type; TLR9, toll-like receptor 9.
Loss of activity in TLR9–/– DCs demonstrated that the differentiation into a DC3-like program depended on TLR9 (figure 2D). Furthermore, treatment of immature FL-cDCs with a TLR9 stimulation oligonucleotide (CpG) showed similar effects as IM-T9P1-ASO. We also confirmed that the in vitro generation of DC3-like cells was independent of PD-L1, as immature FL-cDCs from PD-L1–/– mice produced CCR7+ IL-12+ DC3-like cells on IM-T9P1-ASO treatment (figure 2D).
DCs play a critical role in priming and regulating tumor-specific T-cell responses.18 36 37 To investigate whether DCs exposed to IM-T9P1-ASO could more efficiently present antigens and activate CD8+ T cells in vitro, SIINFEKL-specific CD8+ T cells from OT-I mice were co-cultured with Ctr-ASO or IM-T9P1-ASO-treated moDCs loaded with OVA protein. In co-culture with IM-T9P1-ASO-treated DCs, CD8+ T cells showed increased expansion and functionality, as assessed by proliferation (figure 2E,F) and production of granzyme B (figure 2G).
Altogether, these in vitro data show that ASOs can be designed to simultaneously mediate the downregulation of PD-L1 expression and induce maturation of DCs through TLR9, leading to robust T-cell activation.
IM-T9P1-ASO shows superior antitumor efficacy compared with PD-L1 mAb treatment
We used intravital imaging (online supplemental figure 3A) to assess the pharmacokinetics of fluorescently-labeled IM-T9P1-ASO (AF647-IM-T9P1-ASO) in vivo in tumor-bearing mice. We observed a rapid and homogenous diffusion of the ASO from the tumor vasculature into the tumor parenchyma (online supplemental figure 3C,D and Video 1), and accumulation into every immune and non-immune cell (online supplemental figure 3E), indicating the drug’s ability to distribute within the tumor and reach its intended target cells.
Supplemental material
Supplementary video
Treatment with IM-T9P1-ASO in different syngeneic tumor models (figure 3A) did not trigger changes in body weight, suggesting a lack of overt toxicity (online supplemental figure 3F), but potently inhibited tumor growth (figure 3B–D, online supplemental figure 3G–I), leading to increased survival (online supplemental figure 3J) and complete tumor regressions (figure 3B,C). Notably, IM-T9P1-ASO triggered durable responses in 39% (7/18) of MC38 tumor-bearing mice (compared with the 0% response rate following PD-L1 mAb treatment), and in 77% (30/39) of EMT6 tumor-bearing mice (compared with the 28% response rate following PD-L1 mAb treatment). Additionally, we observed a significant antitumor effect of IM-T9P1-ASO in the D4M.3A melanoma model (figure 3D), which is considered poorly immunogenic and unresponsive to anti-PD-1 mAb therapy.13 By contrast, treatment with either PD-L1-ASO lacking TLR9 triggering capacity (online supplemental figure 3K,L), anti-PD-L1 mAb, or TLR9 agonist CpG-ODN 1826, had minimal impact on MC38 tumor growth or survival (online supplemental figure 3M). In addition, IM-T9P1-ASO induced the formation of protective antitumor memory, as mice that survived the initial treatment remained tumor-free after a later rechallenge with the same cell line (figure 3E).
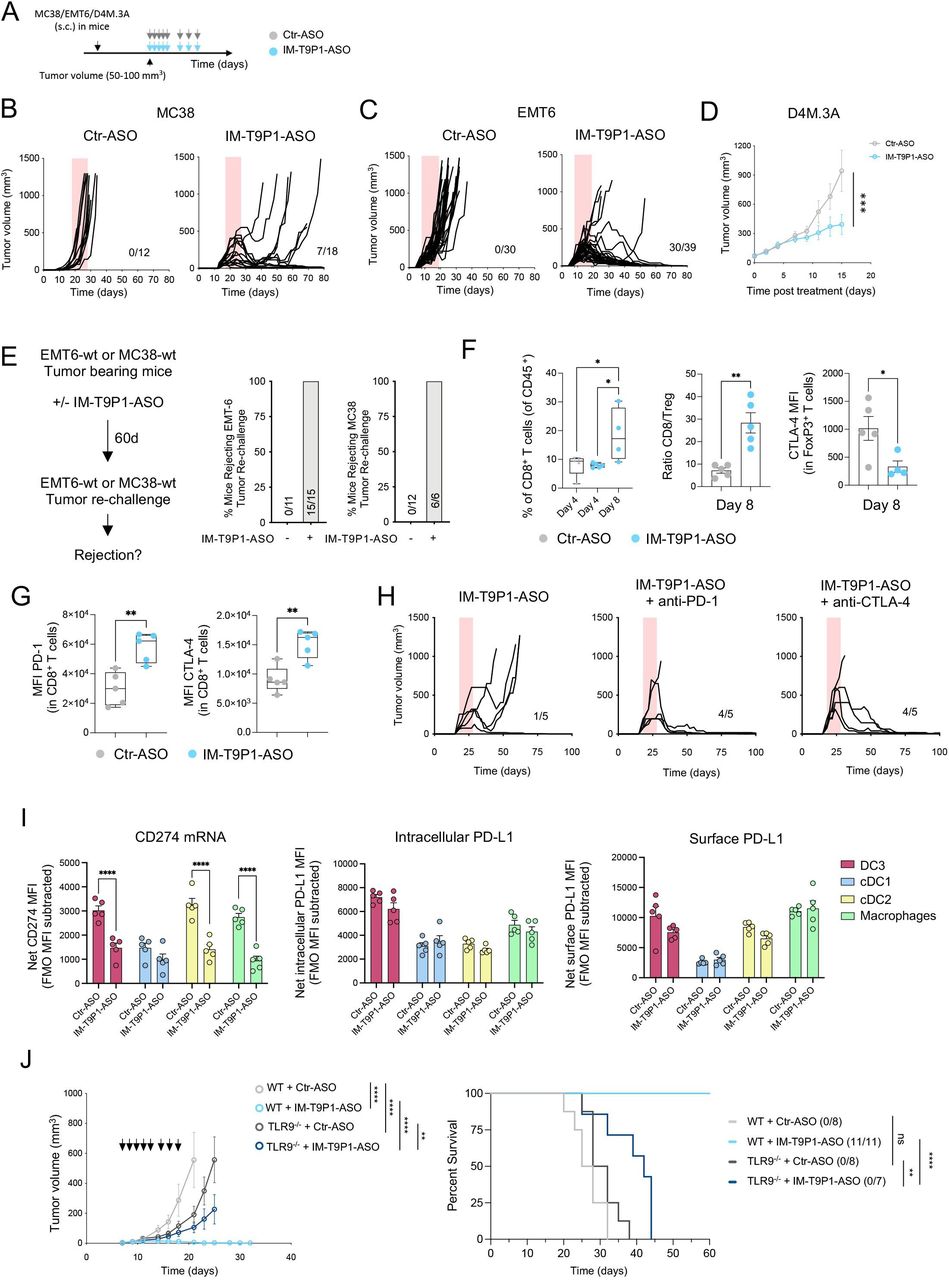
IM-T9P1-ASO therapeutic in vivo efficacy depends on both TLR9 stimulation and PD-L1 downregulation. (A) Diagram of tumor-bearing mice receiving Ctr-ASO or IM-T9P1-ASO. (B) Tumor growth of MC38 tumor-bearing mice treated with Ctr-ASO or IM-T9P1-ASO (n=12–18 mice/group). The number of tumor-free mice is shown. (C) Tumor growth of EMT6 tumor-bearing mice treated with Ctr-ASO or IM-T9P1-ASO (n=30–39 mice/group). The number of tumor-free mice is indicated. (D) Average tumor growth of D4M.3A tumor-bearing mice receiving Ctr-ASO or IM-T9P1-ASO (n=7–8 mice/group). (E) Mice cured with IM-T9P1-ASO were rechallenged with the same tumor entity in the contralateral flank. The percentage of mice rejecting the tumor engraftment is shown. Naïve mice were used as controls for tumor growth (n=6–15 mice/group). (F) Flow cytometry quantification of CD8+ T cells (left), CD8+ to FoxP3+ CD4+ T-cell ratio (middle) and CTLA-4 expression in FoxP3+ CD4+ T cells (right) in MC38 tumors at the indicated time points and therapies (n=4–5 mice/group). (G) Flow cytometry analysis of CD8+ T cells in MC38 tumors 8 days after indicated treatment (n=5 mice/group). (H) Tumor growth of MC38 tumors with treatment initiation at large tumor size (~150 mm3) with IM-T9P1-ASO alone or in combination with anti-programmed cell death protein-1 or anti-CTLA-4 mAb (n=5 mice/group). The number of tumor-free mice is shown. (I) Combined in situ hybridization and flow cytometry analysis of MC38 tumors 2 days after Ctr-ASO or IM-T9P1-ASO treatment, showing PD-L1 mRNA (left), intracellular protein (middle) and surface protein (right) expression in the indicated cell types (n=5 mice/group). (J) Average tumor growth (left) and overall survival (right) of MC38 tumor-bearing WT and TLR9–/– mice treated with Ctr-ASO or IM-T9P1-ASO (n=7–11/group). The number of tumor-free mice is indicated. Data are presented as mean±SEM. For comparisons between two groups, Student’s two-tailed t-test was used. For comparisons between multiple groups and variables, two-way analysis of variance was used. For survival analyses, the Mantel-Cox log-rank test was used. *p<0.05, **p<0.01, ***p<0.001, ****p<0.0001. ASO, antisense oligonucleotides; cDC, conventional DC; CTLA-4, cytotoxic T-lymphocytes-associated protein 4; DC, dendritic cell; FMO, fluorescence minus one; MFI, mean fluorescence intensity; mRNA, messenger RNA; PD-L1, programmed cell death ligand 1; s.c., subcutaneously; WT, wild-type; TLR9, toll-like receptor 9.
MC38-tumor bearing mice treated with IM-T9P1-ASO showed increased frequencies of CD8+ T cells and an increased CD8/Treg ratio (figure 3F), reflecting the induction of an efficient antitumor immune response.38 In addition, while FoxP3+ Tregs showed decreased CTLA-4 expression (figure 3F), we noted an increase in PD-1 and CTLA-4 expression on CD8+ T cells (figure 3G). To test whether targeting all these immune checkpoints in a combined approach may further improve antitumor responses, we treated large MC38 tumors (approximately 150 mm3) with a combination of IM-T9P1-ASO with either anti-PD-1 or anti-CLTA-4 mAb. Though tumors of this size are usually treatment refractory even to IM-T9P1-ASO, we observed profound, improved tumor control (figure 3H).
Collectively, these data show that IM-T9P1-ASO leads to long-lasting, adaptive antitumor immunity that can be further improved when combined with T cell-targeting ICIs and can have efficacy against large, established tumors in mice.
IM-T9P1-ASO efficacy depends on both TLR9 stimulation and PD-L1 downregulation
PD-L1 is expressed in both cancer and immune cells.39 To investigate whether PD-L1 blockade on tumor or host cells contributed to IM-T9P1-ASO-mediated tumor control, we generated Cd274–/– (encoding PD-L1) MC38 cells (online supplemental figure 3N), which we then implanted into WT mice. Tumor growth of Cd274–/– MC38 cells, in the presence or absence of IM-T9P1-ASO treatment, was similar to that of MC38-WT, suggesting that PD-L1 knockdown in cancer cells is not sufficient for tumor control and that IM-T9P1-ASO may act predominantly through modulation of host cellular responses (online supplemental figure 3O). Accordingly, in situ hybridization combined with flow cytometry revealed broad Cd274 mRNA downregulation in intratumoral DC3s, cDC2s, and macrophages, already after two doses of IM-T9P1-ASO, while PD-L1 protein levels were still preserved at this stage (figure 3I).
To understand the contribution of TLR9 in mediating antitumor efficacy, we treated tumor-bearing mice lacking Tlr9 with IM-T9P1-ASO and observed less efficient clearance of MC38 tumor cells compared with WT mice (figure 3J). We concluded that tumor control mediated by IM-T9P1-ASO is partially but not completely dependent on TLR9. Altogether, these data suggest that both TLR9 triggering and reduction of PD-L1 expression contribute to the therapeutic efficacy of IM-T9P1-ASO.
Increased frequency of migratory DCs in tumor-dLNs after IM-T9P1-ASO therapy
Some CCR7-expressing DC3s remain within tumors where they license effector T-cell responses,10 13 whereas others migrate to tumor-dLNs where they contribute to antigen presentation and priming of T-cell immunity.18 Therefore, we also investigated the potential effects of IM-T9P1-ASO on DCs in dLNs and considered ndLNs as controls. Interestingly, the number of CD11cint MHC-IIhi DCs, often referred to as migratory DCs or migDCs,40 but not CD11chi MHC-IIint DCs, often referred to resident DCs or resident DCs (rDCs), increased in dLNs during IM-T9P1-ASO therapy (figure 4A). In contrast, the number of F4/80+ macrophages and CD19+ B cells increased in both dLNs and ndLNs, suggesting a tumor-independent effect of IM-T9P1-ASO therapy on these populations (figure 4A). Comparing the activation status of migDCs and rDCs in the dLN of IM-T9P1-ASO-treated mice, we detected PD-L1 downregulation and increased CD80:PD-L1 ratio in migDCs only 8 days after treatment start (figure 4B,C), suggesting activation of these cells during IM-T9P1-ASO therapy.
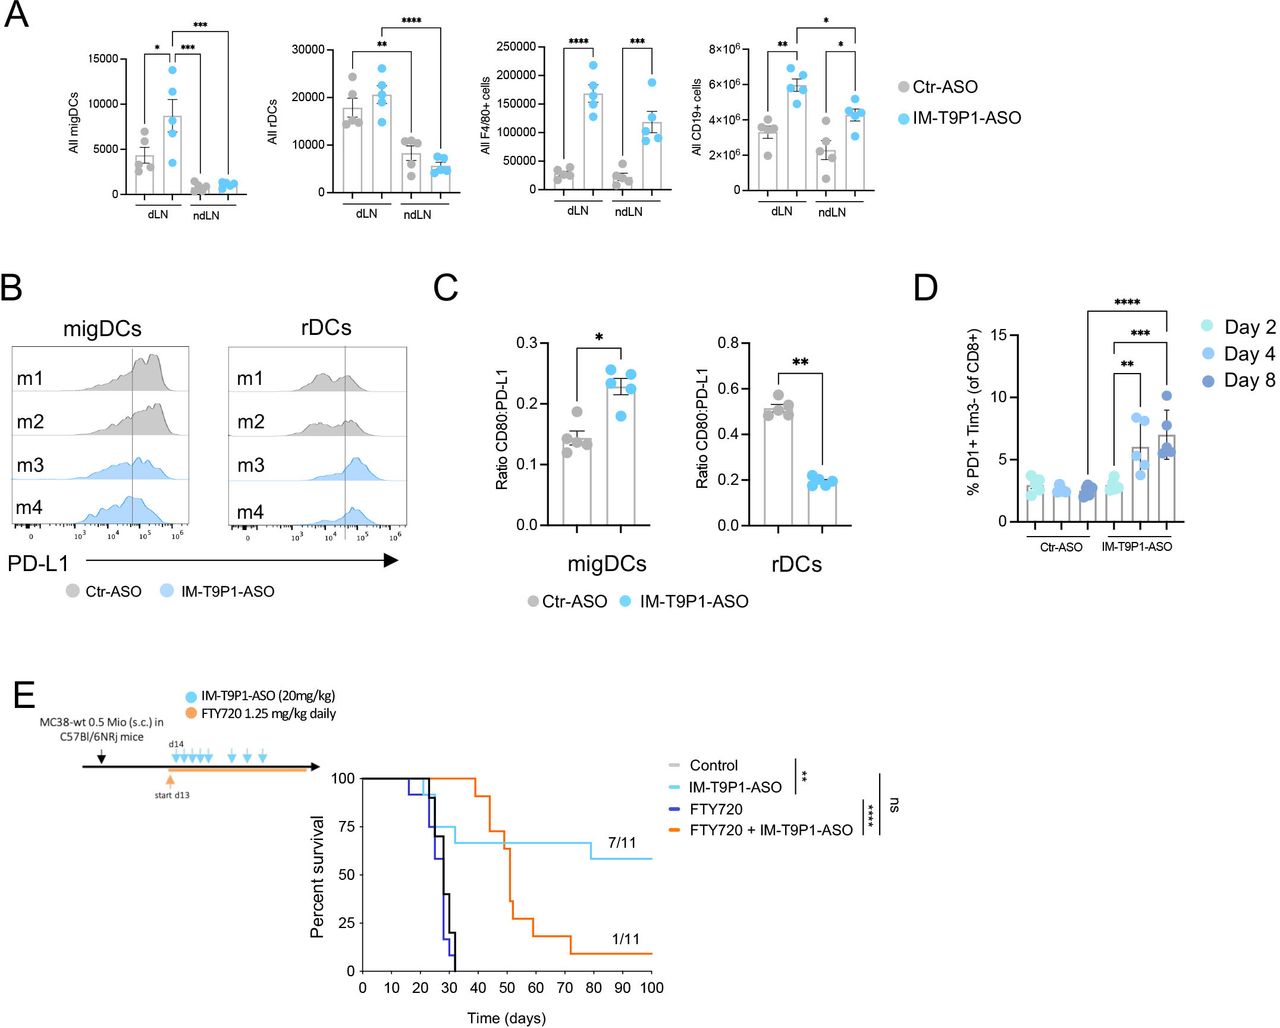
Increased frequency of migDCs in tumor-draining lymph nodes after IM-T9P1-ASO therapy. (A) Total number of migratory DCs (migDCs—CD11cint MHC-IIhi cells), resident DCs (rDCs—CD11chi MHC-IIint), macrophages (F4/80+ cells), and B cells (CD19+ cells) in MC38 dLN and ndLN, counted by flow cytometry 2 days after IM-T9P1-ASO or Ctr-ASO treatment (n=5 mice/group). (B) Representative flow cytometry histograms of PD-L1 surface expression in migDCs and rDCs 8 days after Ctr-ASO or IM-T9P1-ASO treatment. (C) Flow cytometry analysis showing the CD80:PD-L1 expression ratio on migDCs and rDCs 8 days after Ctr-ASO or IM-T9P1-ASO therapy (n=5 mice/group). (D) Proportion of PD-1+ Tim3– CD8+ T cells after Ctr-ASO or IM-T9P1-ASO therapy at the indicated time points (n=5 mice/group). (E) Lymphocyte trafficking was inhibited in MC38 tumor-bearing mice using FTY720 during IM-T9P1-ASO therapy as illustrated (n=11 mice/group). Kaplan-Meier survival curves with the respective number of tumor-free surviving mice are shown. Data are presented as mean±SEM. For comparisons between two groups, Student’s two-tailed t-test was used. For comparisons between multiple groups, one-way analysis of variance was used. For survival analyses, the Mantel-Cox log-rank test was used. *p<0.05, **p<0.01, ***p<0.001, ****p<0.0001. ASO, antisense oligonucleotides; cDC, conventional DC; CpG, cytosine-phosphate-guanine; DC, dendritic cell; dLN, draining lymph node; FMO, fluorescence minus one; MHC, major histocompatibility complex; ndLN, non-draining LN; PD-1, programmed cell death 1; PD-L1, programmed cell death ligand 1; s.c., subcutaneously; Tim3, T cell immunoglobulin and mucin-domain containing-3
Notably, these changes were accompanied by increased PD-1+Tim3– CD8+ T cells after IM-T9P1-ASO treatment (figure 4D, online supplemental figure 3P). Several studies have demonstrated that this T-cell population contains both stem-like and effector-like CD8+ T cells41 and positively correlates with response to checkpoint immunotherapy in patients and preclinical models.41–43 To address the contribution of self-renewing intratumoral T cells and dLN-resident cells to IM-T9P1-ASO-mediated antitumor immunity, we blocked lymphocyte recirculation with the trafficking inhibitor FTY720.44 IM-T9P1-ASO treatment in the presence of FTY720 allowed initial tumor control but failed to mediate complete tumor regression and long-term survival (figure 4E), suggesting that efficient IM-T9P1-ASO requires both, pre-existing and actively recruited lymphocytes from the dLN to the tumor site.
IM-T9P1-ASO increases intratumoral IL-12+ DC3s
To further understand the contribution of DCs to the therapeutic efficacy of IM-T9P1-ASO, we used Batf3–/– mice that show a reduced percentage of intratumoral cDC1s,45 DC3s and IL-12+ DC3s (online supplemental figure 4A,B). Notably, the beneficial therapeutic activity of IM-T9P1-ASO was lost in MC38 tumor-bearing Batf3–/– mice (figure 5A). Therefore, our data strongly support that the response to IM-T9P1-ASO therapy is driven through the modulation of DCs, leading to better T-cell licensing.
Supplemental material

IM-T9P1-ASO increases intratumoral IL-12+ DC3s. (A) Kaplan-Meier survival curve of MC38 tumor-bearing WT or Batf3–/– mice treated with Ctr-ASO or IM-T9P1-ASO (n=5–6 mice/group). The number of tumor-free mice is indicated in brackets. (B) Flow cytometry analysis of the indicated DC subsets in MC38 tumors 2 days after indicated treatment (n=5 mice/group). (C) Average tumor growth of MC38 tumor-bearing mice treated with IM-T9P1-ASO both in the presence and absence of pDC depletion antibody CD317 (n=3–6 mice/group). (D) Intravital analysis of MC38-mApple tumors in IL-12p40-eYFP reporter mice treated with Ctr-ASO or IM-T9P1-ASO (n=3 mice/group). Left: representative microscopy images (green, IL-12p40-eYFP-expressing cells; red, tumor cells; blue, Pacific Blue-labeled vasculature). Right: quantification of IL-12p40-eYFP+ cells up to 4 days after treatment. (E) Flow cytometry analysis of IL-12+ cells in the indicated cell subsets in MC38 tumors of WT mice 3 days after indicated treatment (n=5 mice/group). (F) Flow cytometry analysis of PD-L1 expression in DC3s (left) and IL-12p40-eYFP+ DCs (right) in MC38 tumors of IL-12p40-eYFP reporter mice 3 days after indicated treatment (n=4–5 mice/group). (G) Flow cytometry-based heatmap showing the average PD-L1 expression on the surface of the indicated cell types in MC38 tumors 4 days after IM-T9P1-ASO therapy (n=5 mice/group). (H) Flow cytometry analysis of the PD-L1 surface expression in the different intratumoral cell subsets indicated in wildtype and IFN-γR deficient mice (n=5 mice/group) bearing MC38 tumors. (I) Tumor growth of MC38 tumors during IL-12 neutralization in presence of IM-T9P1-ASO therapy using anti-IL-12p40 neutralizing mAb (n=5–6 mice/group). The number of tumor-free mice is indicated. (J) Average tumor growth of D4M.3A tumor-bearing WT and IL-12p40–/– mice treated with Ctr-ASO or IM-T9P1-ASO (n=7–9 mice/group). Data are presented as mean±SEM. For comparisons between two groups, Student’s two-tailed t-test was used. For comparisons between multiple groups and variables, two-way analysis of variance was used. For survival analyses, the Mantel-Cox log-rank test was used. *p<0.05, **p<0.01, ***p<0.001, ****p<0.0001. ASO, antisense oligonucleotides; cDC, conventional DC; DC, dendritic cell; IFN, interferon; IL, interleukin; MFI, mean fluorescence intensity; MHC, major histocompatibility complex; pDC, plasmacytoid DC; PD-L1, programmed cell death ligand 1; WT, wild-type.
To capture early functional and phenotypical changes in tumor-infiltrating DCs, we performed ex vivo analysis of MC38 tumors after only two doses of IM-T9P1-ASO. The proportion of intratumoral CD11c+ MHC-II+ DCs, specifically XCR1+ cDC1s and CD11b+ cDC2s, were similar between Ctr-ASO and IM-T9P1-ASO-treated mice (figure 5B). However, the frequency of DC3s and SiglecH+ DCs (pDCs) increased after treatment with IM-T9P1-ASO (figure 5B). Because pDC depletion (online supplemental figure 4C) had no effect on IM-T9P1-ASO-mediated antitumor immune response (figure 5C), we focused our attention on DC3s in further experiments.
We found that the increase in intratumoral DC3s was driven by IFN-γ, as demonstrated by the lack of expansion of these cells in IFNgR–/– mice treated with IM-T9P1-ASO (online supplemental figure 4D). Furthermore, intratumoral DC3s failed to expand in TLR9–/– mice treated with IM-T9P1-ASO (online supplemental figure 4D), in agreement with our in vitro data (figure 2D). These results not only support previous studies showing that the presence of a pro-inflammatory milieu is a prerequisite for DC3 expansion,10 but also suggest that conventional DCs, particularly DC3s, and not pDCs, contribute to IM-T9P1-ASO therapeutic efficacy.
The production of IL-12 by DCs can be critical for successful responses to anti-PD-1 treatment.10 Using intravital imaging, we observed that the treatment of IL-12p40-eYFP reporter mice with AF647- IM-T9P1-ASO (online supplemental figure 3A) led to an increase in IL-12p40-eYFP+ cells (figure 5D). Also, about 50% of IL-12p40-eYFP+ cells contained AF647-IM-T9P1-ASO 4 days after treatment, even after a single-dose drug administration (online supplemental figure 4E). We confirmed the expansion of IL-12+ DCs in MC38 tumors by flow cytometry 3 days after IM-T9P1-ASO treatment (figure 5E) and identified DC3s as the dominant IL-12-producing population in this tumor (figure 5E). Thus, IM-T9P1-ASO therapy induced IL-12 production primarily by DC3s.
To understand how IM-T9P1-ASO treatment affects the kinetics of PD-L1 expression, we analyzed intratumoral DCs collected at different time points after treatment initiation. As depicted in figure 3I, intratumoral DC3s showed decreased Cd274 mRNA after two doses of IM-T9P1-ASO, while PD-L1 protein was still preserved at this stage. We then observed the downregulation of PD-L1 protein at intracellular and surface levels in DC3s on days 3 and 4 after the start of treatment, respectively, corresponding to three and four doses of IM-T9P1-ASO (figure 5F,G). Furthermore, IM-T9P1-ASO-mediated IL-12 induction was strictly limited to the fraction of TLR9-expressing DC3s (online supplemental figure 4F). Overall, these data show time-dependent PD-L1 downregulation in DC3s starting 2 days after IM-T9P1-ASO treatment at the RNA level followed by protein knockdown on day 3, and confirm that induction of the DC3 state is dependent on TLR9 stimulation. In contrast, IM-T9P1-ASO treatment left PD-L1 expression unchanged in other cell types or even increased it in macrophages, cDC1s and cDC2s (figure 5G) in part explained by the influence of IFN-γ within the tumor microenvironment, as the PD-L1 downregulation in mice lacking IFN-γR was pronounced on IM-T9P1-ASO treatment except for cDC2s (figure 5H). Thus, IM-T9P1-ASO suppressed PD-L1 expression specifically in DC3s despite the presence of IFN-γ, including those producing IL-12, first at mRNA level and then at the intracellular and surface protein level.
To evaluate the role of IL-12 during IM-T9P1-ASO therapy, we treated MC38 tumor-bearing mice with IM-T9P1-ASO in the presence or absence of neutralizing IL-12 mAb (online supplemental figure 4G). IM-T9P1-ASO therapy resulted in tumor rejection in 50% of the mice in the absence of neutralizing IL-12 mAb. In contrast, it failed to reject tumors in the presence of the neutralizing mAb (figure 5I). Similarly, D4M.3A tumor-bearing mice lacking IL-12p40 showed reduced tumor control when treated with IM-T9P1-ASO (figure 5J and online supplemental figure 4H). Together, these results indicate that IL-12 secretion is necessary to mount an efficient, long-lasting antitumor response in mice during IM-T9P1-ASO therapy.
IL-12, DC3 and pDC signatures are enriched in patients with melanoma responding to ICI
Although the clinical efficacy of a TLR9 activating and PD-L1 targeting ASO remains uninvestigated so far, we sought to understand the implications our findings may have for anticancer therapies in humans. To this end, we analyzed the mRNA expression of CD274, encoding for PD-L1, in tumors of different patients with cancer using a publicly available human pan-cancer single-cell RNA sequencing (scRNA-seq) data set.19 Like in mice and in agreement with previous data,16 19 DC3s expressed the highest level of CD274 in all tumor entities compared with other DCs and myeloid cells (figure 6A). As DCs are widely conserved across patients and cancer types, the different DC states can be identified based on a set of genes that they dominantly express.12 Therefore, using published works and data sets,12 29 we generated an IL-12 signature, as well as different DC signatures to distinguish human DC3, cDC1, cDC2 and pDC (table 1). First, we confirmed the enrichment of the DC3 signature in DC3s compared with all other myeloid cells across tumors in the human pan-cancer scRNA-seq data set19 (online supplemental figure 5A). Next, we tested the value of all these signatures in predicting response to the anti-PD-1 mAb nivolumab in patients with melanoma.31 Importantly, we identified an enrichment of IL-12, DC3 and pDC signatures in responders compared with non-responders (figure 6B), which agrees with the important role of DC3s in the induction of IL-12-stimulated antitumor T-cell responses.10 In line with previous findings,46 these data show that enrichment of DC3s in human melanoma before treatment may predict a better response to anti-PD-1 therapy.
Supplemental material

CD274 and TLR expression across human myeloid population and signatures enrichment in patients with melanoma. (A) Violin plots showing mRNA expression of CD274 across indicated myeloid populations in different tumor entities.19 Top-left: lung cancer; top-right: melanoma; bottom-left: colorectal cancer; bottom-right: breast cancer. (B) Enrichment analysis of IL-12, DC3, cDC1, cDC2 and pDC gene signatures (derived from29 and12 in tumor biopsies of patients with melanoma (n=42) before nivolumab treatment.31 Patients are classified according to their response to nivolumab therapy as progressive disease (PD), stable disease (SD) and partial response (PR). (C) Heatmap showing mRNA expression of TLRs across indicated myeloid populations in patients with lung cancer.19 Data are presented as mean±SEM. For comparisons between multiple groups, one-way analysis of variance was used. *p<0.05, **p<0.01, ***p<0.001, ****p<0.0001. cDC, conventional DC; DC, dendritic cell; IL, interleukin; mRNA, messenger RNA; ns, not significant; pDC, plasmacytoid DC ; TLR, toll-like receptor.
Human IL-12 and DC signatures. List of genes used to define human IL-12 and DC (DC3, cCD1, cDC2 and pDC) signatures
Besides PD-L1 suppression, TLR9 targeting was also critical to IM-T9P1-ASO efficacy in the mouse cancer models used above. Considering that various TLRs may regulate DC functions,47 48 and that DCs may express distinct TLRs in different cancer indications and/or species, we sought to examine TLR expression in human tumor-infiltrating DCs.48 We found that pDCs had the highest TLR9 mRNA levels among myeloid cells in lung tumors (figure 6C), breast tumors (online supplemental figure 5B) and melanomas (online supplemental figure 5C), which confirmed previous knowledge,48 and indicated that differences exist in TLR9 expression between human and murine DCs. By specifically analyzing human intratumoral DC3s, we found that they can express different TLRs depending on tumor entities. For example, they predominantly expressed TLR3 in lung tumors (figure 6C), but TLR7 in breast tumors (online supplemental figure 5B), and they did not detectably express TLRs, at least at the transcript level, in melanomas (online supplemental figure 5C). However, cDC1s and cDC2s, both of which are putative DC3 precursors,12 15 16 expressed several TLRs including TLR3, TLR6 and TLR10 in the different tumor types analyzed. Therefore, our data suggest that TLR9 expression in human tumors is likely limited to pDCs; however, several other TLRs, including TLR3, are consistently expressed by DC3s and/or their cDC1/cDC2 precursors.
Discussion
In this study, we used mouse tumor models poorly responsive to ICIs to uncover key immune cells and pathways required for successful antitumor responses. Following the treatment of tumor-bearing mice with anti-PD-L1 mAbs, we detected insufficient capacity of APCs to activate T cells through co-stimulatory molecules and cytokine secretion. Therefore, to improve anti-PD-L1 therapy, we sought to develop a tool that simultaneously activates APCs and targets the immune checkpoint PD-L1.
To do so, we took advantage of the ASO technology, which has been used to silence specific target genes (eg, oncogenes, immune checkpoints), showing encouraging results in preclinical and clinical oncology.23 49 Using bioinformatics algorithms, we generated an immunomodulatory ASO (IM-T9P1-ASO) with specificity for mouse Cd274 that contains an unmethylated CpG motif allowing simultaneous stimulation of TLR9 and downregulation of both intracellular and surface expression of PD-L1. Notably, TLR9 agonists typically need to be administered directly in the tumor to be efficacious.50–52 Here, we showed that systemic administration of IM-T9P1-ASO had a remarkable capacity to induce effective and long-lasting antitumor responses in multiple mouse tumor models. We then confirmed IM-T9P1-ASO efficacy in mice depends on both TLR9 stimulation and PD-L1 modulation. Specifically, we observed a TLR9-dependent expansion of intratumoral DC3s, the primary IL-12-producers, shortly after IM-T9P1-ASO treatment. While dissecting the mechanisms responsible for IM-T9P1-ASO efficacy, we found Batf3+ cells, namely cDC1 and potentially DC3s, and IL-12 to be crucial in linking the innate and adaptive immunity induced by IM-T9P1-ASO. Of note, both recirculating and intratumoral lymphocytes were essential for IM-T9P1-ASO-mediated tumor rejection. Increased T-cell activation after IM-T9P1-ASO treatment may result from multiple events: (1) migration of DCs to the lymph nodes and de novo priming of T cells, (2) reinvigoration of a pre-existing T-cell immunity inside tumors (due to PD-L1 downregulation, eg), and (3) direct activation of CD8+ T cells in tumors. Further investigations would be required to discern the exact contribution of these events to IM-T9P1-ASO-mediated antitumor immunity. In addition, pDC depletion did not abrogate the efficacy of IM-T9P1-ASO therapy, demonstrating the lack of contribution of pDCs in IM-T9P1-ASO-mediated tumor control.
Surprisingly, despite the strong potential of the IM-T9P1-ASO to knock down PD-L1 expression in vitro, PD-L1 downregulation was overall rare in vivo, probably because counteracted by IFN-γ and the pro-inflammatory environment induced by IM-T9P1-ASO treatment. Nevertheless, we detected PD-L1 downregulation in tumor-infiltrating DC3s. Specifically, the downregulation of PD-L1 followed a time-dependent pattern: reduced mRNA levels (day 2, after two doses), followed by decreased intracellular (day 3, after three doses) and surface (day 4, after four doses) protein levels.
Due to the high co-expression of immunoregulatory genes (Cd274, Pdcd1lg2 and Cd200) and maturation genes (Cd40, Ccr7 and Il12b), DC3s have also been called ‘mature DCs enriched in immunoregulatory molecules’ (mregDC). This designation highlights a DC3 immunomodulatory program that may limit antitumor immune responses.16 Here, we showed that a combined strategy boosting intratumoral DC3s while controlling their PD-L1 expression reinvigorates rather than limits antitumor immunity, leading to durable antitumor responses.
DC subsets are widely conserved across patients and cancer types,12 as well as between humans and mice,14 suggesting that studying cancer mouse models to understand human disease might be relevant. Furthermore, different DC states can be defined based on specific gene signatures.12 Here, we showed that IL-12 and DC3 signatures were enriched in biopsies of anti-PD-1 responders, indicating that the presence of DC3s prior to the treatment may predict a better outcome in patients with melanoma treated with ICIs. This is consistent with previous findings in human breast tumors.46 Along the same line, DC3-associated genes at diagnosis are associated with better overall clinical outcomes in patients with lung adenocarcinoma.14
Of note, DC3s likely derive from both cDC1s and cDC2s in humans.12 15 However, it remains unclear what drives the acquisition of the DC3 program, but our data suggest that DC3s may be a mature and activated DC state originating from other DCs, including cDC1s. Specifically, we observed that: (1) Batf3–/– mice lack both cDC1s and a DC3 subset, (2) IM-T9P1-ASO-mediated DC3 expansion is accompanied by a cDC1 contraction in the tumor, and (3) cDC1s display the highest TLR9 expression in our mouse model. Therefore, it is tempting to speculate that TLR9 engagement may contribute to the conversion of cDC1 into DC3s. However, lineage-tracing studies will be required to fully comprehend the origin of DC3s and confirm or refute this hypothesis.
Compared with mice, TLR9 has a more restricted expression pattern in humans, where it is mainly expressed in pDCs among the different DC states.48 This difference in TLR expression between murine and human DCs indicates the need to consider additional ASO variants to optimize cDC activation. For instance, PD-L1 ASOs carrying TLR3 (instead of TLR9) agonistic activities, might prove superior in therapy. Yet, TLR9 targeting in humans may also trigger desired antitumor activities; for example, treatment with the TLR9 agonist vidutolimod showed therapeutic benefit in patients with metastatic melanoma resistant to anti-PD-1 antibodies,51 indicating that combining TLR9 agonists with ICIs can be a valid strategy for clinical development.
We also show that in humans, the expression of TLRs in DC3s varies between tumor types. Only TLR3 is expressed in DC3s in certain tumor entities and is consistently expressed by cDC1s and cDC2s, which are both likely DC3 precursors.12 15 Of note, clinical trials using TLR3 agonists in combination with ICIs showed promising results in some solid tumor types.53 Future studies should examine whether ASOs can be further tailored to activate human DC3s, or other antitumoral DCs, by targeting alternative TLRs while downregulating PD-L1.
In summary, in this study, we showed that an ASO-based technology mediating TLR9 engagement and PD-L1 modulation overcomes resistance to anti-PD-L1 monoclonal therapy in mice. Interestingly, the IM-T9P1-ASO therapeutic efficacy relies on the modulation of the DC compartment, as it depends on the production of IL-12, mediated mainly by DC3s, and the Batf3 transcription factor. In addition, a complete downregulation of PD-L1 was not necessary for the remarkable therapeutic efficacy of IM-T9P1-ASO. Despite the different TLR pattern expression between mice and humans, our findings may provide a mechanistic groundwork for future therapy design of combinatorial agonistic TLR stimulation and checkpoint blockade for the treatment of solid tumors.
Supplemental material
Supplemental material
Data availability statement
All data relevant to the study are included in the article or uploaded as supplementary information.
Ethics statements
Patient consent for publication
Ethics approval
All animal experiments were performed in accordance with Swiss federal regulations and licenses (numbers 2408_34213, 2370_34209) were approved by the cantonal veterinary office (animal experimentation committee, Tierversuchskomission) of Basel-Stadt (CH) and with the MGH Institutional Animal Care and Use Committee (IACUC) and license (number VD3612).
Acknowledgments
We thank the flow cytometry and animal core facilities at the University of Basel and Agora Research Institute. We thank David E. Fisher and T. Mempel from MGH for providing D4M.3A cells. We thank Johannes vom Berg and Sebastian Kobold for kindly providing the PD-L1–/– mice, Daniel D. Pinschewer for the IFNgR–/– mice, and Maries van den Broek and Michel Gilliet for providing the TLR9–/– mice.
References
Supplementary materials
Supplementary Data
This web only file has been produced by the BMJ Publishing Group from an electronic file supplied by the author(s) and has not been edited for content.
Footnotes
Twitter @NKirchhammer
LF-R and CC contributed equally.
MJP and AZ contributed equally.
Correction notice This article has been corrected since it was first published. Authors Johannes vom Berg and Sebastian Kobold have now been added to the author list.
Contributors Conceived the idea of the study: AZ, ASK, RK, FJ, and MP. Funding acquisition: AZ and RB. Planned the experiments: LF-R and CC. Performed and analyzed in vitro experiments: LF-R, CC, RB, JF, AM, and EPB. Performed mouse experiments and related analysis: LF-R, CC, RB, MB, and EJ. JVB and SK generated and provided the PD-L1-/- mouse strain. Performed and analyzed intravital imaging: CC, RB, and RHK. Performed computational analysis: MT. Performed in silico identification of antisense oligonucleotides: SM. Interpreted the data, prepared the figures, and wrote the original draft: LF-R and CC. Provided input for research design and edited the manuscript: LF-R, CC, RB, MT, RK, NK, AM, ASK, FJ, KOD, MP, and AZ. Supervised the study: AZ and MP. Guarantor: AZ. All authors reviewed and approved the final manuscript.
Funding The work in the laboratories of AZ were supported by a non-commercial research agreement with Secarna Pharmaceuticals GmbH & Co; the Monique Dornoville de la Cour foundation and Swiss Cancer League grant (KLS-5383-08-2021-R). RB was supported by the Postdoc.Mobility Fellowship SNSF (P400PM_183852) and the Return Grant of the Swiss National Science Foundation (P5R5PM_203164). SK is supported by ‘i-Target: immunotargeting of cancer’ (funded by the Elite Network of Bavaria), Melanoma Research Alliance (grant number 409510), Marie Sklodowska-Curie Training Network for Optimizing Adoptive T Cell Therapy of Cancer (funded by the Horizon 2020 programme of the European Union; grant 955575), Else Kröner-Fresenius-Stiftung, German Cancer Aid, the Wilhlem-Sander-Stiftung, Ernst Jung Stiftung, Institutional Strategy LMUexcellent of LMU Munich (within the framework of the German Excellence Initiative), the Go-Bio-Initiative, the m4-Award of the Bavarian Ministry for Economical Affairs, Bundesministerium für Bildung und Forschung, European Research Council (Starting Grant 756017 and PoC Grant 101100460), Deutsche Forschungsgemeinschaft (DFG; KO5055-2-1 and 510821390), by the SFB-TRR 338/1 2021–452881907, Fritz-Bender Foundation, Deutsche José Carreras Leukämie Stiftung and Hector Foundation. Research in the lab of JvB is supported through grants of the Novartis Foundation for Medical-Biological Research (16C231), Swiss Life Jubiläumsstiftung (1283-2021), Swiss National Science Foundation (NRP79, 407940_206465) and Swiss Cancer Research (KFS-3852-02-2016, KFS-4146-02-2017, KFS-5306-02-2021).
Competing interests AZ received consulting/advisor fees from BMS, MSD, Hoffmann–La Roche, NBE Therapeutics, Secarna, ACM Pharma, and Hookipa, and maintains further non-commercial research agreements with Secarna, Hookipa, and Beyondsprings. MP has served as a consultant for Aileron Therapeutics, AstraZeneca, Cygnal Therapeutics, Elstar Therapeutics, ImmuneOncia, KSQ Therapeutics, Merck, Siamab Therapeutics, and Third Rock Ventures. The wife of RB is an employee and shareholder of CSL Behring and RB received speakers fee from Janssen. RHK, JF, AM, and FJ are employed by Secarna. CC is currently employed by Idorsia Pharmaceuticals. SK has received honoraria from TCR2 Inc, Novartis, BMS, and GSK. SK is an inventor of several patents in the field of immuno-oncology. SK received license fees from TCR2 Inc and Carina Biotech. SK received research support from TCR2 Inc., Tabby Therapeutics, Plectonic GmBH, and Arcus Bioscience for work unrelated to the manuscript. JvB is an inventor on patents in the field of immuno-oncology and a part time employee of InCephalo AG with equity interest in InCephalo AG. JvB has received honoraria from Bristol Meyer Squibb.
Provenance and peer review Not commissioned; externally peer reviewed.
Supplemental material This content has been supplied by the author(s). It has not been vetted by BMJ Publishing Group Limited (BMJ) and may not have been peer-reviewed. Any opinions or recommendations discussed are solely those of the author(s) and are not endorsed by BMJ. BMJ disclaims all liability and responsibility arising from any reliance placed on the content. Where the content includes any translated material, BMJ does not warrant the accuracy and reliability of the translations (including but not limited to local regulations, clinical guidelines, terminology, drug names and drug dosages), and is not responsible for any error and/or omissions arising from translation and adaptation or otherwise.