Article Text

Abstract
Background Tumor mutational burden (TMB), defined as the number of somatic mutations per megabase of interrogated genomic sequence, demonstrates predictive biomarker potential for the identification of patients with cancer most likely to respond to immune checkpoint inhibitors. TMB is optimally calculated by whole exome sequencing (WES), but next-generation sequencing targeted panels provide TMB estimates in a time-effective and cost-effective manner. However, differences in panel size and gene coverage, in addition to the underlying bioinformatics pipelines, are known drivers of variability in TMB estimates across laboratories. By directly comparing panel-based TMB estimates from participating laboratories, this study aims to characterize the theoretical variability of panel-based TMB estimates, and provides guidelines on TMB reporting, analytic validation requirements and reference standard alignment in order to maintain consistency of TMB estimation across platforms.
Methods Eleven laboratories used WES data from The Cancer Genome Atlas Multi-Center Mutation calling in Multiple Cancers (MC3) samples and calculated TMB from the subset of the exome restricted to the genes covered by their targeted panel using their own bioinformatics pipeline (panel TMB). A reference TMB value was calculated from the entire exome using a uniform bioinformatics pipeline all members agreed on (WES TMB). Linear regression analyses were performed to investigate the relationship between WES and panel TMB for all 32 cancer types combined and separately. Variability in panel TMB values at various WES TMB values was also quantified using 95% prediction limits.
Results Study results demonstrated that variability within and between panel TMB values increases as the WES TMB values increase. For each panel, prediction limits based on linear regression analyses that modeled panel TMB as a function of WES TMB were calculated and found to approximately capture the intended 95% of observed panel TMB values. Certain cancer types, such as uterine, bladder and colon cancers exhibited greater variability in panel TMB values, compared with lung and head and neck cancers.
Conclusions Increasing uptake of TMB as a predictive biomarker in the clinic creates an urgent need to bring stakeholders together to agree on the harmonization of key aspects of panel-based TMB estimation, such as the standardization of TMB reporting, standardization of analytical validation studies and the alignment of panel-based TMB values with a reference standard. These harmonization efforts should improve consistency and reliability of panel TMB estimates and aid in clinical decision-making.
- TMB
- tumor mutational burden
- biomarker
- harmonization
- immunotherapies
- immune checkpoint inhibitors
This is an open access article distributed in accordance with the Creative Commons Attribution Non Commercial (CC BY-NC 4.0) license, which permits others to distribute, remix, adapt, build upon this work non-commercially, and license their derivative works on different terms, provided the original work is properly cited, appropriate credit is given, any changes made indicated, and the use is non-commercial. See http://creativecommons.org/licenses/by-nc/4.0/.
Statistics from Altmetric.com
Background
Immune checkpoint inhibitors (ICIs) have recently emerged as a pillar of cancer care, providing the potential for durable responses and improved survival for patients across multiple cancer types.1–3 An intensive clinical development pipeline investigating ICIs is ongoing as a result. However, not all patients with cancer respond to ICIs, with modest response rates for several approved indications (approximately 20% or less in lung cancer, bladder cancer and cancers of the head and neck, among others) and high treatment costs. There is a crucial interest in the development of biomarker assays to predict which patients are most likely to respond and benefit from ICIs, and to improve clinical decision-making and disease management.4 5
Expression of the programmed cell death ligand protein-1 (PD-L1) by immunohistochemistry (IHC) has been studied extensively as a biomarker of response to anti-PD-L1 and programmed cell death protein 1 (PD-1) therapy. Several assays have been developed to quantify tumor PD-L1 immuno-positivity; however, quantitation is imperfect, and lack of standardization across platforms and scoring systems precludes assay interchangeability.6 Tumor mutational burden (TMB), which measures the number of somatic mutations per megabase (Mb) of the interrogated genomic sequence of a tumor, has been most recently identified as a biomarker of response to ICIs in several cancer types. High TMB is associated with improved outcomes in patients with melanoma treated with cytotoxic T-lymphocyte-associated protein 4 (CTLA-4) blockade7–9 and PD-1/PD-L1 blockade across several cancer types, including melanoma,10 11 non-small-cell lung carcinoma,12–15 bladder cancer,16 microsatellite instability cancers3 17 and pan-tumor cohorts.18–20 High TMB has also been associated with improved outcomes in patients treated with a combination of PD-1/PD-L1 and CTLA-4 inhibitors.21–24
Initial assessments of TMB involved whole exome sequencing (WES) of matched tumor tissue and normal specimens using next-generation sequencing (NGS).3 8–10 However, WES is not currently routine in clinical practice due to substantial cost and turnaround time, which has led assay manufacturers and commercial and academic labs to develop targeted NGS panels. These targeted panels, which cover several hundred genes, are already routinely used in clinical practice, and are currently being adapted to estimate TMB. TMB estimated from targeted NGS panels has generally correlated well with TMB determined by WES, however the reliability of this technology is still being assessed.13–16 20 22 25–30
There are several targeted NGS panels at different stages of development that estimate TMB. To date, the Foundation Medicine FoundationOne CDx test31 is currently the only Food and Drug Administration (FDA)-approved panel, which includes TMB as part of its tumor profiling claim, while the Memorial Sloan Kettering Cancer Center MSK-IMPACT (Integrated Mutation Profiling of Actionable Cancer Targets)32 has received FDA authorization. Additionally, there are many more commercial and laboratory-developed test panels currently under development. Each panel has unique features integrated into their design that may impact TMB estimation. For example, each panel may include different numbers and types of genes, use different sequencing platforms, have different methods of filtering germline mutations, incorporate different mutation types in the quantification of TMB and use proprietary bioinformatics protocols to calculate TMB.33 34 Thus, TMB estimates will vary according to the targeted panel used.35 This is a crucial time to understand the differences in TMB estimation across panels, standardize the way TMB is reported, begin to harmonize methods for TMB quantification and identify optimal approaches to promote TMB alignment across different targeted NGS panels.
Friends of Cancer Research (Friends) convened a consortium of key stakeholders, including diagnostic manufacturers, academics, pharmaceutical companies, the National Cancer Institute and the FDA, to recommend best practices and approaches for TMB measurement, validation, alignment and reporting well ahead of the adoption of this powerful biomarker in clinical decision-making. Leveraging the expertise and insights of this comprehensive group of stakeholders, the Friends TMB harmonization project seeks to establish a uniform approach to measure and report TMB across different sequencing panels by harmonizing the definition of TMB, proposing best practices for analytic validation studies and ensuring consistency of TMB calculation through alignment with a universal reference standard. The project consists of a stepwise approach broken down into three phases: phase I, reported here, comprises the in silico analysis, which by using publicly available data from The Cancer Genome Atlas (TCGA) representing 32 cancer types, aims to identify the theoretical variability of panel-derived TMB estimates (panel TMB) relative to a common, standardized WES-derived TMB (WES TMB) across various panels. Building on the results of the in silico analysis, phase II will analyze human tumor clinical sample material to objectively measure variation across panels using patient formalin-fixed paraffin-embedded (FFPE) tissue samples. This empirical analysis will also compare panel TMB results to an agreed on universal reference standard, consisting of a collection of human tumor-derived reference cell lines that span a clinically meaningful TMB dynamic range. FFPE tissue samples will also be used to validate the use of the cell line standard. Finally, phase III will involve a clinical study that seeks to retrospectively analyze samples from patients treated with ICIs to evaluate optimal cut-off values that will help guide the clinical application of TMB (see online supplementary figure 1).
Supplemental material
The need for harmonization of TMB is a global effort, which is portrayed by the representation of national and international diagnostic companies in the consortium. Moreover, in seeking to complement the consortium’s work, the Friends TMB harmonization project has partnered with the technical comparability study conducted by Quality in Pathology in Germany,36 leading to the identification of common and panel-specific factors that influence TMB estimation and the development of global recommendations, which have been published previously.33
Due to the large scale and collaborative nature of this effort, study results will greatly contribute to understanding and refining how to best quantify and interpret TMB as a biomarker, help establish standards that will facilitate harmonization across different testing platforms and inform future harmonization efforts that seek to ensure consistency across diagnostic platforms.
Methods
In silico dataset
Mutation calls generated using Multi-Center Mutation calling in Multiple Cancers (MC3) WES data from TCGA project were used for this analysis.37 Variants that overlapped with the CCDS, using bedtools (-wa option)38 were extracted from the publicly available mc3.v0.2.8.PUBLIC.maf file (https://gdc.cancer.gov/about-data/publications/pancanatlas). Finally, the data were filtered for any overlap or redundancy using the ‘merge’ function. The consortium created a final bed file that covered 32.102 Mb of the genome after intersecting the data found in the MAF files and filtering for any overlap or redundancy (see online supplementary methods). The final bed file size was used as the denominator for calculating WES TMB in this study. Three different consortium laboratories independently calculated WES TMB using the same dataset and analytical methodology with 100% concordance.
Ten thousand two hundred ninety-five tumor samples with matched normal initially composed part of the cohort. Only samples with at least one variant which PASSED variant review filter were used (see online supplementary methods for variant quality filters). Low quality samples based on variant filters and those with low purity were also removed from further analysis. The remaining cases (n=8291) were randomly assigned to training (n=4157) and validation (n=4134) datasets with similar median candidate mutations and cancer types (online supplementary figure 2). Participants, though not required, could use the ‘training’ set for their own algorithm or parameter testing. However, all analyses described herein were conducted using the validation dataset.
The evaluations reported in the present study are those comparing panel TMB to WES TMB on the validation set, with no adjustments made to the panel TMB algorithms once the validation set analyses began. All analyses focused on tumors for which WES TMB was ≤40 because >98% of the TCGA dataset tumors investigated had TMB ≤40 in the TCGA dataset and all members of the consortium agreed that this range would have the greatest relevance for clinical decision-making. Of the 4134 tumors initially represented in the validation set, 4065 remained after excluding those with WES TMB >40. All results were blinded to the entire consortium, with the exception of the project statistician and data manager (LMMS and DMM) who were regarded as neutral parties not affiliated with any of the participating laboratories.
Statistical analysis
Statistical analyses interrogated the relationship between WES TMB and panel TMB values. The first analysis focused on the combined data from all 32 tumor types. Spearman’s R correlation values were calculated, and scatterplots and difference plots were created to assess linearity of the relationship between panel TMB and WES TMB and to evaluate whether variance of panel TMB was constant across the range of WES TMB values.
Next, the 32 tumors were divided into three strata according to the number of samples within each tumor type that had TMB values spanning the range 0–40 mut/Mb (see online supplementary methods and figure 3). Stratum 1 contained eight tumor types (see online supplementary table 1A—stratum 1) displaying a good distribution of TMB values spanning the range of interest (0–40 mut/Mb). Seventy-seven per cent of samples (1257/1627) had TMB ≤10 mut/Mb, 19% (306/1627) had TMB 10–40 mut/Mb and 4% (64/1627) had TMB ≥40 mut/Mb and were thus eliminated from further analyses. Stratum 2 was represented by 11 tumor types (see online supplementary table 1B—stratum 2) whose samples had generally low TMB values (≤10 mut/Mb, 98%, 1723/1754), and only 1.5% (26/1754) of samples had TMB 10–40 mut/Mb. Only five samples (0.29%) had TMB ≥40 mut/Mb and were thus eliminated from further analyses. Stratum 3 was represented by 13 tumor types (see online supplementary table 1C—stratum 3) whose samples had very low TMB values (≤5 mut/Mb, 99.5%, 749/753) and only 4 samples (0.5%) had samples with TMB between 5 and 10 mut/Mb. Regression modeling using weighted least squares was implemented to account for the heteroscedasticity in errors, referring to the variability in panel TMB values about the fitted regression line, which was observed to increase with the mean and with WES TMB. This modeling was conducted for all strata, although we focused on stratum 1 considering strata 2 and 3 provided less stable and unreliable estimates due to the large number of samples that concentrated in the lower end of the TMB range.
For each regression, the mean panel TMB was modeled as a simple linear function of the WES TMB, and five different models for the error variance were considered (see online supplementary methods). Restricted maximum likelihood analysis using the gls function available in the R package nlme was performed to estimate the model parameters and select a best fitting variance structure based on minimum Akaike information and Bayesian information criteria.
Whole exome analysis
The whole exome analysis of the TCGA MC3 validation dataset used an agreed on methodology to calculate the WES TMB values, termed the Uniform TMB Calculation Method (see online supplementary table 2). The goal of phase I of this harmonization study is to assess the theoretical variability across panels. Given that the participating panels were at different stages of development and had different sensitivity levels, the consortium decided to use the Uniform TMB Calculation Method, which would enable the selection of high-quality variants that all laboratories were able to assess as part of their panels. The consortium created a custom bed file covering 32.102 Mb of the genome which was used to calculate the reference WES TMB values. The calculated WES TMB values comprised the reference dataset for this study. The uniform method for analysis of WES TMB included minimum thresholds for median target coverage (median 300X as this was identified as the point where sensitivity for the lower allele frequency variants drops drastically) (see online supplementary figure 4), variant allele frequency (≥0.05), read depth (≥25) and variant count (≥3), and synonymous variants were excluded.
Panel analysis
Each participating laboratory calculated TMB from the subset of the exome restricted to the genes covered by their targeted panel and using their own unique bioinformatics pipeline (panel TMB). If available, the laboratory’s bioinformatics analysis has been reported in table 1.
Description of the 11 participating diagnostic NGS panels
The panel-derived TMB datasets were sent to a neutral third party (DMM) who assigned coded identifiers to the laboratories to mask which laboratory contributed each dataset. All subsequent data analyses were conducted by LMMS and DMM. Participating laboratories were not involved in the analyses and were not provided the key to the coded lab identifiers.
Results
In silico assessment of theoretical TMB variation across panels
Eleven academic and commercial laboratories with targeted gene panels in different stages of development participated in this study (table 1). The size of the coding region used to estimate TMB from these gene panels ranged between 0.80 and 1.72 Mb. And the number of genes in each of the gene panels ranged between 324 and 607 genes. All participating laboratories included exonic somatic non-synonymous, frameshift and splice site variants and short indels when estimating TMB. Eight panels (8/11, 73%) also included synonymous variants in their estimation. Each laboratory used their own bioinformatics algorithms and workflows, which were optimized using the sequencing methods, mutation types and filters that best suited their own panel specifications. Since the participating panels were in different stages of development, only a few had published panel performance characteristics (table 1).
The WES TMB values were calculated using the TCGA MC3 Mutation Annotation Format (MAF) validation dataset and an agreed on methodology (see ‘Whole exome analysis’ section and online supplementary table 2). The panel TMB values on the same validation dataset were estimated by down-sampling to the regions covered by each of the laboratories’ panels and applying their own bioinformatics algorithms. To prevent the misinterpretation of this study’s results as an interlab performance study, all laboratories agreed for the results to be blinded with respect to the lab generating each dataset.
First, all 32 cancer types in the TCGA MC3 dataset were investigated together using weighted linear regression analysis (generalized least squares, see ‘Methods’ section). Some variation was observed across panels, with Spearman’s rank correlation values (R) ranging from 0.79 to 0.88, and slope values ranging from 0.87 to 1.47 (figure 1A, online supplementary figure 5). Eight laboratories (73%) had slope values >1, demonstrating an overestimation of TMB. Panel factors that may influence TMB overestimation were not assessed due to the blinded study design but may have included the type of mutations counted for the panel TMB value (eg, synonymous alterations included in panel TMB that were excluded from the WES estimation), among others.
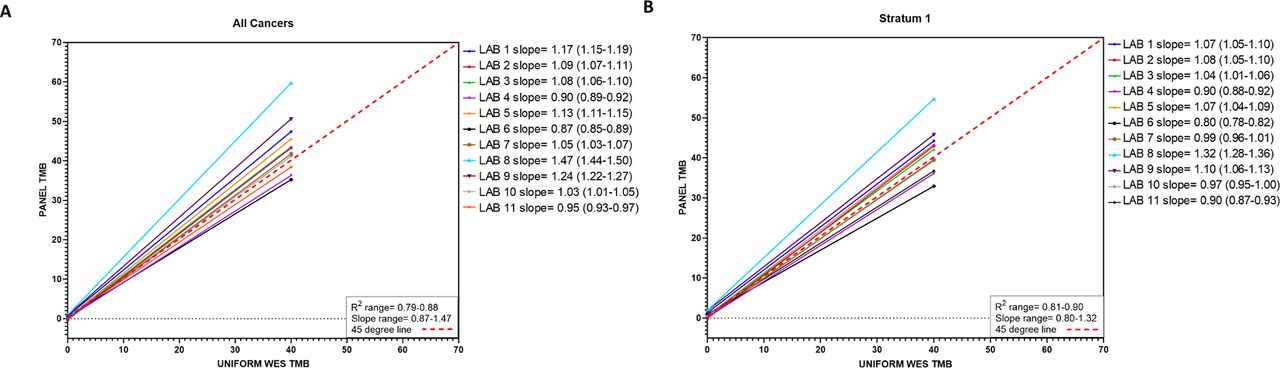
Estimated regression lines for panel tumor mutational burden (TMB) as a function of whole exome sequencing (WES) TMB for each of the 11 participating laboratories analyzing (A) all cancer types combined and (B) stratum 1 cancer types combined. Solid lines represent the fitted regression lines. Red dashed line represents 45o line.
In silico assessment of theoretical TMB variation across panels by cancer type
A limitation of analyzing all cancer types together is the variable distribution of TMB across different cancer types, with some cancer types displaying large dynamic ranges of TMB values up to several hundred mutations per Mb and others with very limited distributions with very few samples reaching 20 mutations per Mb (see online supplementary figure 3). To account for this limitation, cancer types were categorized into strata by their distribution of WES TMB values. Stratum 1 (n=1563 samples with <40 mut/Mb) had samples with a good distribution of WES TMB values covering 0–40 mut/Mb, which enabled a more robust regression analysis across a clinically relevant TMB range. The eight cancer types in stratum 1 were: bladder urothelial carcinoma (BLCA, n=195), colon adenocarcinoma (COAD, n=128), head and neck squamous cell carcinoma (HNSC, n=232), lung adenocarcinoma (LUAD, n=228), lung squamous cell carcinoma (LUSC, n=228), skin cutaneous melanoma (SKCM, n=166), stomach adenocarcinoma (STAD, n=189) and uterine corpus endometrial carcinoma (UCEC, n=197).
Regression analyses restricted to stratum 1 tumors revealed an association between WES TMB and panel TMB similar to that for all cancer types analyzed together (Spearman’s R: 0.81–0.90 and slope 0.80–1.32, figure 1B, per laboratory online supplementary figure 6 and table 3). The slopes calculated when stratum 1 tumors were analyzed were consistently lower than when all cancers were analyzed. The greatest differences in slope values when comparing slopes estimated for all cancers and for stratum 1 tumors only, were observed for labs 8 (all cancers 1.47 vs stratum 1 1.32) and 9 (all cancers 1.24 vs stratum 1 1.1) (both ∆ 0.15), while labs 4 (all cancers 0.904 vs stratum 1 0.897) and 2 (all cancers 1.087 vs stratum 1 1.076) had the least differences (∆ 0.007 and 0.01, respectively). When stratum 1 tumors were analyzed, only six laboratories (55%) reported overestimation of TMB with slope values >1.
Regression analyses with stratum 2 and 3 were not robust, as the WES TMB values did not adequately cover the entire clinically meaningful range (see online supplementary figures 7 and 8, and table 3).
Lastly, the eight cancers in stratum 1 were analyzed separately. UCEC, BLCA and COAD had the broadest range of slope values (UCEC: range 0.755–1.602, ∆ 0.847; BLCA: range 1.042–1.79, ∆ 0.748; COAD: range 0.75–1.486, ∆ 0.736) (figure 2, online supplementary table 4), and most laboratories consistently overestimated these cancer types, with BLCA as the only cancer type for which all 11 laboratories (100%) consistently overestimated their panel TMB values relative to WES TMB. Conversely, LUAD, LUSC and HNSC had the tightest range of slope values with no consistent bias to overestimating or underestimating TMB (LUAD: range 0.817–1.135, ∆ 0.318; LUSC: range 0.741–1.099, ∆ 0.358; HNSC: range 0.854–1.244, ∆ 0.39).
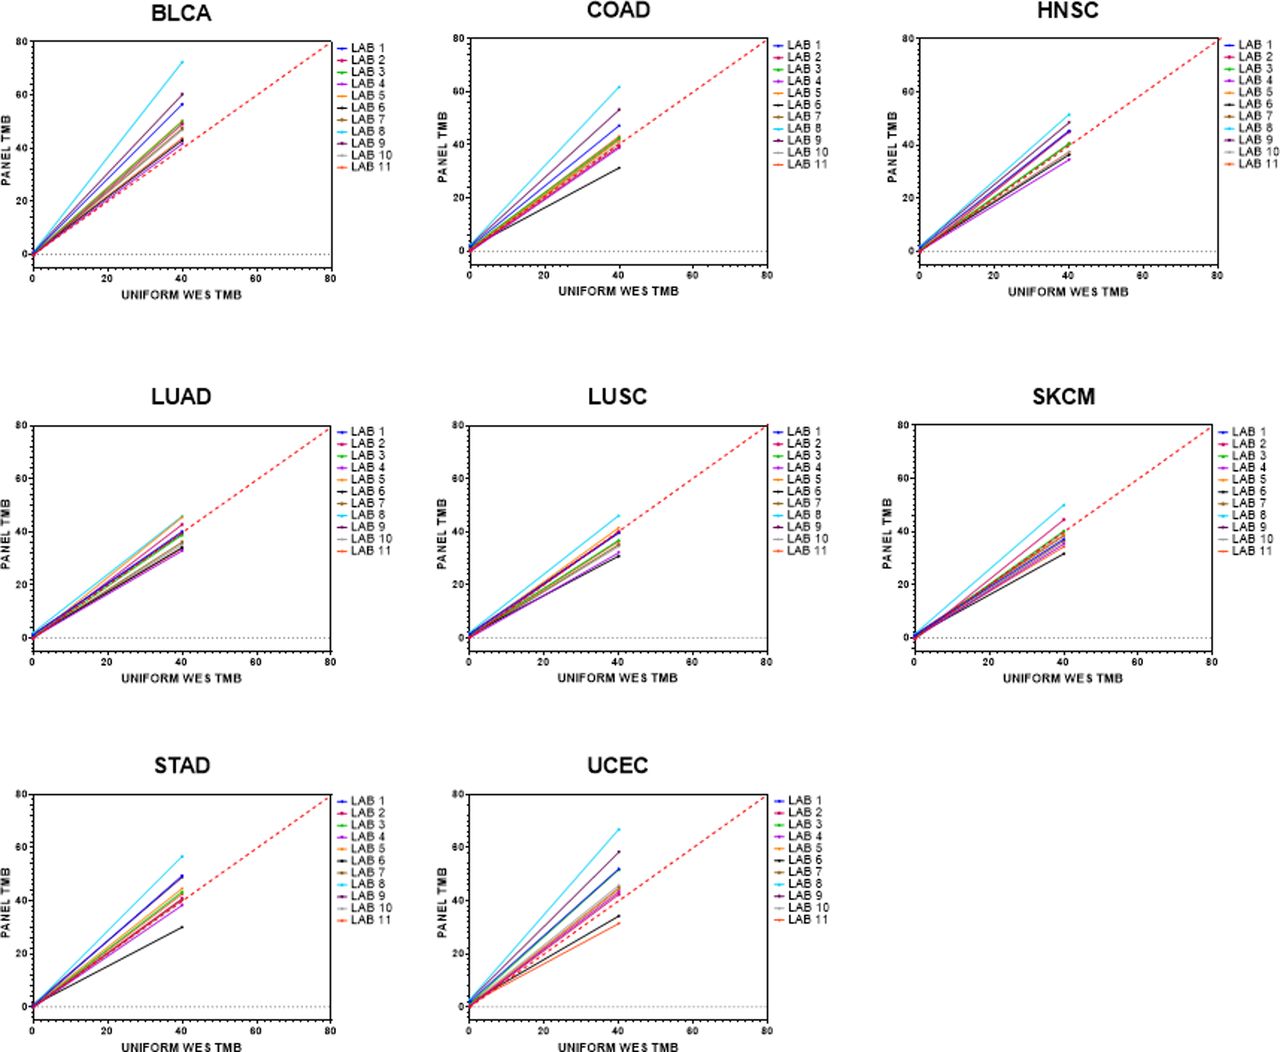
Estimated regression lines for panel tumor mutational burden (TMB) as a function of whole exome sequencing (WES) TMB for the eight cancer types within stratum 1. All cancer types had a good distribution of WES TMB values from 0 to 40 mut/Mb. Solid lines represent the fitted regression lines. Red dashed line represents 45o line. BLCA, bladder urothelial carcinoma; COAD, colon adenocarcinoma; HNSC, head and neck squamous cell carcinoma; LUAD, lung adenocarcinoma ; LUSC, lung squamous cell carcinoma; SKCM, skin cutaneous melanoma; STAD, stomach adenocarcinoma; UCEC, uterine corpus endometrial carcinoma.
Defining the theoretical variation in TMB across panels and by cancer type
Prediction limits for the observed panel TMB at fixed WES TMB (5, 10, 15 and 20 mut/Mb) were calculated to quantify the variability around the regression line at those selected WES TMB values. The limits were designed to capture approximately 95% of the panel TMB values expected to be observed at a given WES TMB. Some laboratories had consistently tighter (narrower) prediction intervals, while others demonstrated more variability (wider intervals), but for all laboratories, the prediction intervals became tighter with decreasing WES TMB value, indicating greater variability in panel TMB at larger WES TMB values (figure 3). Generally, the prediction intervals observed for each participating laboratory were similar, with laboratories demonstrating intervals that spanned as small as ±4.7 mut/Mb or as large as ±12.3 mut/Mb when the WES TMB was 10 mut/Mb, which is a TMB threshold that has been previously used to define a TMB-high cohort using NGS panels.33 When prediction limits were assessed by strata, the variability of the intervals was very large for cancer types in strata 2 and 3 compared with stratum 1 because most TMB values for the cancers in these strata accumulate in the lower end of the TMB spectrum, thus resulting in more uncertainty in the fitted regression lines and wide scatter in panel TMB values around those lines (see online supplementary figure 9). When the eight stratum 1 cancers were analyzed separately, prediction intervals at the discreet value of WES TMB=10 mut/Mb were observed to be wider for BLCA and UCEC, while LUAD, LUSC, HNSC and SKCM had the tightest intervals (figure 4). This is similar to the observed variation in fitted regression lines for BLCA and UCEC across laboratories (figure 2). The theoretical variability around the regression was also seen to increase (wider intervals) with increasing TMB value in individual cancer types (see online supplementary figure 10).

Ninety-five per cent prediction intervals for panel tumor mutational burden (TMB) estimated at discreet whole exome sequencing (WES) TMB values (5, 10, 15 and 20 mut/Mb), by laboratory across all laboratories. Blue arrows represent the estimated mean panel TMB for each laboratory. Red dashed line represents the discreet WES TMB value at which prediction interval is calculated.

Ninety-five per cent prediction intervals for panel TMB (x-axis) of stratum 1 tumor types at whole exome sequencing tumor mutational burden (WES TMB) 10 mut/Mb by laboratory (y-axis). Blue arrows represent the estimated mean panel TMB for each laboratory. Red dashed line indicates WES TMB value=10 mut/Mb. BLCA, bladder urothelial carcinoma; COAD, colon adenocarcinoma; HNSC, head and neck squamous cell carcinoma; LUAD, lung adenocarcinoma ; LUSC, lung squamous cell carcinoma; SKCM, skin cutaneous melanoma; STAD, stomach adenocarcinoma; UCEC, uterine corpus endometrial carcinoma.
Discussion
Eleven laboratories with distinct NGS targeted gene panels and bioinformatic approaches participated in phase I of the Friends of Cancer Research TMB Harmonization Project and provided early insights into the theoretical variability across different targeted gene panels that estimate TMB. The goal of the first phase of the project was to describe the variability in TMB estimates across several uniquely designed panel-based diagnostic assays and to further elucidate the theoretical variation in TMB quantification using an in silico approach with a large publicly available dataset with high-quality reads and a common reference TMB standard calculated from the entire exome. Moreover, dependence of the association between panel TMB and WES TMB on cancer type was investigated.
Variability in panel TMB across different panels was observed, with some panels consistently overestimating or underestimating TMB, suggesting that panel size and composition, as well as laboratories’ bioinformatics algorithms, including types of mutations counted and variant filters used in the TMB calculation, were likely contributors to the differences. Because of the blinded design of this study, the influence of these factors on panel TMB variability was not evaluated in this early phase of the project but will be assessed in the following empirical phase to be reported subsequently. Additionally, other studies have recently reported on the impact of panel size, DNA input and variant filtering on panel-based TMB estimates.35 39
The study evaluated a robust dataset containing 32 cancer types, with very few cases having TMB >40 mut/Mb (n=69/4134, 1.7%), so it was not possible to robustly estimate the association between panel TMB and WES TMB for cases with values >40 mut/Mb. TMB data were thus capped at 40 mut/Mb and a linear relationship was used to model the relationship in that range. Factoring the limited dynamic range of TMB values observed in some cancer types, a subset of eight cancers was identified and named stratum one for the primary analysis. Stratum 1 cancer types included lung, bladder, head and neck, skin, colon, uterine and gastric cancers, all of which have been shown to respond to immune checkpoint inhibitors. Evaluating these cancers separately revealed distinct levels of variability in the association between panel TMB and WES TMB across panels, with some cancer types having less variability (eg, lung and head and neck cancers), and some having greater variability (eg, uterine, bladder and colon cancers). As our initial findings suggest that panels may perform differently on certain cancer types, further work is required to understand the factors contributing to any disease-specific TMB variability, and the relationships beyond the analyzed TMB range. However, the composition of the panels’ genes, types of mutations counted or methods used to train their respective TMB algorithms could be future areas of focus.
Despite these cancer-dependent findings, our study found that panel TMB values were strongly correlated with WES TMB across laboratories. Additionally, the calculated 95% prediction intervals permitted estimation of the linear relationship between panel TMB and WES TMB as well as quantification of the range in which 95% of the observed TMB panel values would be expected to fall for tumors with various fixed WES TMB values. This provides a framework for understanding the theoretical variability likely to be incurred in the clinical application of TMB estimation across panels, but also suggests that harmonization of TMB estimates could be achieved through alignment using external reference materials. There is still, however, much that can be done to improve the reliability of using NGS panels for TMB estimation.
The selection of high-quality variants from the TCGA MC3 dataset was used to assess the theoretical variability of TMB across panels in this study ensuring the interpretability of the findings where the assessment of variability was limited to factors such as panel size and composition or bioinformatics pipeline, instead of perceived differences regarding sensitivity and specificity of individual variant calling. However, we acknowledge that in a clinical setting the estimation of TMB from FFPE tissue may introduce variants of lesser quality and panels should aim to validate the sensitivity and specificity of individual variant calling separately from TMB validation.
As TMB measurements are most likely to be impactful in treatment decisions for stratum one cancer types, including these tumors as part of a laboratory’s analytical validation studies to achieve optimal accuracy and consistency is critical. On the other hand, it is also important to recognize that there are cancer types with generally low TMB values that may have a few cases with high TMB values that may benefit from reliable panel TMB results. Moreover, because of the cancer type-dependent distribution of TMB values, studies aiming to evaluate the clinical utility of TMB and determine optimal TMB cut-offs for treatment decisions may need to account for specific cancer types. This would be consistent with a recent report that found that in patients who received ICI, those who had high TMB had longer survival than those who had low TMB, but TMB-high cut-offs were cancer-type dependent.20
The Friends of Cancer Research TMB Harmonization Consortium includes the participation of several leading commercial and academic laboratories as well as a diverse group of stakeholders, who together identified opportunities for standardization to promote the harmonization of TMB estimation. These have led the consortium to recommend best practices for panel developers that seek to promote consistency in alignment and facilitate commutability across panels table 2. These recommendations revolve around the following three items.
Consensus recommendations for the standardization of analytical validation studies of targeted NGS panels that estimate TMB
1. Ensure reporting consistency: TMB should be reported in mutations/megabase (mut/Mb)
The current practice of reporting WES-derived TMB values as number of somatic mutations, while panel-derived TMB values are reported as a density of somatic mutations per Mb of genomic region covered by the panel (mut/Mb), precludes the aggregate analysis of TMB being derived from WES or targeted panels, especially since the size of the exome interrogated using different platforms may not be consistent. Reporting TMB as mutations/megabase (mut/Mb) in order to keep these values consistent and comparable is recommended by the consortium.
2. Analytical validation studies for TMB estimation should be standardized to include assessment of analytical accuracy, precision and sensitivity
Size of targeted gene panel, technical sensitivity of the assay and pre-analytical and analytical variables are known to contribute to variability in panel-based TMB estimates.33 The same in silico data were used by every participating laboratory, which created a theoretical setting that focused the investigation on potential sources of variability that are unique to the technical specifications of the panel (eg, size and composition), and the bioinformatics approaches of each laboratory (eg, mutation types counted and germline and hotspot mutation filtering). Some of these factors cannot be easily modified and standardized across laboratories as panel assays are, for the most part, proprietary and have been designed to optimize their respective technical specifications and conditions. However, harmonization of TMB estimates may be achieved across laboratories by ensuring that the analytical validation studies for each panel follow a standard approach including alignment of panel TMB values to an external reference standard. Recommendations for analyzing accuracy, precision and sensitivity of TMB values to tumor content when used both as a continuous score and a categorical call have been proposed by the consortium (table 2). These recommendations will ensure that regardless of the type of panel or bioinformatics pipeline a laboratory decides to use, TMB estimates are held to a standard of acceptable reliability.
3. Consistency across panels could be ensured through alignment of panel TMB values to WES-derived universal reference standard
Comparison to WES TMB is currently the most recognized way to determine accuracy of panel TMB. However, it should be noted that differences in performance between panel TMB and WES TMB are to be expected based on differences in coverage depth between the two methods, with typically greater depth and higher variability observed in panels.
Universal reference standards, with TMB values spanning a clinically relevant range (eg, 0–40 mut/Mb), represent a promising tool to achieve alignment or calibration in order to ensure consistency of the TMB estimation across platforms, regardless of known sources of variability. An ideal reference standard for TMB estimation should be generated from a renewable source and its TMB values should be calculated using WES. To mitigate differences resulting from comparisons using multiple different WES assays, a universally accepted, predefined bioinformatics pipeline and statistical methods should be implemented. A calibration curve generated using the reference standard should be used to normalize and compare across panels, which should promote alignment and aid in the analytical validation of panel TMB values.
Conclusions
Harmonization of methodologies for the accurate measurement of complex continuous biomarkers is an ongoing effort. The Friends of Cancer Research TMB Harmonization Project has convened key stakeholders early in the development of NGS assays that estimate TMB to more effectively identify avenues for the harmonization of estimation approaches and to emphasize the need for the uptake and implementation of these harmonization recommendations. The results included in this report are the initial results from this stepwise approach, but future studies will focus on assessing the feasibility of using tumor-derived cell lines as external reference standards to help facilitate alignment of panel TMB values. Additional empirical analyses will also be conducted to investigate the influence of biologic factors (eg, specimen type, cancer type) and technical factors (eg, sequencing technology) on panel TMB, continue refining best practices for panel assessment of TMB, and developing alignment approaches to improve interchangeability between TMB estimates generated from different targeted gene panels.
Lastly, the collaborative efforts of the TMB Harmonization Consortium will serve as a framework for future harmonization initiatives that seek to standardize complex quantitative biomarker assays and promote the reliability of biomarker testing.
Acknowledgments
The authors would like to thank all members of the Friends of Cancer Research TMB Harmonization Consortium for their support and scientific contributions to the study design and interpretation. The authors would also like to thank Dr Alexander Lazar for helpful discussions.
References
Footnotes
Twitter @d2merino
Contributors DMM: conception, design, acquisition, analysis, interpretation, draft and manuscript preparation. LMMS: design, acquisition, analysis, interpretation, draft and manuscript preparation. DF: conception, design, acquisition, analysis, interpretation, draft and manuscript preparation. VF: analysis, interpretation, draft and manuscript preparation. S-JC: analysis, interpretation, draft and manuscript preparation. JRW: design, acquisition, analysis, interpretation, draft and manuscript preparation. PW: analysis, interpretation, draft and manuscript preparation. JB: analysis, interpretation, draft and manuscript preparation. JCB: conception, design, acquisition, analysis, interpretation, draft and manuscript preparation. RC: analysis, interpretation, draft and manuscript preparation. LC: analysis, interpretation, draft and manuscript preparation. WSC: analysis, interpretation, draft and manuscript preparation. J-HC: analysis, interpretation, draft and manuscript preparation. DC: analysis, interpretation, draft and manuscript preparation. JSD: analysis, interpretation, draft and manuscript preparation. VG: analysis, interpretation, draft and manuscript preparation. MH: conception, design, interpretation, draft and manuscript preparation. EH: analysis, interpretation, draft and manuscript preparation. YL: design, acquisition, analysis, interpretation, draft and manuscript preparation. JM: conception, design, interpretation, draft and manuscript preparation. AP: analysis, interpretation, draft and manuscript preparation. RP: analysis, interpretation, draft and manuscript preparation. KJQ: analysis, interpretation, draft and manuscript preparation. NR: conception, design, interpretation, draft and manuscript preparation. HT: analysis, interpretation, draft and manuscript preparation. CW: conception, design, acquisition, analysis, interpretation, draft and manuscript preparation. MX: analysis, interpretation, draft and manuscript preparation. AZ: analysis, interpretation, draft and manuscript preparation. CZ: analysis, interpretation, draft and manuscript preparation. MD: conception, design, interpretation, draft and manuscript preparation. AS: conception, design, interpretation, draft and manuscript preparation. MS: conception, design, acquisition, analysis, interpretation, draft and manuscript preparation. JA: conception, design, acquisition, analysis, interpretation, draft and manuscript preparation. All authors have approved the submitted version of the manuscript.
Funding The Friends initiative uses a distributed research model and costs incurred are borne by each participating organization. Additional sources of funding were provided by AstraZeneca; Bristol-Myers Squibb; EMD Serono; Genentech and Merck & Company Inc.
Competing interests DF: employment with Foundation Medicine and stockholder in Roche. VF: employment with NeoGenomics Inc and stockholder in NeoGenomics Inc. S-JC: employment with ACT Genomics and stockholder in ACT Genomics. JRW: founder and owner of Resphira Biosciences and paid consultant to PGDx. PW: employment with Illumina and stockholder in Illumina. JB: employment with Bristol-Myers Squibb, shareholder in Bristol-Myers Squibb and shareholder in Johnson & Johnson. JCB: employment with AstraZeneca Pharmaceuticals and stocks in AstraZeneca Pharmaceuticals. RC: employment with Thermo Fisher Scientific. WSC: employment with Caris Life Sciences. JHC: employment with ACT Genomics. DC: employment with Thermo Fisher Scientific and stockholder in Thermo Fisher Scientific. JSD: employment with Personal Genome Diagnostics. VG: employment with QIAGEN. MH: received research funding from Bristol-Myers Squibb; is paid a consultant to Merck, Bristol-Myers Squibb, AstraZeneca, Genentech/Roche, Janssen, Nektar, Syndax, Mirati and Shattuck Labs; has received travel support/honoraria from AztraZeneca and BMS and a patent has been filed by MSK related to the use of tumor mutation burden to predict response to immunotherapy (PCT/US2015/062208), which has received licensing fees from PGDx. EH: employment with Guardant Health Inc and stockholder in Guardant Health Inc. YL: employment with Foundation Medicine while engaged in the research project (March 2019). Currently, an employee of Thrive Sciences, Inc and stockholder of Thrive Sciences, Inc. AP: employment with QIAGEN. KJQ: employment with Guardant Health Inc and stockholder in Guardant Health Inc. NR: NR and Memorial Sloan Kettering Cancer Center have a patent filing (PCT/US2015/062208) for the use of tumor mutation burden and HLA for prediction of immunotherapy efficacy, which is licensed to Personal Genome Diagnostics. NR is a founder, shareholder and serves on the scientific advisory board of Gritstone Oncology. NR has also consulted for AbbVie, AstraZeneca, BMS, EMD Sorono, Genentech, GSK, Janssen, Lilly, Merck, Novartis, Pfizer, Regeneron. HT: employment with Caris Life Sciences. CW: employment with Bristol-Myers Squibb, shareholder in Bristol-Myers Squibb ad shareholder in Johnson & Johnson. MX: employment with AstraZeneca Pharmaceuticals. CZ: employment with Illumina and stockholder in Illumina. AS: advisory board and/or speech honoraria from: Bayer, BMS, MSD, Novartis, AstraZeneca, Roche, Seattle Genomics, Illumina, Thermo Fisher, Takeda. Research funding from: Chugai, BMS.
Patient consent for publication Not required.
Ethics approval As leaders in the forefront of the collection and analysis of human tissue specimens, the TCGA formed the Ethics, Law and Policy Group to generate and oversee policies related to ethical and logistical considerations of the samples they have made publicly available. The TCGA Ethics and Policies was originally published by the National Cancer Institute. The TCGA study received ethics approval for conducting their research work. No additional ethics approval was requested to use the publicly available TCGA data.
Provenance and peer review Not commissioned; externally peer reviewed.
Data availability statement Data are available in a public, open access repository. The mutation file (mc3.v0.2.8.PUBLIC.maf.gz) analyzed in this study was downloaded from the National Cancer Institute Genomics Data Commons: https://gdc.cancer.gov/about-data/publications/pancanatlas. All datasets generated by the TMB Harmonization Consortium as part of this Project have been made available at https://precision.fda.gov/. Interested users should make a precision. FDA account and request access to the data.