Article Text

Abstract
Background Characterizing expression profiles of different immune checkpoint molecules are promising for personalized checkpoint inhibitory immunotherapy. Gliomas have been shown as potential targets for immune checkpoint inhibitors recently. Our study was performed to determine coexpression levels of two major B7 immune regulatory molecules programmed death ligand 1 (PD-L1) and B7-H4, both of which have been demonstrated to inhibit antitumor host immunity in gliomas.
Methods We assessed tumor tissues from stage II–IV primary gliomas (n=505) by immunohistochemistry (IHC) for protein levels of both PD-L1 and B7-H4. Gene coexpression analysis assessing clusters based on extent of PD-L1/B7-H4 classifier genes expression were investigated in two transcriptome datasets (The Cancer Genome Atlas and Chinese Glioma Genome Atlas). In addition, levels of immune cell infiltrates were estimated with IHC and RNA-seq data for assessing the tumor immune microenvironment of PD-L1/B7-H4 subgroups.
Results High expression of PD-L1 and B7-H4 in gliomas was 23% and 20%, respectively, whereas coexpression of two proteins at high levels was limited to 2% of the cases. Comparable results were seen in RNA-seq datasets where PD-L1 mRNA expression levels negatively correlated with that of B7-H4. Gene coexpression modules clustered within each grade of gliomas demonstrated lack of double-high modules (cluster with high expression of both PD-L1 and B7-H4 classifier genes). B7-H4 mRNA expression levels showed negative correlation with extent of immune cell infiltration and High-B7-H4 module gliomas (high B7-H4 but low PD-L1 classifier genes expression) had less tumor-infiltrating lymphocytes (TILs) and tumor-associated macrophages (TAMs). IHC assessment also showed few TILs and TAMs in High-B7-H4 subgroup gliomas.
Conclusions The majority of gliomas express PD-L1 or B7-H4, however, coexpression of both at high levels is minimal. The high-B7-H4 patients could be considered as ‘super-cold’ gliomas with significantly deficient in TILs, suggesting that B7-H4 might inhibit T-cell trafficking into the central nervous system. This study demonstrated that PD-L1 and B7-H4 may serve as mutually compensatory immune checkpoint molecules in gliomas for immune targeted or active-specific immunotherapy. The distinct B7-H4 pathways modulating T-cell function and immune evasion in glioma patients deserved to be further explored in the future during immunotherapy.
- neurooncology
- immunology
- tumor biomarkers
- tumor microenvironment
This is an open access article distributed in accordance with the Creative Commons Attribution Non Commercial (CC BY-NC 4.0) license, which permits others to distribute, remix, adapt, build upon this work non-commercially, and license their derivative works on different terms, provided the original work is properly cited, appropriate credit is given, any changes made indicated, and the use is non-commercial. See http://creativecommons.org/licenses/by-nc/4.0/.
Statistics from Altmetric.com
Background
Tumor immunotherapy has shown significant breakthroughs in recent years, particularly with the approval of immune checkpoints inhibitors (ICIs) and T-cell therapy.1 Studies with ICIs have demonstrated durable clinical responses and prolonged survival in various solid tumors such as melanoma, targeting programmed death 1 (PD-1) and programmed death ligand 1 (PD-L1) molecules.2 Since the dogma that the central nervous system (CNS) is an immune-privileged site for tumors has been challenged with recent immune profiling studies, immunotherapy has been used more frequently to treat gliomas, the most common and lethal tumor in the CNS.3 Although the immunotherapy has increasing appeal for the treatment of cancer, only a fraction of specific cancer type patients has overall long-term survival benefits.2 4 Clinically, useful immune-related biomarkers are needed to define which patients will benefit and to triage patients into optimal immunotherapy protocols.
The PD-L1 expression in tumor microenvironment (TME) has been considered as a predictive biomarker for anti-PD-1/PD-L1 therapies. High PD-L1 expression in patients was correlated with high response rate for PD-1/PD-L1 blockade.5 6 Nevertheless, therapeutic resistance in patients with high PD-L1 expression and immunotherapy-insensitivity in those with low PD-L1 expression necessitate characterization of additional immunosuppressive biomarkers and a deeper understanding of immune escape mechanisms.7 Previous studies demonstrated that the majority of gliomas were PD-L1 positive but only a small number of patients had high expression.8 9 Despite various clinical trials with PD-1/PD-L1 inhibitors in gliomas, the utility and reliability of PD-L1 as an immunosuppressive biomarker remains insufficient.3
B7-H4 (B7x /B7S1) is one of the T-cell costimulatory and coinhibitory B7 family molecules overexpressed in various malignant tumors, including gliomas.10 We have recently reported that B7-H4 expression is associated with glioma grade and clinical outcome.11 In addition, blockade of B7-H4 has been shown to enhance T-cell activation.12 In our previous study, we demonstrated that B7-H4 activation in glioma associated macrophage/microglia establishes a cross-talk with glioma stem cells, which leads to immunosuppression.11 Considering mutual exclusive expression of PD-L1 and B7-H4 in lung cancer13–15 and breast cancer,16 and that glioblastoma multiforme (GBM) patients with low expression of B7-H4 benefited from dendritic cell (DC) vaccine,4 we speculated that B7-H4 may be another promising biomarker for immunotherapy in glioma patients as a supplement for PD-L1. Nevertheless, the relationship between PD-L1 and B7-H4 in gliomas remains unexplored.
In this study, using immunohistochemistry (IHC), we evaluated protein levels of PD-L1 and B7-H4 in a large glioma patient cohort in order to determine their coexpression status. Two transcriptomics datasets with mRNA expression were also used to investigate the relationship between PD-L1 and B7-H4 by correlation and gene coexpression module analyzes. To a significant extent, we found limited coexpression of PD-L1 and B7-H4, which indicates that the PD-L1 alone is not sufficient to define immune evasion strategy in gliomas and that B7-H4 is also a significant component of the immune escape mechanism.
Methods
Specimens and tissue microarrays
Archival FFPE (formalin fixed paraffin embedded) tumor tissue sections were obtained from patients diagnosed with primary gliomas(n=505) when undergone tumor resection between 2001 and 2017 at the Department of Neurosurgery, Huashan Hospital, Fudan University. Three FFPE tissue microarrays (TMA) sections including 276 samples were prepared using 1.5 mm tissue cores, and the other 229 specimens were overlapped as described previously.4 The tumor area for each core in TMA was confirmed by the neuropathologist using HE staining. Detailed clinicopathological characteristics are available in online supplementary table S1 ( online supplementary additional file 2: table S1 ).
Supplemental material
Immunohistochemistry
FFPE glioma tumor tissue sections were deparaffinized in xylene and rehydrated through a graded series of ethanol concentrations; the sections were blocked with 3% H2O2 for 20 min at room temperature. Sections for B7-H4 and CD3 were retrieved by Tris-Ethylene Diamine Tetraacetie Acid (EDTA, pH=9.0) and sodium citrate buffer (pH=6.0) respectively, and sections for PD-L1 and CD163 were retrieved by lycium hydrochloric acid (pH=6.0). B7-H4 antibody (Ab), PD-L1 Ab and CD3 Ab were diluted at the same dilution of 1:100, while CD163 Ab was diluted at 1:50. After incubated overnight at 4℃, primary Abs were washed out and followed by VECTASTAIN ABC kit (PK-6200) for 30 min. DAB substrate kit (SK4100) was used to develop DAB chromogen and Hematoxylin staining solution was used to stain nuclei. The PD-L1, CD3 and CD163 Abs have been validated in gliomas by previous studies (online supplementary additional file 2: table S2). For B7-H4 Ab, GL261 cells transfected with human B7-H4 gene were prepared as FFPE cell blocks (online supplementary additional file 4: supplementary materials and methods, additional file 1: figure S1); IHC was performed with or without primary Ab as positive and negative controls, respectively. FFPE cell blocks derived from GL261 cells transfected with an empty vector were used for negative controls. B7-H4-positive GL261 cells showed brownish stain while cells in negative controls were stained with hematoxylin showing blue nuclei (online supplementary additional file 1: figure S1). Moreover, the staining in normal control brain tissues (non-tumor tissues) with primary Abs (online supplementary additional file 1: figure S1) and in the tumor tissue sections without primary Abs were conducted as negative controls for each targeted protein.
Supplemental material
Supplemental material
Manual quantification of IHC
B7-H4 and PD-L1 specific IHC staining was semiquantitatively scored based on the intensity and percentage as previously described.4 11 Briefly, the cells with partial or complete IHC staining at any intensity are considered as positive cells. The positive reaction of B7-H4/PD-L1 was scored into four grades according to the intensity of the staining: 0, 1, 2 and 3. The percentages of B7-H4/PD-L1–positive cells were also scored into four categories: 0 (0%), 1 (1%–33%), 2 (34%–66%) and 3 (67%–100%). The sum of the intensity and percentage scores was used as the final IHC score from 0 to 6. The staining pattern of the tissues was defined as follows according to the final IHC score: low expression, 0–2; high expression, 3–6. Extent of TIL presence in TMA slide cores was assessed by semiquantitative measurement of the density of CD3 positive (CD3+) cells, and was scored as previously published9 17: 1, no (less than four TILs in the entire specimen) or sporadic (more than four but no accumulation) CD3+ cells; 2, moderate numbers of CD3+ cells (single areas with accumulation of TILs); 3, abundant occurrence of CD3+ cells (TILs throughout the tumor section); and 4, highly abundant occurrence of CD3+ cells (high frequency of TILs throughout the entire tumor section). The IHC of CD163 was assessed as the percentage of positive cells related to the total cell number.
The IHC staining was analyzed by two observers blinded to clinical characteristics. A consensus for the final scores of PD-L1, B7-H4 and CD3 were reached for each sample, and the mean number of positive proportions from two observers was calculated for CD163. Representative photographs of each category for staining intensity and percentage of PD-L1/B7-H4 were shown in online supplementary figure S2 (online supplementary additional file 1: figure S2). Fleiss’s kappa for the categorical values (high expression and low expression for PD-L1/B7-H4) and ranked numerical values (1, 2, 3 and 4 for CD3+) were calculated for the interobserver agreement between two observers. The correlation analysis based on Spearman’s testing for continuous numerical values (positive proportion for CD163+) was performed to eliminate a potential interobserver variation of manual quantification. Concordant agreements were observed for the interobserver assessment in each protein molecule assessed (online supplementary additional file 2: table S3 and S4).
Transcriptome data analysis
Two published glioma transcriptome datasets were downloaded from The Cancer Genome Atlas (TCGA) and Chinese Glioma Genome Atlas (CGGA).18 19 RNA sequencing (RNA-seq) expression data were further normalized using upper quartile FPKM (FPKM-UQ) as described in TCGA website. The RNA-seq data were log2 transformed before analysis between several groups. Patient demographics were obtained from each data portal. Differentially expressed genes (DEGs) between different groups were identified using DESeq2 package20 with the criteria of |fold change|>2 and the false discovery rate <0.05).
Prediction of PD-L1/B7-H4 classifier genes and clustering analysis
In order to identify PD-L1/B7-H4 classifier genes (genes that are coexpressed with PD-L1 or B7-H4) in the training dataset (TCGA), we used biweight midcorrelation (bicor) to evaluate ‘similarity’ between gene expression profiles, which is thought to be a good measurement for gene coexpression module analysis.21 First, bicor for each pair of genes was calculated, and the 95th percentile of the bicor values was defined as the cut-off, which was 0.37027. Genes whose patterns are highly correlated to PD-L1 or B7-H4 were further selected if positively correlated with each other (the bicor values are larger than the cut-off). Finally, 62 PD-L1 classifier genes and 35 B7-H4 classifier genes were determined ( online supplementary additional file 2: table S5 ).
We performed non-negative matrix factorization (NMF) algorithm with the R package NMF22 to define glioma clusters.23 The following steps were used to determine the optimal factorization rank (the number of clusters) in each data set: (1) Random expression data were generated by permutating columns (patients) in the original dataset; (2) We performed 100 runs of NMF and select the best fitted model for both the original and the corresponding random data sets with rank from 2 to 7, and obtained the residual sum of squares (RSS) for each rank; (3) The smallest rank was selected if RSS decrease is less than that in random data as described previously.24 With the optimal rank k, the partitioning around medoids algorithm was used to perform clustering on the coefficient matrix of each run of the corresponding NMF model where the number of clusters is k. The consensus matrix of clustering was then generated and the final clusters of samples were determined by cutting the hierarchical clustering of the consensus matrix into k groups.
Bioinformatic analysis
The R package ESTIMATE (Estimation of STromal and Immune cells in MAlignant Tumour tissues using Expression data) was applied to predict tumor purity based on the estimation of stromal and immune scores in tumor tissues using gene expression data.25 Samples from TCGA having genomic sequencing data were labeled with ABSOLUTE purity instead of ESTIMATE purity and were extracted from previous paper.26 The gene set variation analysis (GSVA) package of R was used to calculate infiltrating scores for 22 immune cell subtypes and microglia.27 In order to rule out possible bias from different algorithms, we calculated absolute immune cell fractions for 22 immune cell populations with CIBERSORT (Cell-type Identification By Estimating Relative Subsets Of RNA Transcripts),28 followed by being corrected using tumor purity per sample.29 Gene ontology (GO) term enrichment analysis was carried out with R language using clusterProfiler packages.30 Two gene sets extracted from the Molecular Signatures Database (immune system process, M13664; immune response M19817) were used to profile immune phenotype between modules using principal components analysis (PCA).31 Ontology gene sets were obtained from MSigDB32 and the results of gene set enrichment analysis (GSEA) were visualized by cluster Profiler package.30
Statistical analyses
Spearman’s rank correlation coefficient was used for correlation analysis. χ2 test or Fisher’s exact test was used for categorical variables and differences in continuous variables between groups were evaluated by t-test or one-way analysis of variance. All tests were two-sided performed by SPSS software or R language and p<0.05 was considered statistically significant labeled with * for p<0.05, ** for p<0.01, *** for p<0.001, and **** for p<0.0001.
Results
Assessment of PD-L1 and B7-H4 expression in gliomas
Although the majority of newly diagnosed gliomas patients were PD-L1-positive (61%, IHC score >0) in the IHC cohort (n=505), only 23.4% of them were defined as high expression of PD-L1 (IHC score >2). For GBM patients in this cohort, about 73.5% samples were PD-L1-positive while 29.1% were determined as high expression. For lower grade gliomas (LGG, grades II and III), we found that 49.4% of patients expressed PD-L1 while 18.5% expressed it at high levels. The relationship between PD-L1 expression and clinicopathological variables were investigated as shown in online supplementary table S6 ( online supplementary additional file 2: table S6 ). Tumor location, histology, WHO grade and IDH gene status had a significant correlation with PD-L1 expression. The percentages of B7-H4-positive and B7-H4 high-expression samples were 54.1% and 19.6% in the IHC cohort, 53.8% and 14.1% in GBM patients, and 54.2% and 24.4% in LGG patients, respectively. The B7-H4 expression was significantly associated with gender, histology, WHO grade, TERT gene status and chromosome 1 p/19q (Chr1p/19q) status ( online supplementary additional file 2: table S6 ).
PD-L1 and B7-H4 coexpression is limited in gliomas
In the cohort assessed for IHC (n=505), 61% of glioma patients had low expression of both PD-L1 and B7-H4 (double-low subgroup), 20% had high expression of PD-L1 but low expression of B7-H4 (high-PD-L1 subgroup) and 17% had high expression of B7-H4 but low expression of PD-L1 (high-B7-H4 subgroup). Interestingly, only 2% of the patients had high expression of both PD-L1 and B7-H4 (double-high subgroup, figure 1A). Significant associations were detected in histology, WHO grade, IDH status, TERT gene status and Chr1p/19q status among PD-L1/B7 H4 subgroups ( online supplementary additional file 1: figure S3 and additional file 2: table S7 ). Representatives of these subgroups with mutually exclusive expression of PD-L1 and B7-H4 are shown in figure 1B. Moreover, H-scores of PD-L1 and B7-H4 in TMA cores ( online supplementary additional file 4: online supplementary materials and methods ) also showed limited coexpression of both biomarkers ( online supplementary additional file 1: figure S4 ).
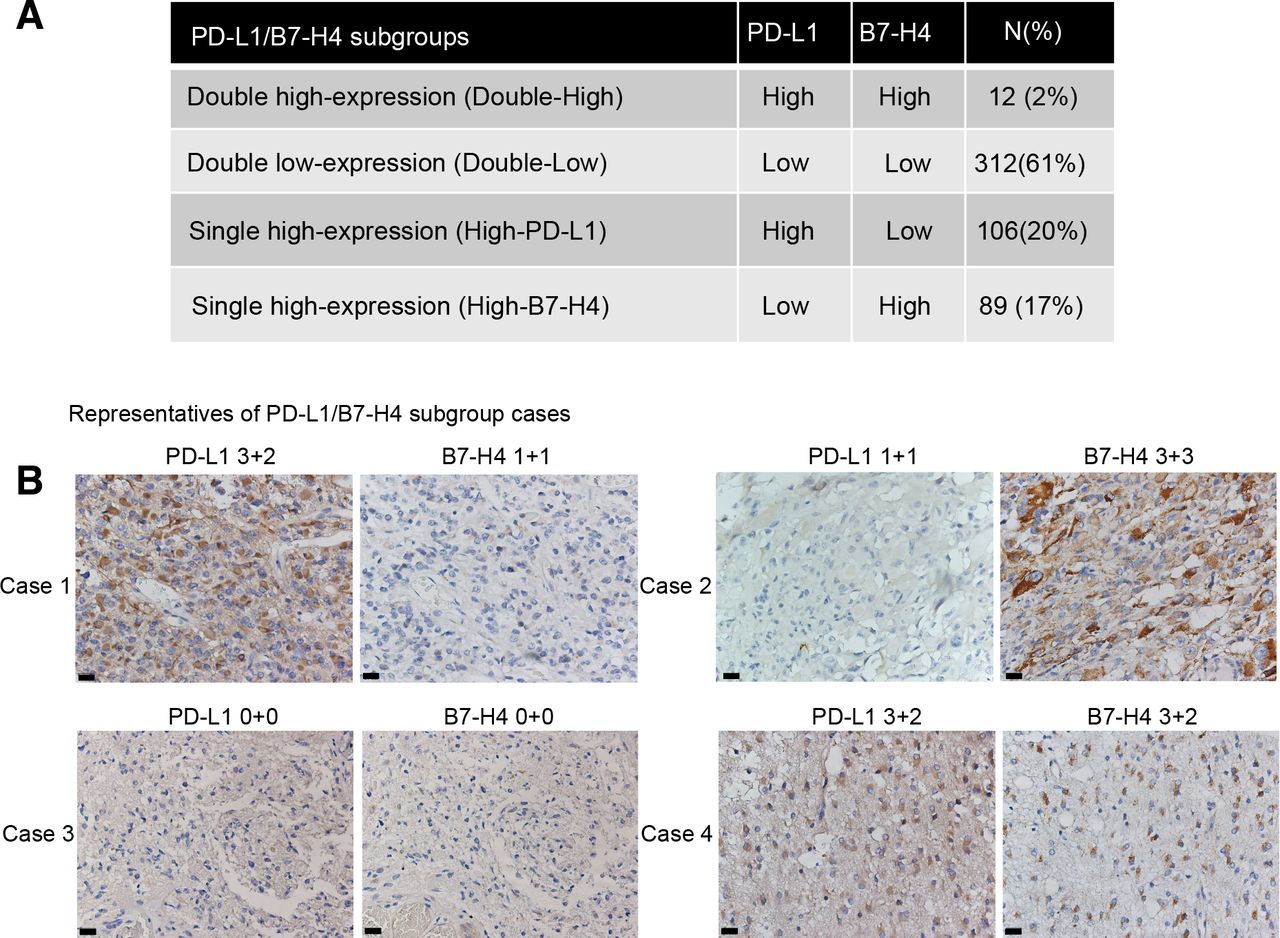
Coexpression with high level of both PD-L1 and B7-H4 expression was limited in the IHC cohort. Distributions of PD-L1/B7-H4 subgroups in gliomas (A). Representative cases of PD-L1/B7-H4 subgroups were shown with the same area for per sample: case 1, High-PD-L1 subgroup; case 2, high-B7-H4 subgroup; case 3, double-Low subgroup; case 4, double-High subgroup (B). Magnification, ×40 objective; Bar, 20 um. PD-L1, programmed death ligand 1.
In order to avoid possible bias by tumor tissue sampling in the TMA cores, we analyzed the mRNA expression levels of PD-L1and B7-H4 based on two published RNA-seq datasets obtained from TCGA and CGGA. As shown in figure 2, a similarly restricted coexpression pattern was observed in TCGA cohort ( figure 2A, n=666) and CGGA cohort ( figure 2B, n=305) with significant negative correlation between PD-L1 and B7-H4. Moreover, we found most other checkpoint immune molecules that have been verified as therapeutic targets in clinical or preclinical trials were tightly associated with PD-L1 while demonstrating mutually exclusive expression with B7-H4 (figure 2).
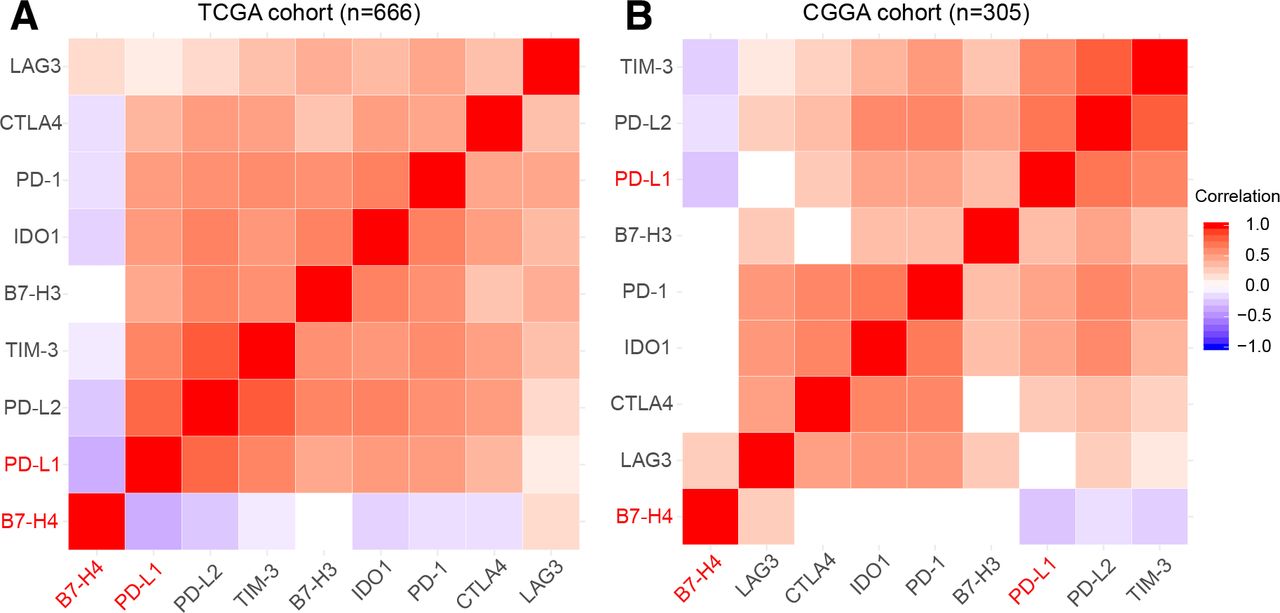
Correlation analysis between estimable checkpoint molecules in two transcriptome datasets showed mutual exclusive expression profiles between PD-L1 and B7-H4. TCGA dataset (A). CGGA dataset (B). CGGA, Chinese Glioma Genome Atlas; PD-L1, programmed death ligand 1; TCGA, The Cancer Genome Atlas.
Identification of PD-L1/B7-H4 classifier genes
Identification of gene coexpression modules around key signaling pathways may enable molecular classification of gliomas. We, therefore, decided to generate gene coexpression modules by classifier genes that are strongly associated with PD-L1 and B7-H4 using transcriptomics datasets. The classifier genes were extracted from TCGA training set (n=666), identifying genes with similar expression patterns with PD-L1 (62 genes) and B7-H4 (35 genes), analyzes of which could help decipher key signaling pathways related to these molecules ( online supplementary additional file 2: table S5 ). GO analysis for classifier genes revealed that they were significantly enriched in many biological processes related to immune responses and intercellular communication ( online supplementary additional file 2: table S8 ).
PD-L1/B7-H4 classifier genes identified glioma subtypes
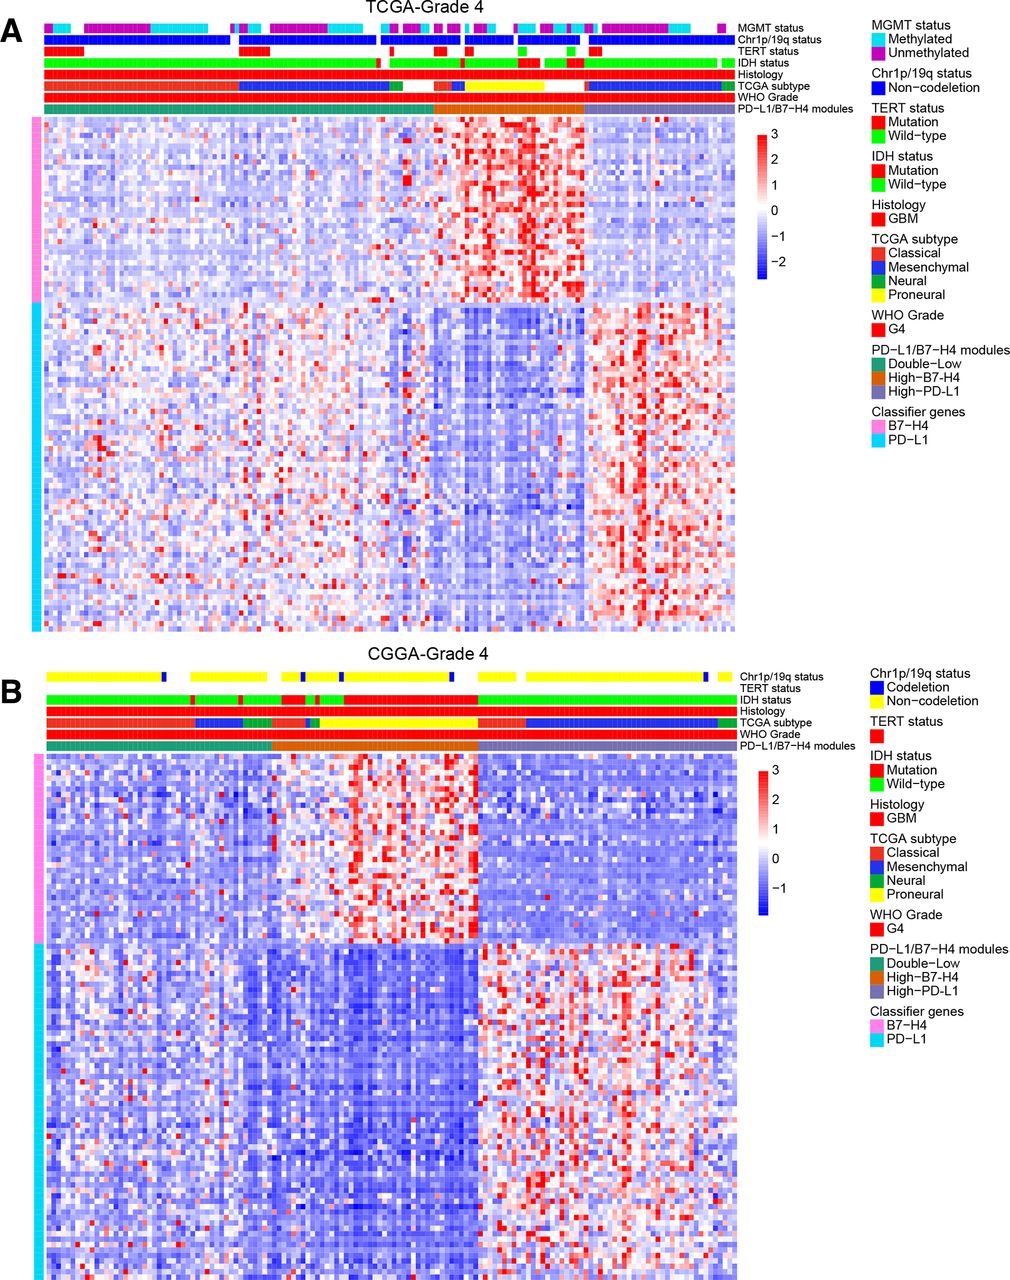
According to the expression profiles of predicted PD-L1/B7-H4 classifier genes, each grade of gliomas from TCGA could be classified into three new subtypes: high-PD-L1 (high expression of PD-L1 but low expression of B7-H4 classifier genes), high-B7-H4 (high expression of B7-H4 but low expression of PD-L1 classifier genes) and double-low modules (low expression of both PD-L1 and B7-H4 classifier genes) ( figure 3A and online supplementary additional file 1: figures S5a and S6a ). Here, we confirmed that high-PD-L1 module gliomas highly expressed PD-L1 with lower levels of B7-H4 while High-B7-H4 module gliomas highly expressed B7-H4 with lower levels of PD-L1 ( online supplementary additional file 1: figures S5b, S6b and S7a ). Strikingly, we found there was no double-High module (high PD-L1 and high B7-H4 classifier genes expression) which supported our previous finding of a restricted coexpression pattern between PD-L1 and B7-H4. We then used the transcriptome dataset from CGGA to validate such classification criteria (figure 3B and online supplementary additional file 1: figures S7-S9). The number of possible glioma subtypes was determined based on appropriate rank number with stable cophenetic correlation coefficients, which is consistent with the above observations (online supplementary additional file 1: figures S10-S12). In addition, most of the clinicopathological parameters exhibited statistically significant differences between different subtypes for each grade, such as age, histology, TCGA subtype and molecular classifications ( online supplementary additional file 2: tables S9-S14 ). Further investigation of the relationship between new subtypes and known TCGA subtypes revealed that almost all of the mesenchymal subtype belonged to the high-PD-L1 subtype, whereas the high-B7-H4 subtype mainly were contained in the proneural subtype.

Gene coexpression modules in each glioma grade using PD-L1/B7-H4 classifier genes showed mutual exclusive expression profiles in RNA-seq datasets without double-High modules. The appropriate numbers of clusters were determined as mentioned in Methods (additional file 1: online supplementary additional file 1: figures S10-S12). The grade 4 gliomas in TCGA dataset were clustered into three modules (A). The grade 4 gliomas in CGGA dataset were clustered into four modules (additional file 1: online supplementary additional file 1: figure S33) and could be combined into three modules (B). CGGA, Chinese Glioma Genome Atlas; PD-L1, programmed death ligand 1; TCGA, The Cancer Genome Atlas.
Immune microenvironment is differentially activated in PD-L1/B7-H4 modules
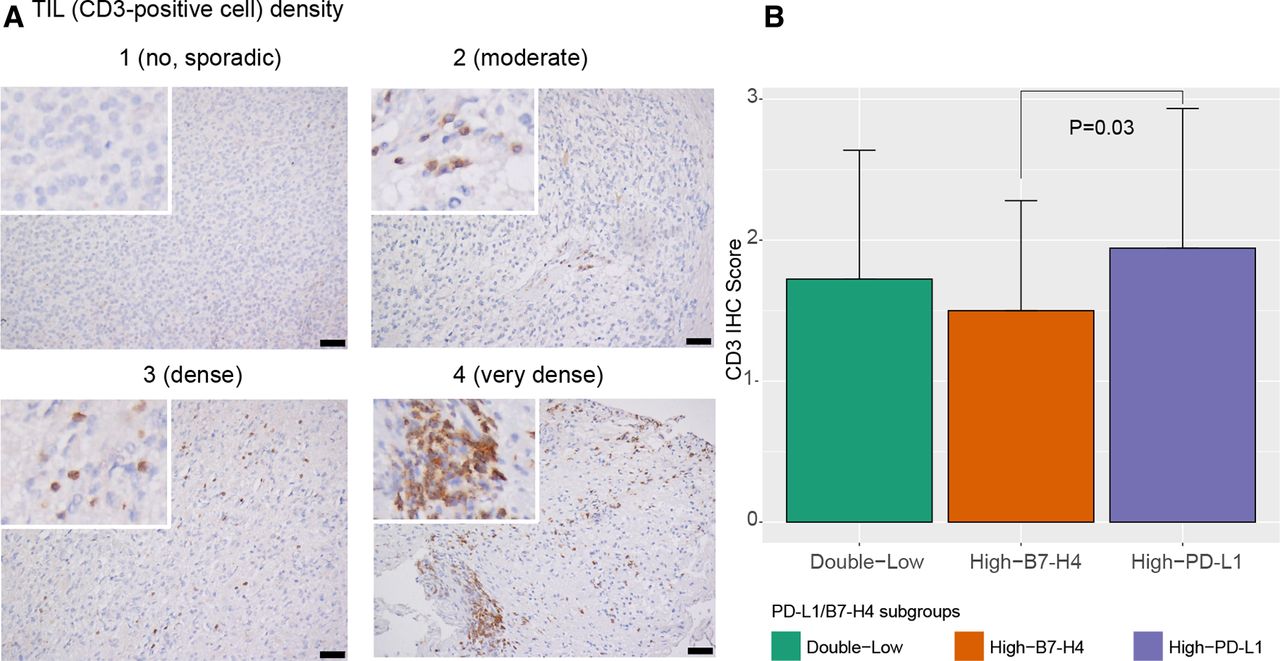
Considering that many PD-L1/B7-H4 classifier genes are related to tumor–immune system interactions, it is possible that modules defined by PD-L1/B7-H4 signatures may be distinct in terms of the tumor immune microenvironment. Indeed, the immune and stromal score calculated by ESTIMATE in TCGA set revealed that gliomas in the High-PD-L1 module had more immune cell infiltrations whereas a significantly smaller immune infiltrating score was obtained for High-B7-H4 module ( figure 4A and online supplementary additional file 1: figures S13a and S14a ). We also found that high-B7-H4 module had higher tumor purity has been shown to contribute to poor immune cell infiltration ( figure 4B and online supplementary additional file 1: figures S13b and S14b ). The GSVA score represented the extent of 23 immune cells infiltrations suggested smaller fractions of TILs and tumor-associated macrophages (TAMs) in the high-B7-H4 module ( figure 4C and online supplementary additional file 1: figures S13c and S14c ). Further evaluation of absolute fractions of different immune cell types verified that high-PD-L1 module tumors had more TILs and TAMs than tumors of the high-B7-H4 module ( online supplementary additional file 1: figures S15a, S16a and S17a ). The data from CGGA validation dataset also showed that high-B7-H4 module gliomas were deficient of TILs in the TME ( online supplementary additional file 1: figures S15b, S16b, S17b and S18-S20 ). Correlation analysis revealed that B7-H4 expression level negatively correlates with TILs and TAMs presence ( online supplementary additional file 1: figures S21-S25 ). We performed IHC staining of CD3 and CD163 in TMA cores to determine the presence of TILs and TAMs in PD-L1/B7-H4 subgroups, respectively, and found that gliomas in the high-B7-H4 subgroup gliomas appeared as ‘super-cold’ tumors with less TILs and TAMs compared with high-PD-L1 subgroup ( figure 5 and online supplementary additional file 1: figure S26 ).

Assessment of tumor immune microenvironment among PD-L1/B7-H4 modules in grade 4 gliomas from TCGA dataset. ESTIMATE evaluation showed less immune infiltration in high-B7-H4 module (A). High-B7-H4 module gliomas had higher tumor purity (B). Comparison of GSVA score representing the extent of immune cell infiltration between modules demonstrated the reduction of immune cells in high-B7-H4 modules (C). GSVA, gene set variation analysis; PD-L1, programmed death ligand 1; TCGA, The Cancer Genome Atlas.
Difference in TILs (CD3 positive cell) density among PD-L1/B7-H4 subgroup gliomas in TMA slides. Representative examples of TIL infiltration with CD3+ IHC score: 1, no or sporadic CD3+ cells; 2, moderate numbers of CD3+ cells; 3, abundant occurrence of CD3+ cells; and 4, highly abundant occurrence of CD3+ cells (A). Comparation of CD3+ IHC score showed that High-B7-H4 subgroup gliomas had less TIL infiltration than high-PD-L1 subgroup gliomas (B). Magnification, ×20 objective; Bar, 50 μm. IHC, immunohistochemistry; PD-L1, programmed death ligand 1; TILs, tumor-infiltrating lymphocytes; TMA, tumor-associated macrophage.
Considering such distinct levels of immune cell infiltration among PD-L1/B7-H4 modules, we explored the differences between High-PD-L1 module and High-B7-H4 module gliomas using immune-related gene sets and whole genome expression data. The PCA analysis showed remarkable differences between High-PD-L1 and High-B7-H4 modules in immune phenotype and whole genome expression signature for each grade gliomas ( online supplementary additional file 1: figures S27-S29 ). Next, we detailed these findings with GSEA analysis between high-PD-L1 and high-B7-H4 modules. Here, we found that many immune response pathways were enriched in high-PD-L1 module gliomas, such as T-cell receptor signaling pathway, regulation of antigen processing and presentation, macrophage differentiation status and toll-like receptor signaling pathway ( online supplementary additional file 1: figure S30 ). DEGs were obtained within each glioma grade from two datasets, and DEGs shared between high-PD-L1 and high-B7-H4 modules were identified ( online supplementary additional file 1: figure S31 and additional file 3: table S15 ).
Discussion
Previous studies have shown that the majority of gliomas expressed PD-L1 with low intensity,8 9 whereas less information is known about B7-H4 expression landscape in large glioma cohorts. Meanwhile, the coexpression status of PD-L1and B7-H4 in gliomas is unknown. In our current study, protein levels of PD-L1 and B7-H4 were assessed in 505 glioma patients through IHC analysis. Although PD-L1 was found to be expressed in the majority of this cohort, only 23% had a high expression of this protein. Similarly, B7-H4 protein was detected in >50% of glioma samples, whereby it was highly expressed in 20% of samples. As previously reported in lung and breast cancer,13–16 we noticed that coexpression of PD-L1 and B7-H4 in gliomas was an infrequent event (2%). The lack of double-high subgroup (high expression of both PD-L1 and B7-H4) suggested that distinct immune evasion pathways existed for the glioma subgroups in our study. Our findings can be used as a potential strategy for targeting these alternative immune checkpoint molecules such as B7-H4 in subgroups with low PD-L1 expression.
The limitation of our study is that the IHC glioma cohort was selected retrospectively from samples with available clinical information. Insufficient tumor representation by single core in TMA samples also may have induced bias. However, we accounted for this by verifying the expression profiles in two different transcriptome datasets with correlation analysis and gene coexpression modules. Molecular classification based on stable unbiased gene expression clusters has been shown capable of identifying intrinsic features around key signaling pathways.23 33 Classifier genes demonstrating similar gene expression patterns with PD-L1 and B7-H4 were identified and shown to be enriched in immune-related mechanisms. We believe that the PD-L1/B7-H4 molecules clustered by the classifier genes distinctively activate the glioma immune microenvironment. In line with this, PD-L1/B7-H4 coexpression modules were clustered without a double-high module (high expression of both PD-L1 and B7-H4 classifier genes), which suggested that the mechanisms associated with PD-L1 and B7-H4 might lead to distinct immunophenotype classification of gliomas. We established our coexpression modules in each glioma grades, respectively, to reduce the bias from WHO grade in this study, which showed the limited coexpression pattern and different immune cell infiltrations regardless of the WHO grades.
It was previously reported that PD-L1 expression and TIL infiltration are distinguishing features for immunotherapy sensitivity.34 Classification of TME based on PD-L1 and TILs determined two major immunophenotypes— ‘hot and cold tumors’.35 Hot tumors have higher potential to benefit from PD-1/PD-L1 blockade or other immunotherapies due to existence of tumor-specific T-cells. We observed that high-PD-L1 module gliomas exhibited more TILs compared with other PD-L1/B7-H4 modules in our study. The mesenchymal subtype is considered to be more responsive to immune-based therapies because of higher number of TILs.36 Accordingly, the mesenchymal subtype was mainly clustered in high-PD-L1 modules in our study. Therefore, gliomas with high PD-L1 expression or PD-L1-related pathways enrichment may potentially benefit from PD-1/PD-L1 blockade owing to pre-existing TILs. However, previous studies indicated that PD-L1 can also be expressed on tumor cells as a result of oncogenic signaling, even in the absence of TILs, which can account for resistance to PD-1/PD-L1 ICIs immunotherapy regardless of high PD-L1 levels.35 In our study, we also observed the presence of gliomas harboring significantly less TILs within the high-PD-L1 module. A deeper interrogation of these tumors with accurate sub clustering will be instrumental for triaging patients using PD-1/PD-L1 inhibitors. Furthermore, in our High-PD-L1 module, we found high expression of other immunosuppressive molecules, such as CTLA-4, TIM3, LAG3 and IDO1, all of which showed positive correlation with PD-L1 mRNA levels. Combination therapies with PD-1/PD-L1 inhibitors and agents targeting these immunosuppressive molecules may be a promising approach towards eliminating resistance against single-agent therapies.2
In contrast to the High-PD-L1 subgroup, high-B7-H4 gliomas were detected with less TILs and TAMs. Considering that gliomas have been labeled as ‘cold tumors’ as a feature of primary intracranial tumors when compared with other solid tumors,37 gliomas with high B7-H4 expression or B7-H4-related pathways in this study may behave as a ‘super-cold’ tumors, which are insensitive to existing forms of glioma immunotherapies due to the absence of specific TILs. We downloaded RNA-seq data from two cohorts of melanoma (n=49)38 and non-small cell lung cancer (n=21) patients treated with anti-PD-1 Abs ( online supplementary additional file 4: supplementary materials and methods ), both of which demonstrated that higher B7-H4 expression levels in non-responders were close to statistical significance ( online supplementary additional file 1: figure S32 ). Another study also had confirmed a negative predictive role of B7-H4 in non-small cell lung cancer patients receiving nivolumab based on IHC scores.39 Moreover, in our clinical trial for DC vaccine in GBM patients, we reported no clinical response in patients with high B7-H4 IHC score.4 The data from clinical patients mentioned above indicated that treatment with agents targeting B7-H4 or B7-H4-mediated immune escape mechanisms may be more effective than PD-1/PD-L1 checkpoint inhibitors or DC vaccines alone for these tumors. However, the role of B7-H4 in glioma immunotherapy or even other brain metastasis tumors still deserves further research using larger clinical immunotherapy trials and concurrent functional studies, as well as the studies exploring development of anti-B7-H4 immunotherapy protocols. PD-L1/B7-H4 signatures demonstrated an underlying association with specific relevant immune phenotype classification in gliomas.
Conclusions
In summary, we assessed the expression patterns of PD-L1 and B7-H4 in a large cohort of glioma patients and found mutually exclusive associations between them, which is helpful to decipher prominent and nonoverlapping immune escape pathways. Identification of PD-L1/B7-H4-related gene coexpression modules may be useful to define new subtypes of gliomas and elucidating molecular mechanisms underlying tumor immune escape. We found B7-H4 expression negatively correlated with TILs presence which indicated that B7-H4 might inhibit T-cell trafficking into the CNS. Distinct immune microenvironment profiles between PD-L1/B7-H4 modules offers a promising avenue for the development of glioma immunotherapy strategies using PD-L1 and B7-H4 as biomarkers. Future studies are needed to uncover underlying biological mechanisms for alternative immune regulatory checkpoints and clinically useful biomarkers such as B7-H4, especially in gliomas with low expression of PD-L1.
Supplemental material
Acknowledgments
We thank Joseph A Barnes for editing the manuscript.
References
Footnotes
DC, GL and CJ contributed equally.
Contributors Conception and design: DC, YY and LZ; Development of methodology: DC, GL, CJ, QL and YZ; Acquisition and analysis of data (eg, statistical analysis, computational analysis): DC, GL, CJ, QL, YQ, CT, JX and FBAY; Writing, review and/or revision of the manuscript: DC, GL, JH, DSBH, FBAY, YY and LZ; Study supervision: YZ, YY and LZ.
Funding This project is supported by the National Natural Science Foundation of China (no. 81572478, no. 91959112 and no. 81372708 to YY; no. 31771407 to YZ); Shanghai Anticancer Association EYAS PROJECT (no. SACA-CY1A01 to DC); Science and Technology Innovation Committee of Shenzhen Municipality (no. JCYJ20180305124023495 to YZ).
Competing interests No, there are no competing interests.
Patient consent for publication Not required.
Ethics approval The study was approved by the Huashan Hospital IRB protocol (KY2016-400).
Provenance and peer review Not commissioned; externally peer reviewed.
Data availability statement Data are available on reasonable request. The datasets used and/or analyzed during the current study are available from the corresponding author on reasonable request.