Article Text

Abstract
Background Immunotherapy with IFNβ is a promising strategy for treating malignant glioma. However, systemic administration of IFNβ is inadequate because of low intratumoral concentration and major adverse effects. This study aimed to determine whether mesenchymal stem cells (MSCs) can be used as cellular vehicles to locally deliver IFNβ for glioma therapy by using in vivo MRI tracking.
Methods A recombinant lentiviral vector encoding IFNβ and ferritin heavy chain (FTH) reporter genes was constructed to transduce MSCs. The effectiveness and safety of transduction were assessed. After the IFNβ and FTH overexpressed MSCs (IFNβ-FTH-MSCs) were transplanted into intracranial orthotopic rat F98 gliomas via peritumoral, intracerebral, intratumoral or intra-arterial injection, MRI was performed to track IFNβ-FTH-MSCs and to evaluate their therapeutic effect on glioma in vivo, as validated by histologic analysis, quantitative PCR and ELISA assays.
Results MSCs were efficiently and safely transduced to upregulate their IFNβ secretion and FTH expression by the constructed lentivirus. After peritumoral injection, IFNβ-FTH-MSCs appeared as hypointense signals on MRI, which gradually diminished but remained visible until 11 days. Compared with other administration routes, only peritumoral injection of IFNβ-FTH-MSCs showed a remarkable inhibition on the glioma growth. Nearly 30% of IFNβ-FTH-MSCs survived up to 11 days after peritumoral injection, while most of IFNβ-FTH-MSCs injected via other routes died within 11 days. IFNβ-FTH-MSCs grafted peritumorally secreted IFNβ persistently, leading to pronounced Batf3+ dendritic cells and CD8+ T lymphocyte infiltration within the glioma.
Conclusions MSCs can be used as cellular vehicles of IFNβ to treat malignant glioma effectively via peritumoral injection.
- neurooncology
- molecular immunogene
- MRI
- image analysis
This is an open access article distributed in accordance with the Creative Commons Attribution Non Commercial (CC BY-NC 4.0) license, which permits others to distribute, remix, adapt, build upon this work non-commercially, and license their derivative works on different terms, provided the original work is properly cited, appropriate credit is given, any changes made indicated, and the use is non-commercial. See http://creativecommons.org/licenses/by-nc/4.0/.
Statistics from Altmetric.com
Background
Malignant glioma is the most common and deadly primary adult brain malignancy, with an increased incidence over the past two decades.1 Despite advances in standard-of-care treatment, that is, surgery followed by radiation and chemotherapy, as well as several recently proposed treatment regimens, such as targeting dysregulated cell signaling pathways or blocking angiogenesis, clinical outcome for patients with malignant glioma remains dismal.1–3 To date, the life expectancy for patients with glioblastoma is only 14.6 months, and the overall -year survival rate remains less than 5%.4
Immunotherapies that harness the immune system to fight tumor cells, rather than targeting the tumor itself, has achieved dramatic anti-tumor benefit in various types of cancers.5 Nonetheless, recent clinical trials have shown that the therapeutic effect of immunotherapy remained limited in malignant glioma.6 This suboptimal therapeutic outcome might be associated with a paucity of tumor-infiltrating lymphocytes in malignant gliomas, which are referred to as “cold” tumors, i.e., quiescent tumors in terms of immune reactivity.6 7 Recently, the increase of IFNβ level in the tumor microenvironment has been found to be essential for initiating specific T-cell responses against tumor cells, converting “cold” tumors to “hot” tumors.8 However, systemic administration of IFNβ only achieved limited success due to its major adverse outcomes and low intratumoral concentration.9 Therefore, a method to deliver IFNβ into the tumor in a precise and persistent manner is highly desired.
In recent years, mesenchymal stem cells (MSCs) have been increasingly used in tumor therapy.10 For example, MSCs can be used as ideal delivery vehicles for therapeutic genes into glioma, owing to their remarkable tropism to glioma, lack of immunogenicity, and the ease to obtain and expand them without raising ethical concerns.11 Nevertheless, whether MSCs can be used as cellular vehicles to precisely and persistently deliver IFNβ into the malignant glioma remains to be determined.
When stem cells are used as therapeutic vehicles, non-invasive in vivo tracking of these cells is essential to ensure the precise delivery and to determine the best administration route.12 In a previous study, we have genetically modified MSCs with ferritin heavy chain (FTH) reporter gene and found that FTH-based MRI could track the tropism and fate of MSCs in an intracranial orthotopic rat glioma model in vivo.13 In the present study, we transduced MSCs with a recombinant lentivirus encoding IFNβ and FTH to upregulate their IFNβ expression and to make them MRI visible. These IFNβ and FTH overexpressed MSCs were transplanted into rats bearing intracranial orthotopic glioma via different routes of administration. Then, serial MRI was performed to track these cells and determine their therapeutic efficacy. The purpose of this study is to determine whether MSCs can be used as cellular vehicles to deliver IFNβ for glioma therapy by using in vivo MRI tracking.
Methods
Lentiviral vector construction and MSC transduction
A lentiviral vector expressing rat IFNβ, FTH and enhanced green fluorescent protein (eGFP) was constructed (LV-IFNβ-T2A-FTH-eGFP). Rat MSCs were purchased from Cyagen Bioscience Technology (Guangzhou, China). MSCs were transduced with the lentivirus encoding IFNβ, FTH and eGFP to obtain IFNβ and FTH overexpressed MSCs (IFNβ-FTH-MSCs). MSCs transduced with the lentivirus encoding eGFP alone were used as a positive control group (eGFP-MSCs). Wild-type MSCs served as a normal control group (WT-MSCs). Details of the lentiviral vector construction and MSC transduction are given in online supplementary materials.
Supplemental material
In vitro Quantitative PCR (qPCR), ELISA and Western blot analysis were performed to detect the overexpression of IFNβ and FTH in IFNβ-FTH-MSCs; further details are presented in online supplementary materials.
Intracellular iron accumulation analysis
The overexpression of FTH gene can enhance the intracellular ferritin iron store, resulting in a corresponding signal change on MRI. Prussian blue (PB) staining and transmission electron microscopy (TEM) were performed to assess the intracellular iron accumulation in IFNβ-FTH-MSCs qualitatively. In vitro MRI and atomic absorption spectrometry (AAS) were performed to evaluate the intracellular iron accumulation in IFNβ-FTH-MSCs quantitatively. Details of PB staining, TEM, in vitro MRI and AAS are provided in online supplementary materials.
In vitro cytotoxicity assay
Cell viability, apoptosis, intracellular reactive oxygen species (ROS), phenotype, differential capability and migratory ability were assessed to determine the safety of lentivirus transduction, as previously described13; further details are given in online supplementary materials.
Intracranial orthotopic glioma model
Adult male Fisher 344 rats weighing 200–220 g were purchased from Beijing HFK Bioscience. In total, 5×10⁵ F98 cells were stereotaxically injected into the left striatum to establish an orthotopic intracranial glioma, which was confirmed by in vivo MRI 4 days after inoculation of tumor cells. Details of intracranial orthotopic glioma establishment are given in online supplementary materials.
Cell delivery
Four days after inoculation of F98 cells, when intracranial tumor burden had reached 3–5 mm3, animals were randomly allocated to receive different treatments including peritumoral injection of 2×10⁶ IFNβ-FTH-MSCs (PT group), intracerebral injection of 2×10⁶ IFNβ-FTH-MSCs (IC group), intratumoral injection of 2×10⁶ IFNβ-FTH-MSCs (IT group) and intra-internal carotid arterial injection of 2×10⁶ IFNβ-FTH-MSCs (IA group). Peritumoral injection of 2×10⁶ eGFP-MSCs (eGFP-MSCs group) and peritumoral injection of the same volume of PBS (PBS group) served as controls. The intratumoral injection was performed by stereotactic injection of IFNβ-FTH-MSCs directly into the tumor, using identical coordinates as orthotopic glioma establishment. Peritumoral and intracerebral injections were performed in an MRI-guided manner. Specifically, in vivo MRI was performed 1 day before MSC transplantation. Coronal T2-weighted images were obtained to identify the proper trajectory of the needle and then to determine the coordinates. For peritumoral injection, the needle tip was placed at the lateral border of the glioma and 3.5 mm depth from the pial surface, then MSCs were injected laterally on the border between tumor mass and normal brain parenchyma. For intracerebral injection, the needle tip was placed 2.5 mm left to glioma and 3.5 mm depth from the pial surface, then MSCs were injected laterally into the normal brain parenchyma 2.5 mm distant from the tumor. The intra-arterial injection was performed via the ipsilateral internal carotid artery, as previously described.13 More details of cell delivery are given in online supplementary materials.
In vivo MRI
In vivo MRI was performed to track IFNβ-FTH-MSCs and monitor their therapeutic effect on the glioma. Thirty-six animals bearing orthotopic gliomas were randomized into four experimental groups, including PT, IC, IT and IA groups, and two control groups, including eGFP-MSCs and PBS groups (n=6 in each group). At each time point of 1 day before injection (baseline), the day of injection (day 1) as well as 4, 7 and 11 days after injection (day 4, day 7 and day 11), in vivo MRI was performed on a clinical 3.0 T MR scanner (Ingenia; Philips Medical Systems) with a 50 mm×50 mm 8-channel phased array rat coil (Suzhou Zhongzhi Medical Technologies, China). Axial or coronal T2-weighted (T2W) and T2*-weighted (T2*W) images of the brains were obtained. The acquisition parameters are given in online supplementary materials. The hypointense signal intensity and its volume on T2*W images of animals in each group at each time point were measured to evaluate the homing, engraftment, distribution and survival of transplanted IFNβ-FTH-MSCs, as previously described.14 The relative signal intensity of the grafted cells was calculated as follows: relative signal intensity=(SINB−SIGC)/SINB×100%, where SIGC represents the signal intensity of the grafted cells and SINB represents the signal intensity of the contralateral normal brain parenchyma. The tumor volume of animals in each group at each time point was measured on T2W images to assess the therapeutic effect, as previously described.13
Survival analysis
Additional 36 animals bearing orthotopic gliomas were randomized into PT, IC, IT, IA, eGFP-MSCs and PBS groups (n=6 in each group) to assess the effect of IFNβ-FTH-MSCs on animal survival. The survival time of animals in each group was recorded.
Ex vivo qPCR
Additional 36 animals bearing orthotopic gliomas were randomized into PT, IC, IT and IA groups (n=9 in each group) to assess the eGFP gene expression following different routes of cell delivery by using qPCR assay. On day 1, day 6 and day 11 (n=3 at each time point), rat brains were removed for qPCR assay, as previously described.13
Ex vivo ELISA
Fifty-four animals bearing orthotopic gliomas were randomized into PT, IC, IT, IA, eGFP-MSCs and PBS groups to determine the IFNβ secretion level after different treatments (n=9 in each group) by ex vivo ELISA. On day 1, day 6 and day 11 (n=3 at each time point), rat brains were removed for ELISA; details are given in online supplementary materials.
Histologic analysis
Additional 54 animals bearing orthotopic gliomas were randomized into PT, IC, IT, IA, eGFP-MSCs and PBS groups (n=9 in each group). On day 1, day 6 and day 11 (n=3 at each time point), rat brains were collected for histologic analysis, as previously described.13
PB staining and immunohistochemical staining for FTH were conducted to determine the homing, engraftment, distribution, migration and survival of transplanted MSCs, as previously described.13 The survival of grafted MSCs was quantified semiquantitatively by counting the percentage of eGFP-positive (eGFP+) cells using a confocal microscope (LSM-880; Zeiss, Jena, Germany), as previously described.15
The presence and localization of CD8-positive cytotoxic T lymphocytes and Batf3-positive dendritic cells (DCs) that are responsible for effector T-cell recruitment and activation within the brain were detected by immunohistochemical and immunofluorescence staining. Details are provided in online supplementary materials. The tumor area ratio that was positive for Batf3 or CD8 on immunohistochemical staining was assessed semiquantitatively by using ImageJ software (NIH, Bethesda, MD), as previously described.16
Statistical analysis
The data are presented as mean±SD. One-way analysis of variance was used to compare mRNA and protein level, T2 value, iron concentration, migration rate, percentage of eGFP+ cells, ex vivo eGFP mRNA and IFNβ secretion level, as well as Batf3+ and CD8+ area ratio, followed by the Bonferroni post hoc test for multiple pairwise comparisons among different times. The tumor volume, hypointense signal volume and relative–signal intensity were analyzed by repeated measures analysis of variances. Survival curves were plotted using the Kaplan-Meier method (log-rank test). Statistical analysis was performed using SPSS 22.0 software (SPSS Inc.; Chicago, IL). The statistical value of p <0.05 was considered to indicate a significant difference.
Results
MSCs could be efficiently transduced by the constructed lentivirus to upregulate their IFNβ secretion and FTH expression
The schematic of the constructed lentiviral vector is shown in figure 1A. The titer of obtained recombinant lentivirus, LV-IFNβ-T2A-FTH-eGFP, is 2×10⁸ TU/mL. The average transduction efficiency for MSCs achieved 73.6%±0.3% after selecting with puromycin, which is significantly higher than 56.6%±0.4% in cells without puromycin selection (online supplementary figure S1A). Remarkable green fluorescence was seen in IFNβ-FTH-MSCs (online supplementary figure S1B). qPCR, ELISA and Western blot assays showed increased IFNβ and FTH expression in IFNβ-FTH-MSCs compared with eGFP-MSCs and WT-MSCs (p<0.05) (figure 1B–D).
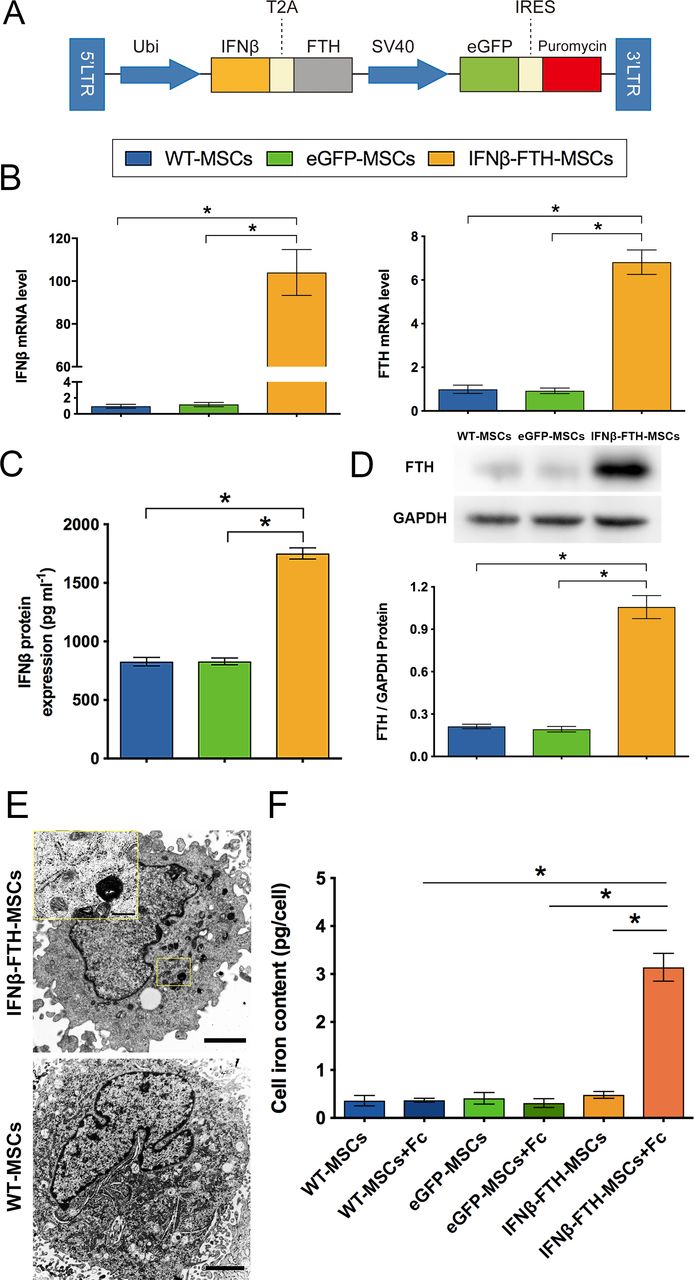
MSCs transduction with LV-IFNβ-T2A-FTH-eGFP. (A) The schematic of the constructed lentiviral vector. (B) qPCR reveals that the mRNA level of IFNβ and ferritin heavy chain (FTH) was significantly higher in IFNβ-FTH-MSCs than that in eGFP-MSCs and WT-MSCs. ELISA (C) and Western blot assay (D) show that the IFNβ secretion level and FTH protein level were significantly increased in IFNβ-FTH-MSCs than those in eGFP-MSCs and WT-MSCs. (E) Representative transmission electron microscopy (TEM) micrographs showing dense iron particles inside the cytoplasm of IFNβ-FTH-MSCs with FC treatment, while no iron particles in WT-MSCs incubated with FC. Bar=2000 nm. Insert frame: bar=500 nm. (F) Atomic absorption spectrometry (AAS) shows a remarkable increase in the iron concentration of IFNβ-FTH-MSCs with FC treatment. n=3. *p<0.05. Abbreviations: LTR: long terminal repeat; Ubi: ubiquitin promoter; T2A: 2A peptide derived from the Thosea asigna virus; SV40: simian virus 40 promoter; IRES: internal ribosome entry site.
FTH overexpression leads to increased cellular iron accumulation in IFNβ-FTH-MSCs
TEM revealed that dense electron iron particles accumulated inside the cytoplasm of IFNβ-FTH-MSCs pre-incubated with ferric citrate (FC, 350 µM), while no iron particles were found in WT-MSCs with FC treatment (figure 1E). AAS confirmed a remarkable increase of the iron concentration (3.2±0.3 pg per cell) in IFNβ-FTH-MSCs pre-incubated with FC (figure 1F). PB staining revealed that blue-stained particles were only detected inside the IFNβ-FTH-MSCs with FC treatment (online supplementary figure S2). Consistently, only IFNβ-FTH-MSCs pre-incubated with FC generated an obvious hypointense signal on T2W and T2*W images (online supplementary figure S3A) and showed a reduction in T2 values (online supplementary figure S3B).
IFNβ and FTH overexpression exerts no noticeable detrimental influence on MSCs
No significant differences were observed in cell viability, apoptosis rate and ROS level in IFNβ-FTH-MSCs, eGFP-MSCs and WT-MSCs (p>0.05) (figure 2A). IFNβ-FTH-MSCs were strongly positive for the MSC markers, including CD90 (99.9%) and CD29 (98.8%), and were negative for the hematopoietic marker CD45 (1.4%) (figure 2B). IFNβ-FTH-MSCs showed similar capacities of differentiation into osteocytes and adipocytes with WT-MSCs and eGFP-MSCs (figure 2C). IFNβ-FTH-MSCs showed a similar migratory capability with WT-MSCs and eGFP-MSCs (figure 2D).
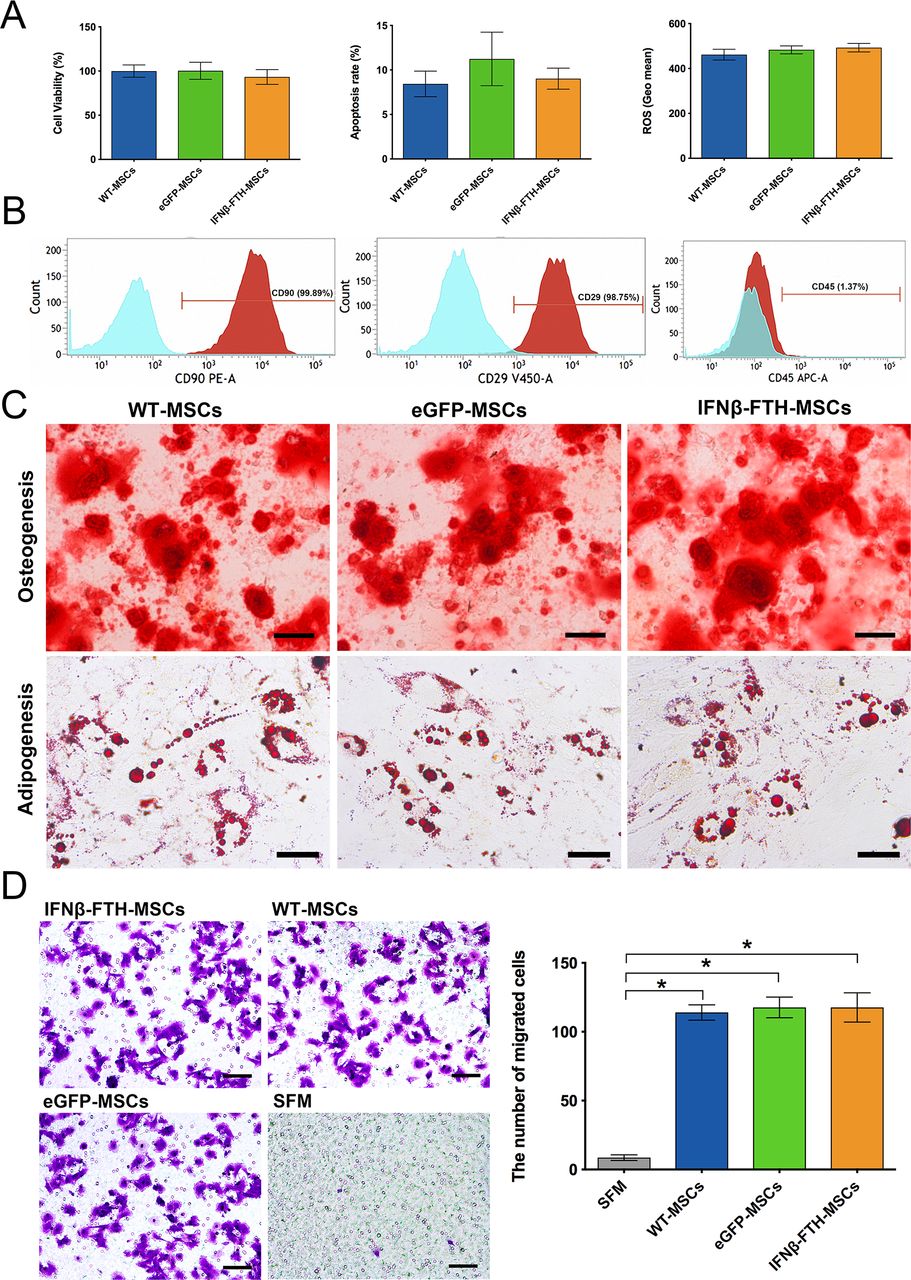
In vitro cytotoxicity assay of IFNβ and ferritin heavy chain (FTH) overexpression. (A) Graphs showing no significant differences in cell viability, apoptosis rate and reactive oxygen species (ROS) level in IFNβ-FTH-MSCs, eGFP-MSCs and WT-MSCs. (B) Representative flow cytometric graphs show that IFNβ-FTH-MSCs were strongly positive for CD90 and CD29 but negative for CD45. PE was used to label CD90; V450 for CD29; Alexa 647 for CD45. (C) Representative micrographs showing abundant calcium nodules (osteogenesis) and red-colored oil granules (adipogenesis) in WT-MSCs, eGFP-MSCs and IFNβ-FTH-MSCs. Bar=100 µm. (D) Representative Transwell migration assay images and quantified results showing similar migration of IFNβ-FTH-MSCs, eGFP-MSCs and WT-MSCs in response to conditioned medium from F98 cells. WT-MSCs induced by serum-free medium (SFM) served as negative controls. Bar=100 µm. n=3. *p<0.05.
IFNβ-FTH-MSCs following different routes of administration could be tracked by in vivo MRI
The grafted IFNβ-FTH-MSCs manifested as hypointense signals on T2*W images (figure 3A). In PT group, the linear hypointense signals were detected at the tumor border, which reduced in size in the first 4 days, then remained consistent by day 11 (figure 3A). In IC group, the linear hypointense signal was seen at the injection site within the normal brain parenchyma at a distance from the tumor, then migrated toward the glioma but disappeared on day 11 (figure 3A). In IT and IA groups, IFNβ-FTH-MSCs generated clusters of hypointense signals within the tumor, both gradually decreased and were invisible on day 11 (figure 3A). No such hypointense signals were found in eGFP-MSCs or PBS group (figure 3A).
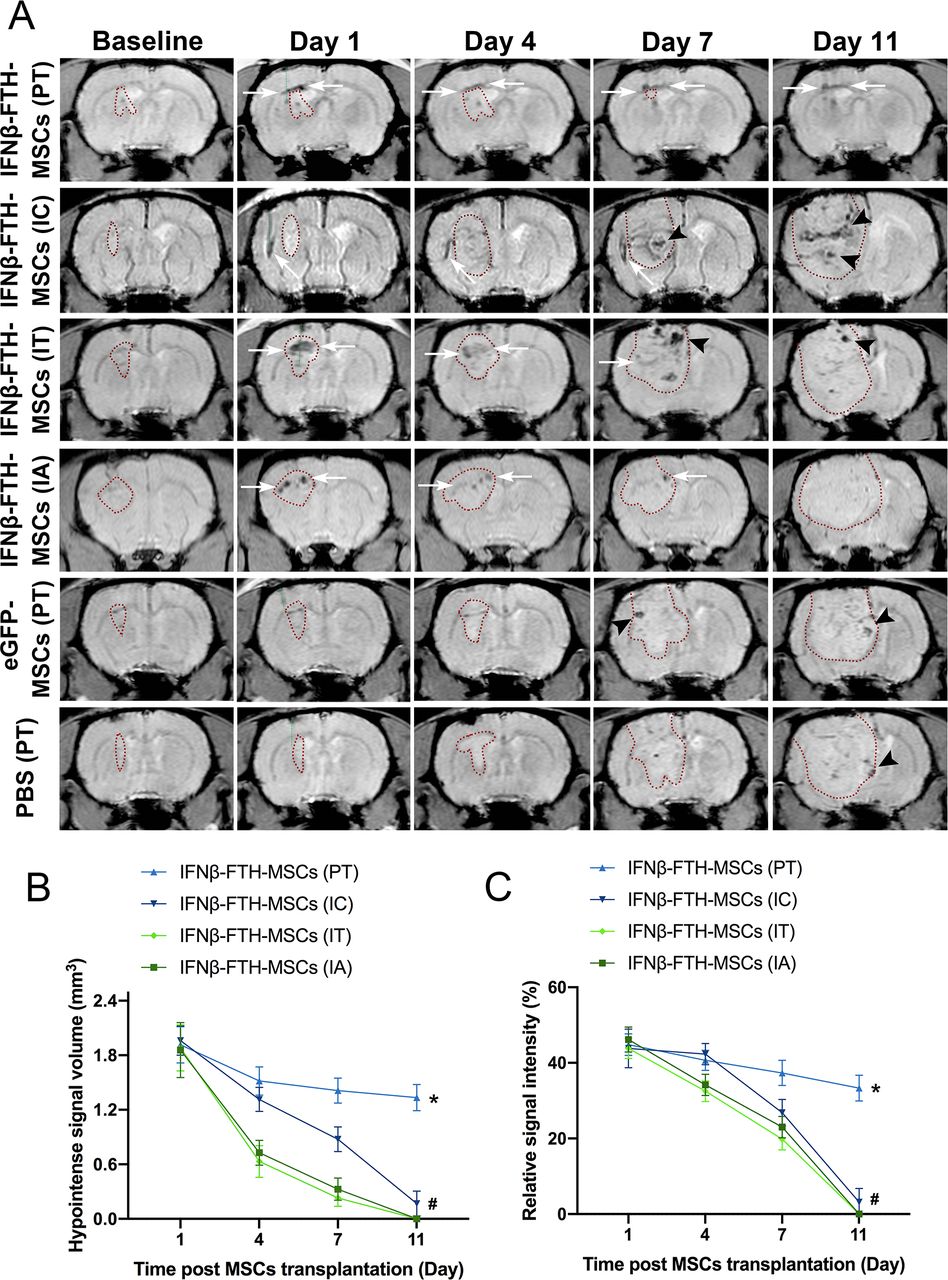
In vivo MRI tracking of IFNβ-FTH-MSCs. (A) Longitudinal coronal T2*W images show IFNβ-FTH-MSCs as well-defined hypointense signals (white arrows) and display gliomas as a mass with a slightly hyperintense signal (red dotted lines). Needle trajectories of MSC transplantation were marked as green dotted lines. After peritumoral injection (PT) of IFNβ-FTH-MSCs, the linear hypointense signal was detected at the tumor border on day 1 (the day of injection), reduced in size by day 4 and then remained consistent. After intracerebral injection (IC) of IFNβ-FTH-MSCs, the linear hypointense signal was seen at the injection site within the normal brain parenchyma at a distance from the tumor on day 1, then migrated toward the glioma, but was invisible on day 11. After intratumoral (IT) or intra-internal carotid arterial injection (IA) of IFNβ-FTH-MSCs, clusters of hypointense signals were seen within the tumor, then gradually declined and were eventually invisible on day 11. No such hypointense signal was detected after peritumoral injection of eGFP-MSCs or PBS. Several hypointense signals that were generated from endogenic hemorrhage or tortuous vessels that occurred with glioma progression were seen on day 7 and day 11 (arrowheads). Graphs of dynamic change of hypointense signal volume (B) and relative–signal intensity (C) from grafted IFNβ-FTH-MSCs show a significantly gentler decrease in PT group than that in IC, IT and IA groups. n=6. *p<0.001, #p<0.05.
The hypointense signal volume and relative–signal intensity in PT group showed a slight decrease over time, and the decline was significantly gentler than IC, IT and IA groups (p<0.001) (figure 3B–C). Except for PT group, the hypointense signal volume and relative signal intensity in IC, IT and IA groups almost disappeared on day 11 (figure 3B–C).
Peritumoral injection of IFNβ-FTH-MSCs inhibits malignant glioma growth
The orthotopic glioma appeared as a hyperintense mass on T2W images (figure 4A). In PT group, the gliomas were nearly completely inhibited (figure 4A). In contrast, animals in IC, IT and IA groups displayed a gradual tumor growth in a similar pattern (figure 4A). Tumor growth curves showed that the gliomas in PT group had an obvious growth inhibition, which was significantly different from the other five groups (p<0.001), while no significant differences were observed among IC, IT, IA, eGFP-MSCs and PBS groups (p>0.05) (figure 4B). Kaplan-Meier survival analysis showed that animals in PT group achieved a significantly improved survival than the other five groups (p<0.05) (figure 4C).

Therapeutic effect of IFNβ-FTH-MSCs. (A) Longitudinal axial T2W images show that gliomas represented as a mass with hyperintense signal (dotted lines). After peritumoral injection (PT) of IFNβ-FTH-MSCs, the glioma was nearly completely inhibited, while gliomas receiving other treatments displayed a gradual tumor growth. (B) Tumor growth curves reveal animals receiving peritumoral injection of IFNβ-FTH-MSCs show a significant glioma growth inhibition compared with other groups. (C) Survival curves show animals receiving peritumoral injection of IFNβ-FTH-MSCs achieved a significantly prolonged survival compared with other groups. n=6. *p<0.001. Abbreviations: IC: intracerebral injection; IT: intratumoral injection; IA: intra-internal carotid arterial injection.
Homing, engraftment, distribution and survival of IFNβ-FTH-MSCs detected by MRI could be validated by histologic analysis and ex vivo PCR
In PT group, immunohistochemistry staining for FTH and PB staining showed that numerous FTH-positive (FTH+) and blue-stained IFNβ-FTH-MSCs were found at the tumor border on day 1, and a considerable number of FTH+ and blue-stained cells remained and intermixed with residual tumor cells on day 11 (figure 5A). In IC group, many FTH+ and blue-stained IFNβ-FTH-MSCs were seen in the normal brain tissue distant to the tumor on day 1; a small fraction of them migrated from the transplantation site to the glioma, but only a few of them infiltrated the tumor mass on day 6 (online supplementary figure S4); and very few FTH+ and blue-stained cells were found within the tumor mass on day 11 (figure 5A). In IT and IA group, abundant FTH+ and blue-stained IFNβ-FTH-MSCs were found within the tumor on day 1; very few FTH+ and blue-stained cells were found within the tumor or along the tumor border on day 11 (figure 5A). The homing and engraftment of IFNβ-FTH-MSCs via different administration routes as detected by histology were well matched with the findings on the T2*W images on day 1. As for day 11, only IFNβ-FTH-MSCs in PT group were detectable on MRI, while IFNβ-FTH-MSCs in the other three groups were not detected on MRI due to the very small quantity of surviving cells (figure 5A).
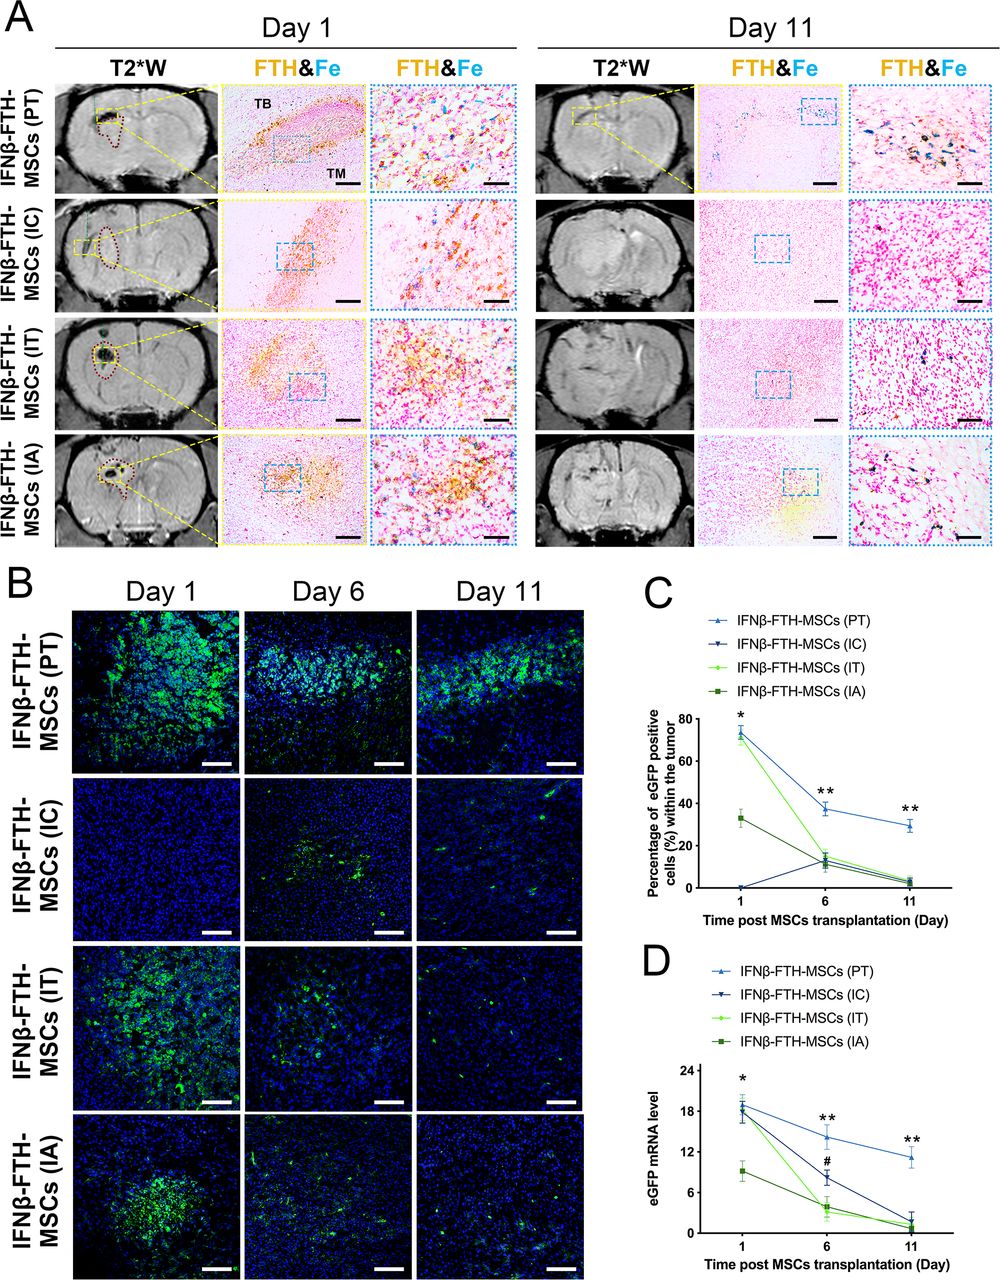
Homing, engraftment, distribution and survival of IFNβ-FTH-MSCs. (A) Representative micrographs of immunohistochemistry for FTH and Prussian blue staining (Fe) show, on day 1 (the day of injection), the homing and engraftment of IFNβ-FTH-MSCs via different administration routes as detected by histology were well matched with the findings on the T2*W images. On day 11, only IFNβ-FTH-MSCs in peritumoral injection (PT) group were detectable on MRI, while IFNβ-FTH-MSCs in the other three groups were not detected on MRI due to the very small quantity of surviving cells. Gliomas appeared as a mass with a slightly hyperintense signal on T2*W images (red dotted lines). Needle trajectories of MSCs transplantation were marked as green dotted lines. TB: tumor border. TM: tumor mass. Bar=200 µm (middle panels) and 50 µm (right panels). (B) Representative micrographs of immunofluorescence of eGFP shows that, in PT group, massive eGFP+ cells (green) were found at the tumor border on day 1, then a considerable number of eGFP+ cells remained by day 11. In intratumoral injection (IT) and intra-internal carotid arterial injection (IA) groups, numerous eGFP+ were found within the tumor on day 1, a majority of eGFP+ cells disappeared on day 6, and few eGFP+ cells could be seen in the tumor by day 11. In intracerebral injection (IC) group, no eGFP+ cells were seen in the tumor on day 1, a few eGFP+ cells were found within the tumor on day 6, whereas very few eGFP+ cells on day 11. Bar=50 µm. Graphs show except for PT group, the percentage of eGFP+ cells (C) and eGFP mRNA level (D) in IC, IT and IA groups all diminished to almost complete disappearance on day 11. n=3. *p<0.001 between PT, IC and IT, IA; **p<0.001 between PT and IC, IT, IA; #p<0.05 between IC and IT, IA.
Immunofluorescence of eGFP showed a similar pattern of change with immunohistochemistry staining for FTH and PB staining (figure 5B). Quantified results revealed that the percentage of eGFP+ cells was similar in PT (73.6%±3.2%) and IT groups (71.2%±3.6%) on day 1 (p>0.05), and both were significantly higher than that in IA group (33.0%±4.3%) (p<0.001), suggesting a higher delivery efficiency of peritumoral and intratumoral injection (figure 5C). The percentage of eGFP+ cells in PT group decreased to 29.4%±3.1% on day 11, which was significantly higher than that (around 3.0%) in the other three groups (figure 5C) (p<0.001). Nearly 40% of IFNβ-FTH-MSCs died from day 1 to day 11 in PT group.
Ex vivo qPCR assays revealed that eGFP expression declined gradually in PT, IC, IT and IA groups, but the eGFP gene expression in PT group was significantly higher than that in IC, IT and IA groups on day 6 and day 11 (figure 5D) (p<0.001). Except for PT group, the eGFP gene expression in IC, IT and IA groups almost disappeared on day 11, consistent with the results of immunofluorescence staining for eGFP.
IFNβ-FTH-MSCs grafted peritumorally secrete IFNβ persistently
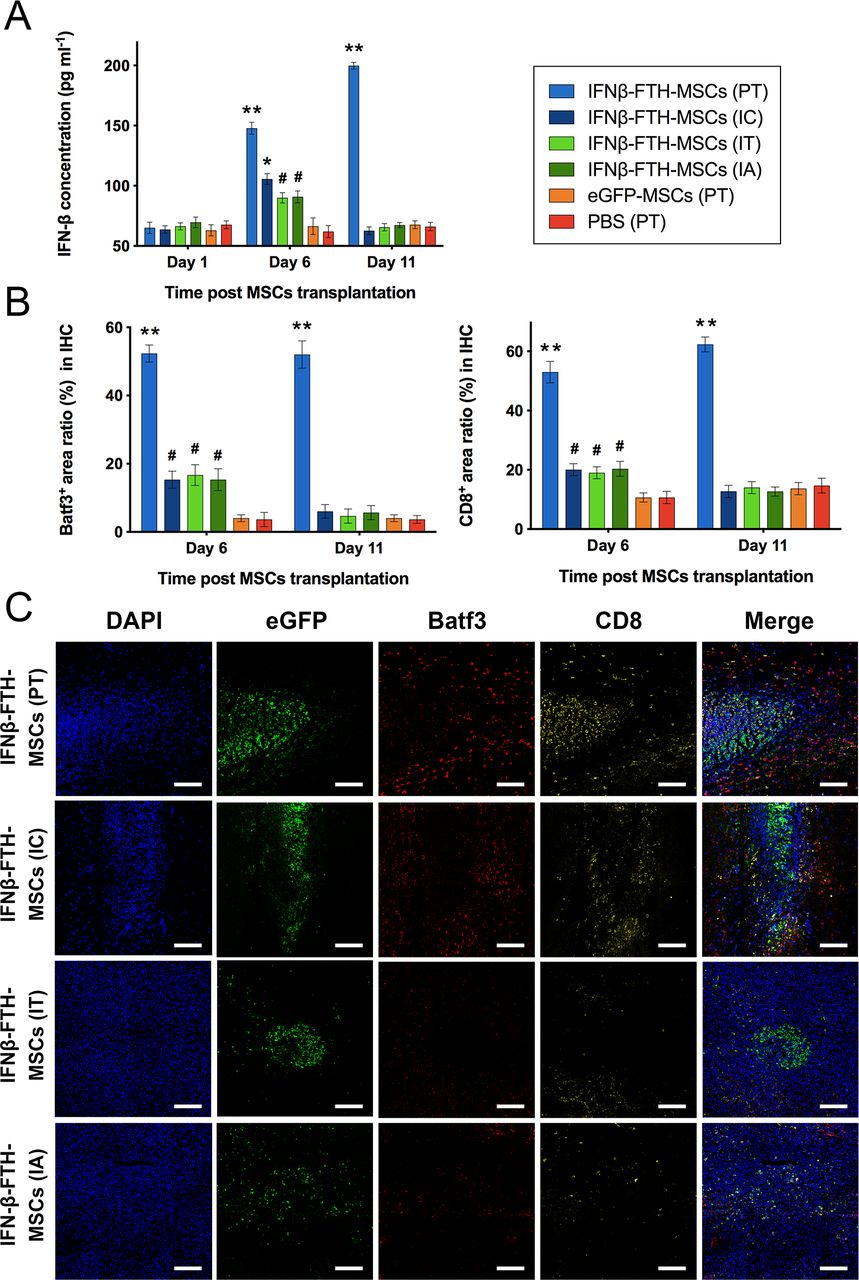
The IFNβ secretion level increased over time in the PT group, which was significantly higher than that in the other five groups on day 6 and day 11 (p<0.001) (figure 6A). The IFNβ levels in IC, IT and IA groups reached a peak on day 6, which was significantly higher than that in eGFP-MSCs and PBS groups (p<0.05), then they restored to the similar levels as in eGFP-MSCs and PBS groups on day 11 (p>0.05) (figure 6A).
Therapeutic mechanism of IFNβ-FTH-MSCs. (A) Graph showing after peritumoral injection (PT) of IFNβ-FTH-MSCs, the secretion level of IFNβ increased over time, which was significantly higher than that in the other groups on day 6 and day 11. After intracerebral (IC), intratumoral (IT) or intra-internal carotid arterial injection (IA) of IFNβ-FTH-MSCs, the secretion level of IFNβ peaked on day 6 but restored to normal level on day 11 (n=3). (B) Graph showing the Batf3 and CD8+ area ratio in the gliomas receiving peritumoral injection of IFNβ-FTH-MSCs were significantly higher than that in other groups on day 6 and day 11 (n=3). IHC, immunohistochemistry staining. (C) Representative micrographs of immunofluorescence for eGFP (green), Batf3 (red) and CD8 (yellow) shows abundant Batf3+ DCs and CD8+ T cells were found in the peripheral tumor zone or normal brain parenchyma surrounding the peritumorally or intracerebrally grafted IFNβ-FTH-MSCs in PT and IC groups, whereas much less Batf3+ DCs and CD8+ T cells were seen within the tumor when IFNβ-FTH-MSCs transplanted into the tumor in IT and IA groups. Bar=50 µm. **p<0.001 between PT and other five groups; *p<0.05 between IC and other five groups; #p<0.05 between IC, IT, IA and eGFP-MSCs, PBS group.
Peritumoral injection of IFNβ-FTH-MSCs results in pronounced Batf3+ DCs and CD8+ T-cell infiltration within the glioma
Immunohistochemistry staining for Batf3 and CD8 showed a persistent, enhanced Batf3 DCs and CD8+ T-cell infiltration within the tumor in PT group (online supplementary figure S5). Comparatively, tumors in IC, IT and IA groups only showed a moderately increased Batf3+ DCs and CD8+ T-cell infiltration on day 6 (online supplementary figure S5). The percentages of Batf3+ and CD8+ area ratio were significantly higher in PT group than in other groups at each time point (p<0.001), while Batf3+ and CD8+ area ratios were significantly higher in IC, IT and IA groups than in eGFP-MSCs and PBS groups only on day 6 (p<0.05) (figure 6B).
By 6 days after transplantation, immunofluorescence staining for eGFP, Batf3 and CD8 showed that numerous Batf3+ DCs and CD8+ T cells were seen in the peripheral tumor zone or normal brain parenchyma surrounding the peritumorally or intracerebrally grafted IFNβ-FTH-MSCs in PT and IC groups, whereas much less Batf3+ DCs and CD8+ T cells were seen within the tumor in IT and IA groups where IFNβ-FTH-MSCs were transplanted into the tumor (figure 6C).
Discussion
Our study showed that the recombinant lentivirus could efficiently and safely transduce MSCs to upregulate their IFNβ and FTH gene expression, leading to increased IFNβ secretion and MRI detectability of MSCs. Administration of IFNβ-FTH-MSCs only via peritumoral injection could exert a therapeutic effect in an immunocompetent rat glioma model, whereas intracerebral, intratumoral or intra-arterial IFNβ-FTH-MSCs injection showed no inhibition on glioma growth. A fraction of IFNβ-FTH-MSCs after peritumor injection could survive up to 11 days after injection, while the vast majority of IFNβ-FTH-MSCs administered via other routes died within 11 days. IFNβ-FTH-MSCs grafted peritumorally persistently secreted IFNβ, leading to pronounced Batf3+ DCs and CD8+ T-cell infiltration within the glioma.
MSCs are considered as promising delivery vehicles for immunoregulatory genes in glioma treatment. Previously, Nakamizo et al found that intravascular or intratumoral injection of IFNβ upregulated MSCs could extend the survival time of glioma-bearing animals.17 In their study, the fate of transplanted MSCs was assessed by postmortem histologic analysis at pre-decided time points. However, the dynamics of the fate of transplanted MSCs in the same living organism cannot be revealed by this means. In addition, the optimal cell delivery route was not fully elucidated. Moreover, they only assessed the therapeutic effect by survival analysis, whether IFNβ upregulated MSCs have a direct therapeutic benefit on glioma growth needs to be further clarified. Previously, bioluminescence imaging (BLI) with firefly luciferase reporter gene and PET with HSV-tk reporter gene have been used to track therapeutic cells for glioma treatment.18 19 Nonetheless, both BLI and PET cannot pinpoint the exact location of signal resource or assess the dynamic change of tumor directly, due to their poor spatial resolution and soft-tissue contrast; thus, a complementary histologic analysis or imaging modality is still needed to determine the anatomical location and therapeutic effect of transplanted cells. Comparatively, MRI provides a powerful tool for in vivo cell tracking because of its superior spatial resolution, absence of ionizing radiation, deep tissue penetration and excellent soft-tissue contrast.20 MRI-based cell tracking mainly involves direct labeling cells with an MRI contrast agent such as superparamagnetic iron oxide nanoparticles (SPIO), or indirect labeling cells with reporter genes such as FTH.20 SPIO-based MRI cannot provide reliable information on long-term cell viability and might overestimate the survival of SPIO-labeled cells.20 Reporter gene–based MRI allows long-term cell tracking and only visualizes viable cells.20 Our study demonstrated that FTH-based MRI could be applied to monitor the homing, engraftment, distribution and survival of IFNβ upregulated cells administrated via different routes in a non-invasive and real-time manner, and to assess the treatment efficacy by measuring the dynamic change of tumor volume simultaneously, indicating that FTH-based MRI is a suitable tool for monitoring MSC-based therapies.
It has been proved that the delivery route affects the grafting process of stem cells in the target tissue, thereby determining the therapeutic benefit.21 To determine the optimal administration route, we compared the therapeutic effects of peritumoral, intracerebral, intratumoral and intra-arterial injection of IFNβ-FTH-MSCs by in vivo MRI monitoring of the tumor progression, as well as survival analysis. Our results revealed that only peritumoral injection of IFNβ-FTH-MSCs could exert obvious glioma growth inhibition, indicating peritumoral injection is the optimal administration route. Further histologic analysis showed that this result might be associated with different survival outcomes of IFNβ-FTH-MSCs following different administration routes. Specifically, nearly 30% of IFNβ-FTH-MSCs transplanted peritumorally survived at the tumor border during the 11-day observation, while most IFNβ-FTH-MSCs administered via other routes died within 11 days. These surviving IFNβ-FTH-MSCs persistently secreted IFN-β, thereby exerted a prolonged immunoregulatory function, eventually inhibited glioma growth, as evidenced by the ELISA and histologic data. The prolonged survival of MSCs at the tumor border might be associated with more suitable microenvironment within the tissue in the vicinity of the tumor in relation to inside the tumor. The microenvironment within a tumor is characterized in part by rapidly dividing cancer cells competing for limited local resources, such as oxygen and other nutrients.22 These factors can exert a detrimental effect on the survival of intratumoral MSCs. For example, hypoxia can induce apoptosis of MSCs in a caspase-dependent manner that also involves mitochondrial dysfunction.23
It was initially thought that IFNβ exerts a direct cytotoxic effect on tumor cells; nonetheless, it is becoming increasingly clear that IFNβ mainly exerts its anti-tumor influence through stimulating anticancer T-cell immune responses.24 Of note, several recent studies collectively demonstrated that a subset of DCs characterized by Batf3 plays a central role in the cascade of IFNβ-based T-cell immune responses.25 26 In our study, abundant Batf3+ DCs and CD8+ T cells were found in the peripheral tumor zone or the normal brain parenchyma surrounding the peritumorally or intracerebrally grafted IFNβ-FTH-MSCs, whereas much less Batf3+ DCs and CD8+ T cells were seen within the tumor when IFNβ-FTH-MSCs were transplanted into the tumor by intratumoral or intra-arterial injection. As IFNβ mainly exerts their immunomodulation function in a paracrine way,24 it can be hypothesized that the tumor tissue constitutes a “barrier” for IFNβ-FTH-MSCs inside the tumor to recruit Batf3+ DCs and CD8+ T cells from the normal brain parenchyma, resulting in a weak cascade of the following anti-tumor T-cell responses. On the contrary, surviving IFNβ-FTH-MSCs grafted peritumorally function as an IFNβ “cellular factory” and produce a persistently increased level of IFNβ in the peripheral tumor zone, followed by active Batf3+ DCs and CD8+ T-cell recruitment and activation within the tumor, finally inhibiting glioma growth.
Our study has several limitations. First, the intravenous injection was not exploited in this study because our previous study has proven that very few MSCs can arrive in the intracranial glioma after intravenous injection.13 Second, MSCs can interact with tumor cells, different constituents within the tumor microenvironment and the immune system via intricate signaling networks, resulting in complex and variable crosstalk.27 Although we have demonstrated IFNβ-FTH-MSCs inhibit glioma growth by activating anti-tumor T-cell responses, the detailed mechanism underlying the therapeutic effect needs to be further clarified. Given the primary purpose of this study, the exact mechanism will be determined in a future study. Third, only an F98 rat glioma model was used in our study. No other glioma cell lines, such as human glioma cell lines, U251 and U87, were used. To establish an orthotopic glioma model of these human glioma cells, immunocompromised animals are typically needed. Since IFNβ mainly exerts the anti-tumor influence through T-cell immune responses, the presence of defective T-cell immunity in these immunocompromised animals is unfavorable for determining the therapeutic effects of IFNβ-upregulated MSCs. Rat glioma cell lines, such as 9L and C6, were also not used, as they are highly immunogenic, which can exhibit spontaneous glioma regression.28 Comparatively, F98 glioma closely resembles human glioblastoma due to its weak immunogenicity and highly invasive pattern of growth28 and has been proved to be an attractive model for evaluating the immunotherapeutic efficacy in various studies.29 30 Fourth, only an 11-day observation was performed in our study. The long-term fate of survived MSCs grafted peritumorally remains to be defined in future studies.
Conclusions
In summary, our study demonstrated that peritumoral administration of IFNβ over-expressed MSCs could substantially inhibit malignant glioma growth. The homing, engraftment, distribution, survival and therapeutic benefit of transplanted MSCs could be monitored in vivo on a clinical 3.0 T MRI. MSCs can be used as cellular vehicles of IFNβ to effectively treat malignant glioma. Peritumoral injection of IFNβ-MSCs provides a new therapeutic option for malignant glioma, and FTH-based MRI can be integrated to monitor this cellular therapy.
References
Footnotes
JM and MC contributed equally.
Contributors JS conceived and supervised the study. JM and MC designed and performed all experiments. JZ guided the experiments. FZ and XD established the animal models and performed the cell transplantations. LL and ZY constructed the lentivirus and performed in vitro experiments. XZ and WZ performed the pathology and immunostaining experiments. QZ and ZW contributed to analysis and interpretation of data. All authors have contributed to writing, reviewing and editing, and have approved the final manuscript.
Funding This study was supported by the Key Areas Research and Development Program of Guangdong (Grant No. 2019B020235001), National Natural Science Foundation of China (Grant No. U1801681, 81801756, 81801763), Guangdong Province Universities and Colleges Pearl River Scholar Funded Scheme (2017), Guangdong Natural Science Foundation (Grant Nos. 2017A030313777, 2014A030312018) and the Key Research and Development Program of Jiangsu Province (Grant No. BE2017669).
Competing interests None declared.
Patient consent for publication Not required.
Ethics approval All animal experiments in our study were conducted in accordance with the National Institutes of Health guide for the care and use of laboratory animals and were approved by the Institutional Animal Care and Use Committee of Sun Yat-Sen University (Guangzhou, China).
Provenance and peer review Not commissioned; externally peer reviewed.
Data availability statement Data are available on reasonable request.