Article Text

Abstract
Background Adoptive cell therapy (ACT) with tumor-reactive T cells has shown consistent clinical efficacy. We evaluated the response to ACT in combination with interferon alpha (IFNa) preconditioning in patients with stage IV metastatic melanoma, most of which were progressive on cytotoxic T-lymphocyte-associated protein 4 and/or programmed cell death protein 1 checkpoint blockade therapy.
Methods Thirty-four patients were treated with ex vivo expanded tumor reactive T cells, derived from mixed lymphocyte autologous tumor cultures, or with autologous tumor-infiltrating lymphocytes and evaluated for clinical response. Clinical and immunological parameters associated with response were also evaluated.
Results Best overall response defined as clinical benefit, comprising either complete response, partial response or stable disease >6 months, was observed in 29% of the patients. Forty-three per cent of the 14 immunotherapy-naïve patients and 20% of the 20 patients progressive on prior immunotherapy benefited from ACT. The overall survival (OS) was 90% versus 28.6% at 1 year and 46.7% versus 0% at 3 years follow-up, of responder and non-responder patients, respectively. Median OS was 36 versus 7 months, respectively. IFNa pretreatment resulted in leukopenia, neutropenia and lymphopenia, which was sustained during the treatment in clinical responders and associated with response. Differences in antigen specificity, but not in phenotype, cytokine profile or CD8+ T cell number of the ACT products correlated with clinical response. Cross-reactivity of the ACT products to one or more allogeneic human leukocyte antigen-matched melanoma cell lines was associated with short OS after treatment while the ACT products of very long-term survivors showed no cross-reactivity but recognized patient-specific neoantigens.
Conclusion This study demonstrates that ACT in combination with a mild IFNa preconditioning regimen can induce clinical benefit even in immunotherapy pretreated patients, although with lower success than in immunotherapy-naïve patients. ACT products comprising neoantigen reactivity may be more effective.
- interferon
- tumours
- immunology
This is an open access article distributed in accordance with the Creative Commons Attribution Non Commercial (CC BY-NC 4.0) license, which permits others to distribute, remix, adapt, build upon this work non-commercially, and license their derivative works on different terms, provided the original work is properly cited, appropriate credit is given, any changes made indicated, and the use is non-commercial. See http://creativecommons.org/licenses/by-nc/4.0/.
Statistics from Altmetric.com
Background
The emergence of several new treatment options including targeted and checkpoint-blocking therapy for melanoma has dramatically improved the response rate from a very poor median survival time of 6–9 months to almost 2 years.1 Nevertheless, almost half of the patients do not respond or eventually become refractory to these therapies.2–6 Adoptive cell therapy (ACT) offers an additional treatment option for patients presenting with standard treatment refractory progressive disease (PD). ACT involves the reinfusion of ex vivo expanded autologous tumor-reactive T cells (TRT) or tumor infiltrating T cells (TIL) and is proven to be a very effective treatment modality for solid tumors resulting in an objective response rate of up to 50% in melanoma when administered after non-myeloablative conditioning by chemodepletion and additional postinfusion of interleukin-2 (IL-2) in immunotherapy-naïve patients.7–10 However, the response rate and overall survival (OS) considerably drop when patients are progressive on anti-cytotoxic T-lymphocyte-associated protein 4 (CTLA-4) and/or programmed cell death protein 1 (PD-1) blockade prior to ACT treatment.11
T cells used for infusion, that is, the ACT product, are generally obtained by ex vivo expansion of TIL, of which it is known that their abundance correlates with better survival in melanoma.12–14 Alternatively, the ACT product can be formed by TRT, expanded from peripheral blood mononuclear cells (PBMC) by mixed lymphocyte tumor cell culture (MLTC),15 16 requiring an established tumor cell line for repeated ex vivo stimulation, which is not feasible for most patients.
Previous ACT trials demonstrated the need for chemotherapy-driven lymphodepletion prior to T cell infusion and concomitant administration of high-dose IL-2 to obtain clinical success.17–19 A considerable reduction of the toxicity associated with these protocols could be obtained by reduction of the postinfusion IL-2 dose.10 20–22 In an interim analysis, we showed that clinical benefit can also be obtained when low-dose interferon alpha (IFNa) is used as a very mild and safe preconditioning and T cell supporting regimen.15
Here, we report the data of the complete trial in which we investigated the safety and feasibility to treat patients with metastatic melanoma with adoptively transferred T cells in combination with IFNa. We dissected the effect of pretreatment clinical parameters, IFNa conditioning and the phenotypical as well as antigen-specificity characteristics of the ACT product in order to determine their association with clinical response.
Patients, materials and methods
Patient selection
Patients were eligible if 18 years or older with histologically proven stage IV or irresectable stage III cutaneous melanoma, with a WHO performance status 0–2 and a life expectancy of at least 6 months. Patients had PD at the start of treatment and systemic treatment had to be discontinued for 4 weeks in case of chemotherapy, radiotherapy or immunotherapy and 2 weeks in case of targeted therapy (BRAF/MEK inhibitors). At least one resectable or bioptable lesion was required for establishment of a tumor cell line and/or TIL culture and at least one additional measurable target lesion was required for response evaluation. Patients with asymptomatic or neurologically stable brain metastases were eligible for this study. Exclusion criteria were clinically significant heart disease (New York Heart Association class III or IV), active immunodeficiency or autoimmune disease, other malignancy within 3 years prior to entry into the study, a known allergy to penicillin or streptomycin or seropositivity for hepatitis B/C, HIV, HTLV or Treponema pallidum.
Study design
All patients were treated with autologous T cells in combination with IFNa. Low-dose IFNa injections (3 million units subcutaneous daily) were started 1 week (wk -1) before the first T cell infusion (wk 0) and continued for a total period of 12 weeks. T cell infusions were given intravenously with a 3-week interval. Patients were treated in three increasing dose cohorts of 1–2.5×10⁸, 2.5–5×10⁸ or 7.5–10×108 T cells per infusion for cohort I, II and III, respectively. Cryopreserved T cells were thawed and administered intravenously over a time period of 30–60 min.
Before and at several time points after infusions heparinized venous blood was collected and isolated PBMC as well as serum/plasma samples were cryopreserved until further analysis.
Before start of treatment and after three T cell infusions, the tumor response was evaluated by physical examination and imaging studies (CT and/or MRI) according to the Response Evaluation Criteria In Solid Tumors (RECIST) V.1.0 and V.1.1. Patients were admitted to the hospital for only 24 hours after the T cell infusions for observation. The primary objective was to evaluate the safety of the combination of T cells with low-dose IFNa, which was assessed using the NIH Common Terminology Criteria for Adverse Events (CTCAE) V.2.0 and V.4.0. Secondary objectives were clinical response evaluation and analysis of immunological parameters.
Generation of T cell products for infusion
Patients were treated with PBMC-derived TRT obtained by MLTC, as previously described.15 These cultures required the use of an established autologous tumor cell line, which was not available for all patients. Alternatively, patients received TIL, which were readily available for each patient and cultured from a small resected tumor sample essentially using a previously described protocol23 (online supplementary figure 1). TIL were cultured in T cell medium (Iscoves Modified Dulbecco’s Medium (IMDM) with penicillin (100 IU/mL), streptomycin (100 µg/mL) and L-glutamine (4 mM) (all from Life Technologies, Breda, The Netherlands), and 7.5% heat inactivated pooled human serum (Sanquin, Bloodbank, Amsterdam, The Netherlands) supplemented with IL-2 1000 IU/mL (Proleukin/Aldesleukin, Novartis, Arnhem, The Netherlands) for a total period of 14–21 days. Next, the TIL were expanded according to the described Rapid Expansion Protocol23 for another 14 days before harvesting and cryopreservation, until further use. The production and batch release were performed under full Good Manufacturing Practices compliance (GMP).
Supplemental material
Cell line generation and culture
Autologous melanoma cell lines were established in our GMP facility from resected tumor tissue as described previously.15 All other melanoma cell lines were established in the laboratory of Medical Oncology (LUMC, Leiden, The Netherlands) except for melanoma cell lines FM3 and FM6 which were provided by P. Thor Straten, Copenhagen, Denmark. BLM was obtained from the Netherlands Cancer Institute (Amsterdam, The Netherlands), and MZ7.4-mel obtained from J. Gutenberg University (Mainz, Germany). Authentication of the cell lines was performed by human leukocyte antigen (HLA)-genotyping at the Department of Immunohematology and Bloodbank of the LUMC and they were regularly tested to be mycoplasma negative. All melanoma cell lines were cultured in tumor cell medium (ie, Dulbecco’s minimal essential medium (Life Technologies) with 8% heat inactivated fetal calf serum (FCS), penicillin (100 IU/mL), streptomycin (100 µg/mL) and L-glutamine (4 mM) all from Life Technologies). Autologous EBV-LCL B cells and phytohemagglutinin (PHA)-stimulated T cell blasts (PHA-blasts) were established and cultured in B cell medium, that is, IMDM with 8% heat inactivated FCS, penicillin (100 IU/mL), streptomycin (100 µg/mL) and L-glutamine (4 mM). Epstein-Barr virus-transformed lymphoblastoid B cell lines (EBV-LCL) were used as APCs. These autologous EBV-LCL are known to process and present peptide both in HLA class I and II. The transformation was induced by incubation of patients’ PBMC with supernatant of the marmoset B cell line containing infectious particles of EBV strain B95-8 for 1 hour at 37°C. Culture medium consisted of RPMI-1640, supplemented with 5 μg/mL PHA (Thermo Fisher Scientific), 10% FCS, L-glutamine (4 mM), penicillin (100 μg/mL) and streptomycin (100 μg/mL). Cells were refreshed every 5–6 days with B cell medium and cultured for 3 weeks before being used as target cells.
Phenotypical analysis of PBMC
PBMCs collected before and after 1 week of IFNa treatment were thawed and divided into multiple samples that were stained with separate antibody panels for myeloid-derived suppressor cell (MDSC), inhibitory/memory, regulatory T cell and dendritic cell (DC) markers, respectively (online supplementary table 1a). Dead cells were stained using Yellow ArC-Qdot585 (ThermoFisher, L34959).
Supplemental material
Staining was carried out according to our standard protocols,24 washed with Fluorescence Activated Cell Sorting (FACS) buffer, fixed in 1% paraformaldehyde and analyzed using a LSRFortessa X20 (BD Biosciences).
Staining of the regulatory T cell panel was conducted using the Transcription Buffer Set (BD Biosciences) as previously described.25 FACS results were analyzed with BD FACSDiva software (V.8.02).
Cytokine analysis in serum/plasma
The serum/plasma concentration of homeostatic cytokines IL-7, IL-15 and IL-21 was analyzed using ELISA (R&D diagnostics; DY207, Biolegend; 435104, Mabtech; 3540–1 H-6), according to the manufacturer’s instructions.
Phenotypical characterization of infused T cell
For detailed phenotypical characterization, reference vials of T cell batches used for infusion were thawed, counted and resuspended in FACS buffer consisting of phosphate-buffered saline+0.5% bovine serum albumin. Dead cells were stained using Yellow ArC-Qdot585 (ThermoFisher, L34959). Next, the T cells were divided into multiple samples and stained with separate antibody panels for inhibitory, homing, memory and regulatory T cell markers, respectively (online supplementary table 1b). The staining was carried out according to our standard operating procedures as previously described,24 washed with FACS buffer, fixed in 1% paraformaldehyde and analyzed using a LSRFortessa X20 (BD Biosciences).
Functional characterization of the infused T cells
Tumor reactivity. The antigen specificity of the infusion product was tested against a broad panel of melanoma cell lines that were (partially) matched for at least one HLA class I allele with the corresponding patient. If available, autologous tumor cells were also tested. Briefly, 1.5×10⁴ T cells (effector cells) were co-cultured with 3×10⁴ target cells in a total volume of 150 µL B cell medium (ie, T cell medium with 8% FCS instead of human serum) in triplicate wells of a U-bottom 96-well plate. Medium alone and EBV-LCL B cells or PHA-blasts were used as negative controls and staphylococcal enterotoxin B (SEB, 0.5 µg/mL) or PHA (5 µg/mL) were used as positive controls. After overnight incubation at 37°C, the supernatant was harvested to determine the interferon-gamma (IFNg) secretion as a measure of reactivity by ELISA (Sanquin) according to manufacturer’s recommendations.
Neoantigen reactivity. To identify recognition of neoantigens derived from non-synonymous somatic mutations within expressed genes whole exome and RNA sequencing was performed and either 31-mer synthetic long peptides (SLPs) or 8–12-mer synthetic short peptides (SSPs) covering the mutation were manufactured as previously described.26 Of note, in contrast to the SLP, the SSP were selected based on in silico prediction using the ISABELLA algorithm (ISA Pharmaceuticals, Leiden, The Netherlands). Next, T cells were incubated as described in the previous paragraph with target cells, that is, tumor cells or autologous B cells either unloaded or preloaded overnight with SLP pools or single peptides (10 µg/mL per peptide). Recognition of SSP was analyzed by direct addition of SSP (1 µg/mL per peptide) to the T cells. Medium alone or unloaded autologous B cells were included as negative controls and SEB (0.5 µg/mL) or PHA (5 µg/mL) as positive controls. Reactivity of T cells was measured after 24 hours co-incubation with target cells/peptides by IFNg secretion using ELISA (Sanquin).
Cytokine profile. To characterize the cytokine profile potentially released on activation of the infused T cells, T cells were stimulated with SEB (0.5 µg/mL) or PHA (5 µg/mL) and if available with the autologous melanoma cell line as positive control and autologous EBV-LCL B cells, PHA-blasts or medium alone as negative controls. After incubation for 24 hours supernatant was harvested and used to analyze the cytokine production using the human Th1/Th2 cytometric bead array (BD Pharmingen). Specific cytokine production was defined by a cytokine concentration above the cut-off value (IFNg 50 pg/mL; other cytokines 10 pg/mL) and >2× the concentration of the medium control.27
Statistical analysis
Descriptive statistics were used to summarize patient baseline characteristics at start of treatment. Survival from start of treatment to progression and death was estimated according to the method by Kaplan-Meier using SPSS (V.25, IBM, released 2017).
Paired analyses between FACS data from PBMC samples of patients before and after 1 week of IFNa use were compared using Cytosplore V.2.1.5, R V.3.4.4, R studio V.1.1.442 and using the R-package cytofast.28
Furthermore, paired and independent analyses were performed on the data generated by FACS analysis on both the T cell products and the PBMCs by GraphPad Prism V.7.00 for Windows (GraphPad Software, La Jolla, California, USA) and SPSS. A D’Agostino and Pearson omnibus K2 test was performed to determine whether data were normally distributed within groups. To compare paired data following a normal distribution a paired t-test was used, when the assumption of normality was violated a Wilcoxon signed rank test was performed. For unpaired data following a normal distribution a unpaired t-test was used, when the assumption of normality was violated a Mann-Whitney U test was performed.
Results
Patient characteristics at baseline
Forty-one patients with progressive stage IV metastatic melanoma were included for treatment with ACT in combination with low-dose IFNa (ACT+IFNa) in our phase I/II trial between 2006 and 2018. All patients had PD before treatment and seven patients did not complete their full cycle of three infusions due to rapid disease progression. Thirty-four patients completed one full cycle of T cell infusions and were evaluated for safety/toxicity, clinical response and immunological parameters (online supplementary figure 1). The patients were treated in three dose cohorts and received either TRT or TIL. The baseline characteristics of all patients are shown in table 1. Details of start of treatment, (pre)-treatment regimens and response to treatment of individual patients are given in online supplementary table 2. Comparison of previously described prognostic factors of worse OS did not differ at baseline between the different dose cohorts (table 1) nor between patients treated with TRT versus TIL (online supplementary table 3). Since several lines of systemic treatments are currently available for patients with stage IV metastatic melanoma, the majority of the evaluated patients (65%) received two or more lines of prior systemic therapies. Notably, the majority of TIL-treated patients (83%) was pretreated with checkpoint therapy (online supplementary table 3). The percentage of patients with a confirmed brain metastasis was higher in the group of patients treated with TRT when compared with TIL-treated patients, 50% vs 29.2%, respectively (online supplementary table 3). Univariate analyses of all baseline characteristics, including blood parameters previously reported to be important for immunuotherapy, such as absolute leukocyte, lymphocyte, neutrophil counts and ratios thereof29–33 showed that the WHO status as well as the leukocyte, monocyte and neutrophil counts as well as their ratios to lymphocytes were correlated with OS. In the multivariate analyses, only the WHO status, immunotherapy pretreatment and the monocyte-to-lymphocyte ratio (MLR) were associated with OS (online supplementary figure 2a, online supplementary table 4). Interestingly, except for MLR none of the other parameters was associated with time till progression after ACT in the multivariate analyses (online supplementary figure 2b, online supplementary table 5).
Supplemental material
Supplemental material
Supplemental material
Supplemental material
Supplemental material
Patient characteristics at baseline
Clinical responses to ACT in combination with IFNa
T cell treatment was safe and well tolerated since no treatment-related events >3 grading according to CTCAE were observed (online supplementary table 6). The adverse events were predominantly associated with the IFNa-treatment. A transient grade 3 leukopenia was observed in 4 out of 34 (11.8%) patients, grade 3 neutropenia in 5 of 34 (14.7%) patients and grade 3 lymphopenia in 7 of 34 (20.6%) patients, whereas most other patients experienced a mild leukopenia, neutropenia and lymphopenia.
Supplemental material
Thirty-four of the patients with progressive stage IV metastatic melanoma could be evaluated for treatment response according to RECIST. Responder patients who obtained clinical benefit (CB) of treatment were defined as patients with complete response (CR), partial response (PR) or durable ≥6 months stable disease (SD) according to RECIST. From the 34 evaluable patients, 2 showed a CR, 1 PR and 7 displayed a prolonged SD. Thus, 10 out of 34 (29,4%) of the treated patients were defined as responder patients. The overall 3-year OS was 14.1% (95% CI 1.9 to 26.3) and 3-year overall progression-free survival was 8.8% (95% CI 0 to 18.4). Patients were treated in different dose cohorts but the responses were distributed among all doses. The two patients who obtained a CR both had elevated lactate dehydrogenase (LDH) (between 250 and 500 U/mL). One patient had a confirmed brain metastasis, was treated in cohort I with TRT and did not receive prior immunotherapy. The other patient who obtained a CR did not have a brain metastasis, was treated with TIL in cohort II and was progressive after prior immunotherapy including anti-PD-1. The patient who obtained a PR had normal LDH, a confirmed brain metastasis and was immunotherapy naïve before treatment with TRT in cohort II.
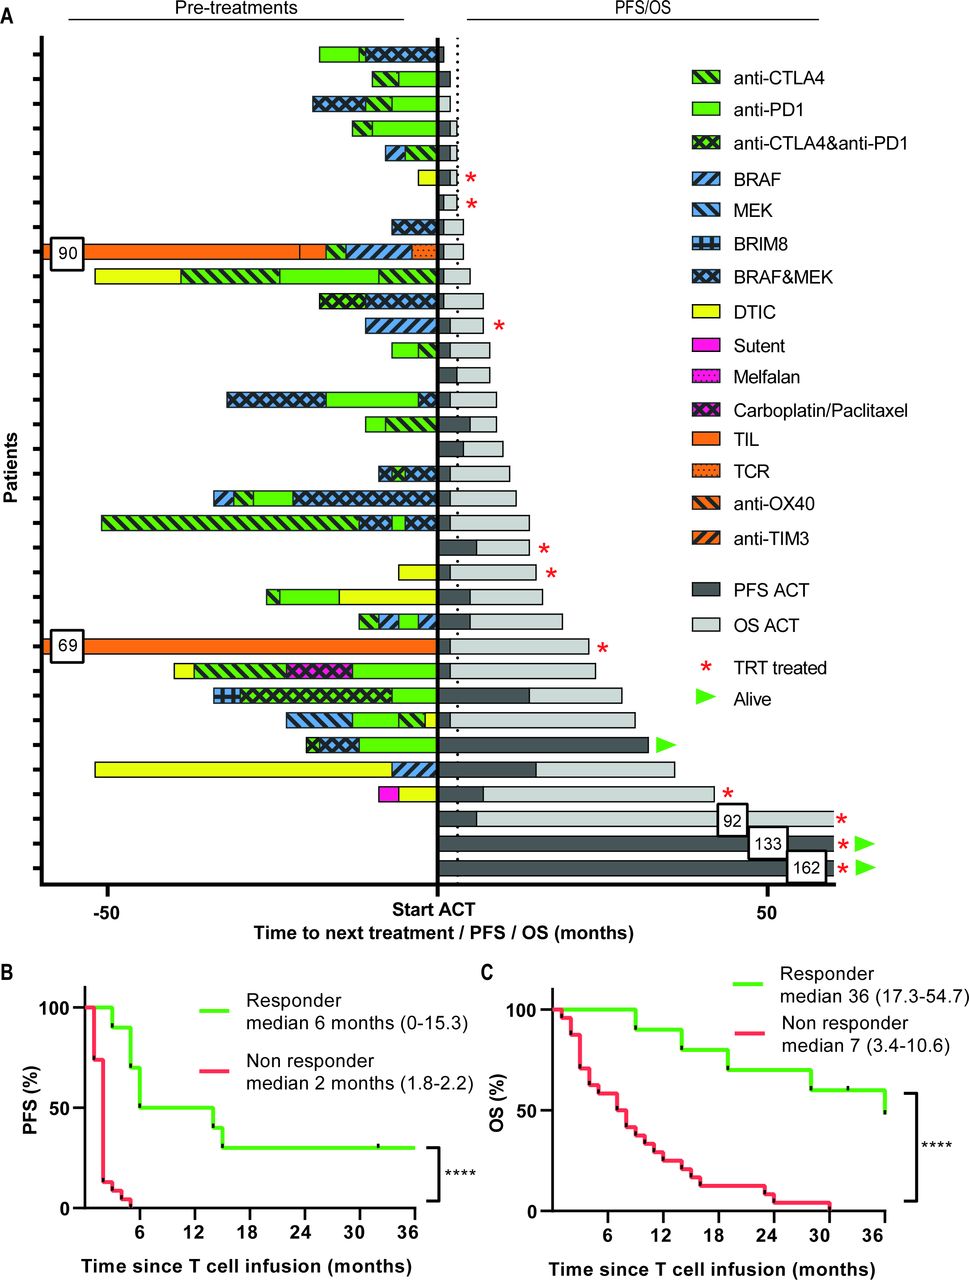
Interestingly, 6 out of 14 (42.8%) patients who were not pretreated with checkpoint therapy showed clinical benefit, whereas 4 out of 20 (20%) patients who received prior checkpoint therapy still responded to ACT+IFNa (figure 1A). In addition, we compared patients who were pretreated with less than three lines of treatment before the start of ACT and IFNa with patients who received three or more prior systemic therapies with respect to their response to ACT and IFNa. Overall, non-responding patients to ACT and IFNa were more frequently pretreated with three or more systemic therapies, when compared with patients who responded, 40% vs 14%, respectively. The 24 non-responder patients showed PD prior, at or after the first evaluation time-point. Interestingly, three out of the seven patients with SD and two patients with an SD <6 months showed a mixed response since some of their lesions clearly showed regression after ACT+IFNa suggesting that the infused TIL did have the capacity to kill tumor cells in vivo but that other factors hampered their efficacy in the other lesions (online supplementary figure 3).
Supplemental material

Pre-treatment and survival after start of ACT treatment. (A) Treatments received before start of ACT are depicted for every individual patient in the left part, followed by their PFS and OS in months in the right part. Kaplan-Meier curves for PFS (B) and OS (C) as measured from the start of therapy for responding (R, green lines, n=10, defined as CR, PR or SD >6 months) and non-responding (NR, red lines, n=24). Differences were calculated using the log rank test, ****p<0.0001. ACT, adoptive cell therapy; CR, complete response; OS, overall survival; PFS, progression-free survival; PR, partial response; SD, stable disease.
The responder patients showed a significantly longer time-to-progression when compared with non-responders (figure 1B). This indicates that the clinical benefit was durable as reflected by the significantly improved 1-year (90.0% versus 28.6%) and 3-year (46.7% versus 0%) OS in the responder and non-responder patients, respectively (p<0.0001, figure 1C). Importantly, interaction analyses between CB and the baseline MLR showed that the difference in time-to-progression after ACT+IFNa between responders and non-responders was not influenced by this baseline characteristic (online supplementary figure 4a). Similarly, the baseline MLR did not influence the OS in responder patients but the effect of the pretreatment MLR on OS was retained in the group of non-responders (online supplementary figure 4b) indicating that ACT+IFNa treatment successfully changed the clinical course of patients, even when they previously had progressed on checkpoint therapy.
Supplemental material
IFNa pretreatment induces leukopenia via the reduction of distinct subsets of immune cells
IFNa pretreatment resulted in a mild leukopenia detectable after 1 week of IFNa and characterized by a decrease in total leukocyte, neutrophil, monocyte and lymphocyte counts (figure 2A–E, pre start of IFNa treatment versus infusion 1). The numbers of leukocytes, in particular neutrophils and monocytes, rapidly bounced back in non-responders. In contrast, in responding patients IFNa pretreatment caused a reduction in leukocytes and neutrophils which was retained during the whole treatment period. No difference was observed in this respect between patients who obtained CR or PR versus SD. The number of these cells were significantly lower than in the non-responding patients at the time of TIL infusions. Monocytes were already lower at baseline and were not altered in responder patients (figure 2A–E). Consequently, the MLR was always lower in the group of responding patients when compared with the group of non-responders and also did not overtly change over time (figure 2H). All IFNa-induced changes were transient and recovered within several weeks after cessation of IFNa injections (not shown).
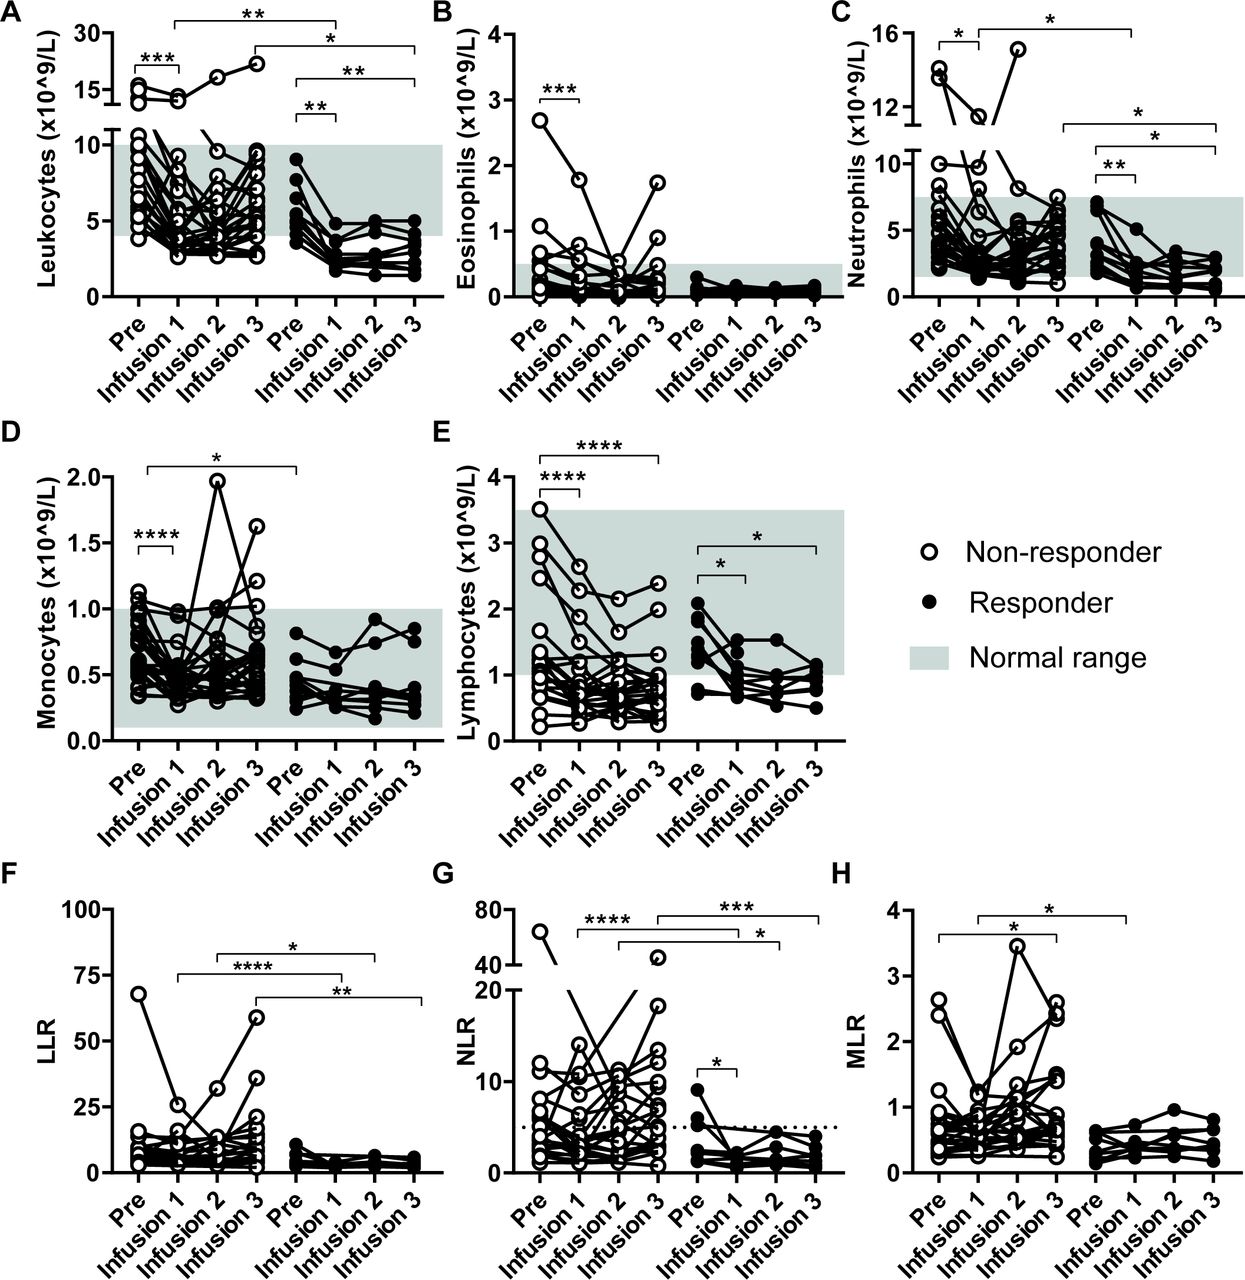
Treatment effect on peripheral blood counts. Absolute blood counts were performed on peripheral blood collected at different time points: before start of IFNa treatment (Pre) and at the time of T cell infusions (Infusion 1–3) just prior to the T cell infusion. Data from non-responding patients (n=24) are compared with data from responding patients (n=10, defined as CR, PR or SD >6 months) in each panel. The absolute leukocyte (A), eosinophil (B), neutrophil (C), monocyte (D) and lymphocyte count (E) are shown. In addition, the leukocyte-tolymphocyte (LLR) (F), neutrophil-to-lymphocyte (NLR) (G) and monocyte-to-lymphocyte (MLR) (H) ratios are shown. Differences within patients were calculated using the Wilcoxon signed rank test, data between response groups were calculated using a Mann-Whitney U test, *p<0.05, **p<0.01, ***p<0.001, ****p<0.0001. CR, complete response; IFN, interferon; PR, partial response; SD, stable disease.
Leukopenia induced by more intense preconditioning regimens for ACT may result in increased levels of circulating homeostatic cytokines.7 Therefore, we measured the serum levels of IL-7, IL-15 or IL-21 but no effect of IFNa on these cytokines was observed (online supplementary figure 5).
Supplemental material
To study the effects of IFNa on immune cells, the PBMC of 18 patients were analyzed with different sets of antibodies to analyze T cell subsets, MDSC, macrophages and DCs. In general, there were no effects on the percentages of CD3, CD8 and CD4 T cells relative to the total percentage of viable cells (online supplementary figure 6a-c). We used combined Hierarchical Stochastic Neighbor Embedding to analyze the complex set of different T cell populations detected by the antibody mix to inhibitory and memory markers. This revealed three distinct immune populations (clusters), comprising CD8+PD-1+CD45RO+CD62L+CD28+central memory T cells (#1), CD4+PD-1-CTLA-4+TIM-3+CD45RO+CD62L+CD28+central memory T cells (#5) and CD45RO-CD62L+CD28+CD8+PD-1+effector/central memory T cells (#10), which significantly decreased after IFNa pretreatment (figure 3A–D). Regulatory T cells were gated according to the consensus strategy,25 but no changes were observed (online supplementary figure 6d). Analysis of the different populations of myeloid cells revealed no changes in monocytic MDSC (CD14+HLA-DR-), M1 (CD14+HLA-DR+CD33-CD163-) or M2 (CD14+HLA-DR+CD33-CD163+) blood macrophages or on NK cells (CD3-CD56+) following IFNa treatment (online supplementary figure 6e-h). The percentage of CD14-CD11b-CD11c+DCs, however, decreased (figure 3E). Identification of the different subsets according to Villani et al 34 showed a decrease in CD32B+DC2, CD141-CD1c-DC4, whereas the CD36+CD163+DC3 and CD123+pDC increased (online supplementary figure 6i-m). Based on the earlier observation that CD14+CD16-HLA-DRhi classical monocytes predicted time-to-progression and OS on PD-1 blockade in metastatic melanoma,35 we analyzed non-classical (CD14±CD16++), CD14+CD16+intermediate and CD14+CD16- classical monocytes.35 36 Although significant shifts were observed after IFNa pretreatment in the non-classical and intermediate monocytes, this was not the case for the population of classical monocytes (figure 3F, online supplementary figure 6n,o).
Supplemental material
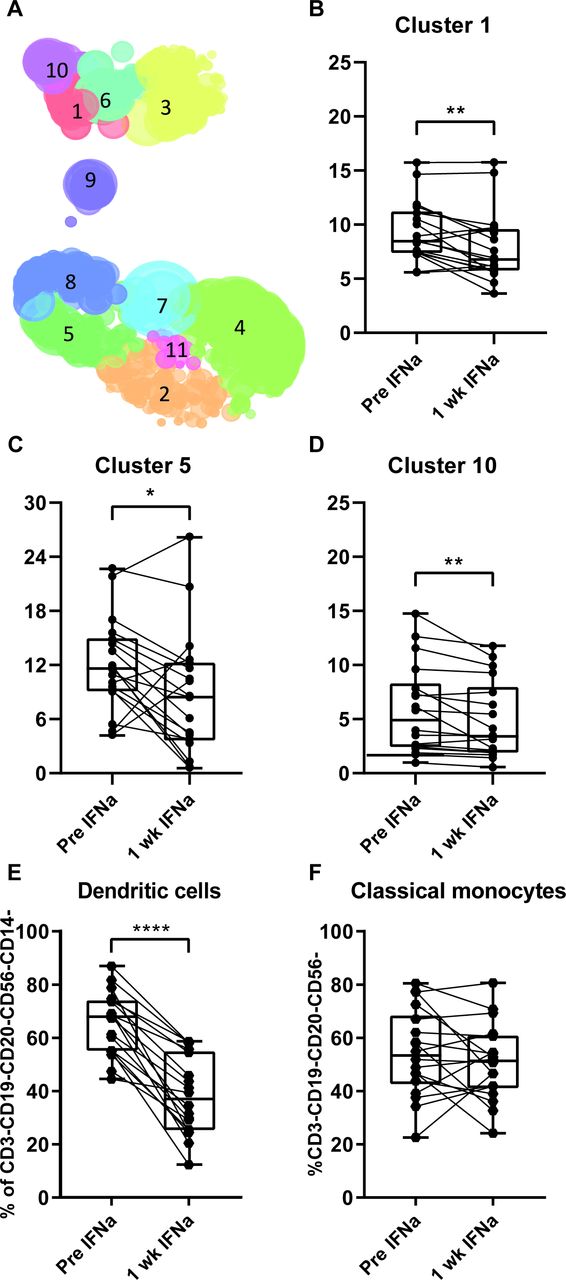
Effect of IFNa conditioning on phenotype of PBMC. Blood was collected before and 1 week after start of IFNa treatment, PBMCs were isolated and phenotypically characterized by flow cytometry. (A) The obtained data were analyzed by Hierarchical Stochastic Neighbor Embedding. Paired testing revealed three distinct immune clusters that were significantly decreased in percentage after 1 week of IFNa (B–D). Cluster 1 comprises CD8+PD-1+CTLA-4-TIM-3-central memory T cells (B), cluster 5 comprises CD4+PD-1-CTLA-4+TIM-3+central memory T cells (C) and cluster 10 comprises CD8+PD-1+CTLA-4-TIM-3-effector/central memory T cells (D). Significantly decreased percentages of dendritic cells (CD3-CD19-CD20-CD56-CD14-CD11b-CD11c+) (E), but not in classical monocytes (CD3-CD19-CD20-CD56-CD14+CD16-) (F) are shown. PBMCs from 18 patients were analyzed. Differences within patients were calculated using paired t-test, data between response groups were calculated using an unpaired t-test. Responding patients are defined as having a CR, PR or SD >6 months. *P<0.05, **p<0.01, ****p<0.0001. CTLA-4, cytotoxic T-lymphocyte-associated protein 4; CR, complete response; IFN, interferon; PBMC, peripheral blood mononuclear cell; PD-1, programmed cell death protein 1; PR, partial response; SD, stable disease.
In summary, IFNa pretreatment had distinct effects on different immune cells. Most notably, a sustained reduction in leukocytes and neutrophils was observed during the treatment period in responder patients. This may explain why the number of pre-existent neutrophils was not associated with the time-to-progression after treatment with ACT+IFNa.
ACT products comprise high percentages of CTLA-4 and PD-1 expressing T cells
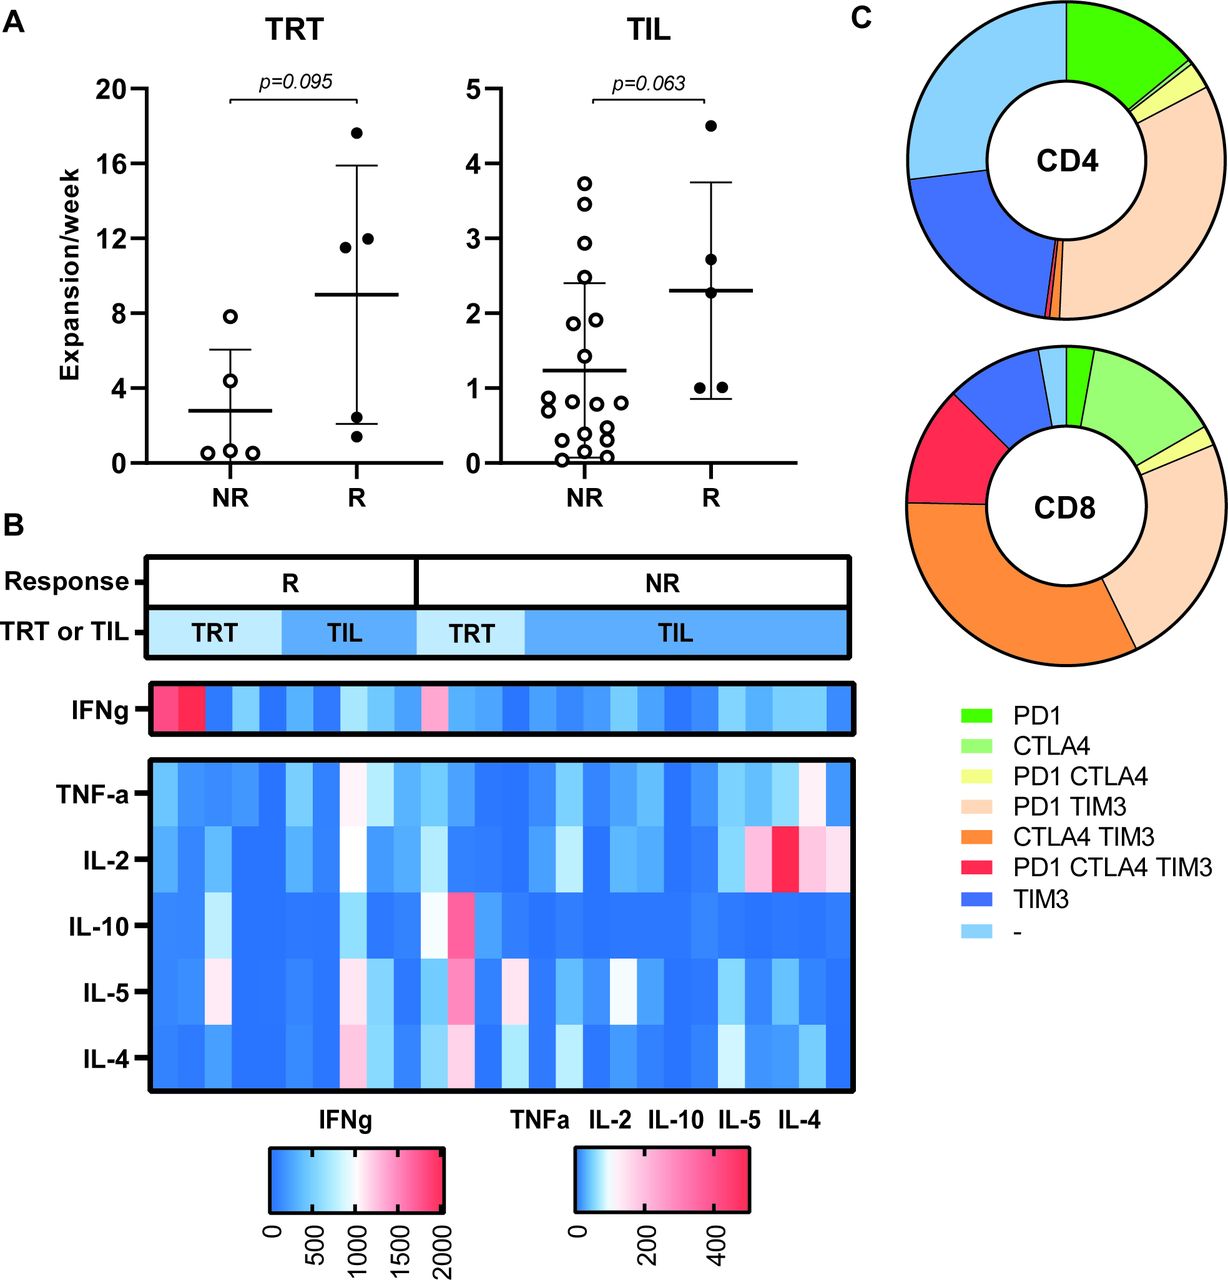
Ten evaluable patients were treated with TRT and 24 patients received TIL. We previously showed that the TRT in the MLTC cultures of responder patients proliferated stronger than in non-responders15 and a similar trend was observed here with respect to the TRT and TIL of responders (figure 4A). The TRT and TIL cultures comprised mainly CD3+ T cells (median and range: 99%, 74%–100%), but varied enormously in the ratio of CD3+CD8+ (median and range: 56.7%, 4%–95%) vs CD3+CD4+ (median and range: 42%, 5–96%) T cells. Based on the composition of the ACT product, the total number of CD8+ T cells that was infused could be calculated and was shown not to correlate with clinical outcome (online supplementary figure 7a)(). The majority of the ACT products (MLTC 9 out of 10; TIL 17 out of 24) produced predominantly IFNg when stimulated with the super-antigen SEB (figure 4B). The ACT product used for treatment of patients who obtained a CR or PR did not differ from other ACT products with respect to proliferation rate, ratio of CD3+CD8+ vs CD3+CD4+ cells or cytokines production.
Supplemental material

Characteristics of the ACT product used for treatment. The expansion rate of TRT (n=10) and TIL (n=24) used for infusions are depicted for responding (R, defined as CR, PR or SD >6 months) and non-responding (NR) patients (A). The expansion rate was calculated as the total number of cells after the initial expansion phase divided by the number of cells (for TRT) (or initiated wells (for TIL) at the start of the culture and the duration of the culture period in weeks. Differences were calculated using a Mann-Whitney U test. (B) The cytokine profile of the infused ACT products was analyzed after stimulation with staphylococcal enterotoxin B (24 hours) and cytokine production was measured by cytometric bead array assay. The concentration of the indicated cytokines produced by ACT products administered to responding patients (R, left side) and non-responding patients (NR, right side) are shown in the heatmap (n=28) . Concentrations of cytokines are shown according to the legend boxes below the figure with low concentrations indicated in blue and high concentrations in red. Whether patients were treated with TRT or TIL is indicated in the bar above the figure in light and dark blue, respectively. (C) The expression of checkpoint molecules/activation markers was analyzed by flow cytometry on infused T cells. The fraction of negative and single, double or triple positive CD4+ (upper) and CD8+ T cells are depicted in the pie plots (n=15). ACT, adoptive cell therapy; CR, complete response; OS, overall survival; PFS, progression-free survival; PR, partial response; SD, stable disease; TIL, tumor infiltrating T cells; TRT, tumor-reactive T cells.
The expression of the inhibitory markers CTLA-4, PD-1 and TIM-3 was analyzed on 14 ACT products. This revealed that a substantial percentage of the infused T cells express one or more of the checkpoint inhibitory markers (figure 4C). However, no overt differences were observed between the ACT products given to responder (n=6) and non-responder (n=8) patients (online supplementary figure 7b-i)online supplementary figure 7. These data suggest that the full capacity of the transfused T cells to control tumor cell growth may have been hampered due to checkpoint inhibition.
T cell reactivity to private tumor antigens is associated with longer overall survival
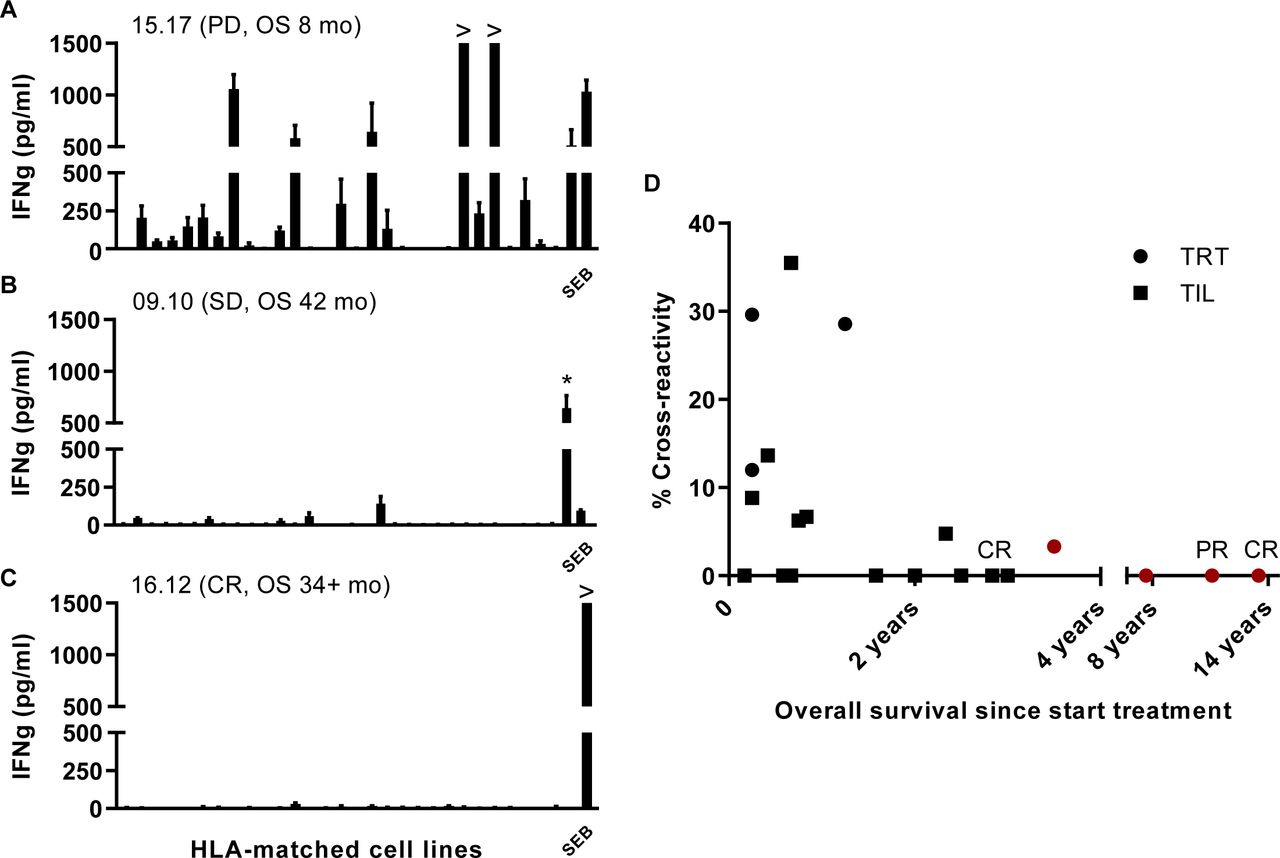
An important parameter for ACT is the recognition of tumor cells. As a first screen for T cell reactivity of the ACT products, we stimulated them with an extended panel of 37 different melanoma cell lines and scored the reactivity against all cell lines, matched for at least one HLA class I allele, as already published for a number of the TRT.15 In 8 of the 21 ACT products tested one or more of the matched cell lines were recognized (figure 5A–C). Plotting the level of cross-reactivity against OS suggested that treatment with a low (<7%) cross-reactive ACT product often results in longer OS (figure 5D). The absence of cross-reactivity may also indicate lack of tumor cell-reactivity. In order to elucidate if the correlation between OS and low cross-reactivity reflects the recognition of neoantigens, we set out to identify neoantigen reactivity for the four patients with the longest OS including one CR and one PR patient, of whom also an autologous cell line was available. The presence of neoantigen-specific T cells in the ACT products was previously reported for two of the four patients26 37 and using the same approach now also in the ACT products of the two other patients with a relatively long survival after therapy. Whole exome sequencing revealed 306 and 605 non-synonymous mutations. and based on RNA expression level 207 and 106 potential neoantigens were detected, respectively, in these two patients. Analyses of the peptides harboring the mutated sequences that were recognized showed neo-epitope-specific T cell reactivity against one and seven epitopes, respectively, in each patient (table 2). These data show that the lack of cross-reactivity in the ACT products of long-living patients more likely is associated with the specific recognition of private antigens.

Cross-reactivity of ACT products. The recognition of shared antigens was investigated using a panel of melanoma cell lines that share at least one HLA class I allele. Recognition of allogeneic cell lines is defined as cross-reactivity. The percentage cross-reactivity is depicted and calculated by division of number of cell lines recognized by the number of cell lines tested×100%. Results for TRT (n=7) and TIL (n=14) are depicted. Representative examples of three ACT products with a relatively high or low percentage cross-reactivity are depicted (A–C). (A) A high percentage cross-reactivity was observed for TIL of patient 15.17, who was progressive on treatment and had an OS of 8 months. (B) Shows a rather restricted recognition pattern for TRT of patient 09.10 who obtained stabilization of disease and a relatively long OS, while (C) shows the recognition pattern of TIL from a complete responder 16.12, who only recognizes the positive control (SEB). Asterisk (*) indicates the autologous cell line of patient 09.10. ACT, adoptive cell therapy; CR, complete response; HLA, human leukocyte antigen; IFN, interferon; OS, overall survival; PD, progressive disease; PR, partial response; SD, stable disease; SEB, SEB, staphylococcal enterotoxin B; TIL, tumor infiltrating T cells; TRT, tumor-reactive T cells.
Mutation load, putative and identified immunogenic neoantigens in melanoma cell lines
Discussion
Adoptive transfer of both TIL and TRT in combination with IFNa is safe, feasible and results in clinical benefit in 10 of 34 (29%) patients with stage IV metastatic melanoma.
The ACT product infused in responders and non-responders did not overtly differ in composition, cytokine production or expression of CTLA-4, PD-1 and TIM-3 co-inhibitory molecules. However, we observed in a number of cases cross-reactivity to melanoma cell lines which were HLA-matched for at least one allele. In those cases, the patients displayed short OS after treatment, while a longer OS was observed for the patients of which the ACT product showed no to low cross-reactivity to allogeneic HLA-matched melanoma cell lines. Four of the very long survivors were treated with an ACT product that displayed no cross-reactivity, but recognized somatically mutated antigens identified in the autologous melanomas. This suggests that treatment with neoantigen-specific T cells may increase clinical benefit. This is supported by the finding that mutational load predicts clinical outcome after ACT in patients with melanoma38 and that response to checkpoint inhibitors mediated by reinvigoration of tumor-specific T cell reactivity is also correlated with mutational load in melanoma and other malignancies.39–41
Similar to what has been reported for other immunotherapy trials,30–33 the MLR was associated with shorter OS of the whole group by multivariate analyses. Elevated neutrophil-to-lymphocyte ratio (NLR) has been shown to predict poor response to nivolumab in melanoma.42 There was no apparent association between NLR and OS in our trial, which may be explained by the fact that the NLR is normalized by IFNa conditioning thus abrogating impact on survival. In contrast to the NLR, the MLR was associated with shorter survival and shorter time-to-progression. Interestingly, the MLR displayed an impact on OS only in those patients who did not respond to therapy, as shown in the interaction analyses. Apparently, the MLR normalization by IFNa, which was most pronounced in the non-responding patients displaying higher pretreatment MLR levels, was not strong enough to revert the impact of baseline levels on OS and progression. The relatively mild leukopenia obtained by IFNa may also explain why we do not observe an increase in homeostatic cytokine levels. Elevation of serum IL-7 and IL-15 levels after lymphodepletion are suggested to be of critical importance for clinical response after ACT,7 although elevated levels were not directly compared with clinical response and especially the role of IL-7 seems less important.22 43 Nevertheless, if these cytokines and induction of leukopenia are of major importance for treatment outcome it is advised to choose a more intense conditioning regimen for patients with a relatively good condition, whereas the mild conditioning using IFNa may be more appropriate for the remaining patients otherwise not eligible for ACT.
Overall, IFNa conditioning induces leukopenia and neutropenia and favorable blood count ratios that, if persistent during therapy, correlate with clinical response. Leukocytosis has been suggested to be driven by the increased production of homeostatic cytokines, in particular granulocyte-colony stimulating factor and IL-6, by tumor cells or other cells in the tumor microenvironment,44 45 which augments hematopoiesis and migration of myeloid progenitor cells from the bone marrow to the blood. Potentially, the infused T cells of responder patients effectively reduced the tumor load, thereby decreasing the production of homeostatic cytokines and consequently the induction of leukocytosis. Hence, a failure of the ACT product to control tumor growth may explain the leukocyte rebound as observed in non-responders.
We observed that the percentage of immunotherapy-naïve patients responding to therapy is twice that of the group of patients who were progressive on prior immunotherapy, confirming the results of a recently published study in which patients progressive on CTLA-4 blockade responded worse to ACT than CTLA-4-naïve patients.11 More importantly, our data show that patients with resistance to PD-1 blockade may still respond to ACT using a mild conditioning and support regimen, confirming other recent studies reporting a 22%–38% response rate after ACT in patients resistant to anti-PD-1 immunotherapy.22 46 Interestingly, Sarnaik et al reported that TIL therapy was not effective in patients who developed secondary resistance to PD-1 blockade.46 These findings underscore the hypothesis that patients who acquire immune escaped tumor variants after checkpoint blocking therapy may include modifications that also affect TIL-mediated tumor eradication, for example, antigen loss or HLA loss or other defects in the antigen processing pathway.47 However, some of the patients in our study developing SD after ACT included a patient who initially had responded to anti-PD-1, indicating that secondary resistance to checkpoint therapy does not exclude patients to benefit from ACT therapy per se. This latter also applies to patients who develop (severe) autoimmune side effects leading to permanent discontinuation of checkpoint blockade, which occurs in approximately 15% of the cases.48 Patients achieving CB in our trial displayed a lower objective response rate when compared with a recently reported ACT trial in patients with melanoma.11 This may partially be due to the fact that a higher number of patients in our trial had unfavorable staging and LDH levels, and also received more lines of prior therapy. The fraction of patients in our trial that were pretreated with anti-CTLA-4 (with or without anti-PD-1) was twice as high as that in the study by Forget et al.11 In their study, this was shown to result in reduced response to therapy and shorter OS compared with that obtained in treatment-naïve patients (24.6 versus 8.6 months; HR, 2.3; 95% CI, 1.3 to 4.1, p=0.003). However, the median OS in the CTLA-4-pretreated group in their trial (8.6 months) was similar to what was observed in our trial (9 months).
A substantial percentage of the infused T cells express one or more of the inhibitory checkpoint molecules CTLA-4, PD-1 or TIM-3. Whereas the transient expression of PD-1 and other checkpoint molecules is induced after normal T cell activation, the sustained expression and gradual accumulation of multiple checkpoint molecules is associated with T cell exhaustion due to continued antigenic stimulation in the tumor environment comparable to what is observed during chronic viral infection. Continued expression of multiple checkpoint molecules is associated with gradual loss of effector function and proliferative capacity.49 The association between impaired proliferation of infused T cells with worse clinical response observed in our trial, thus may reflect an increased exhausted phenotype, although there is no significant difference in the frequency of inhibitory marker positive T cells between infusion products administered to responding and non-responding patients. However, the simultaneous expression of multiple inhibitory checkpoint molecules may reflect true exhausted T cells.50–52 To overcome this, ACT in combination with anti-PD-1 is proposed and implemented in our recently initiated and currently ongoing trial (NCT03638375).
Acknowledgments
The authors would like to thank Vanessa van Ham for technical assistance, Huib Ovaa for peptide synthesis, Guillaume Beyrand for assistance with FACS data analysis using R-package cytofast, Willem-Jan Krebber from ISA Pharmaceuticals for synthesis and prediction peptides using the ISABELLA algorithm and John Haanen for clinical advice during the trial.
References
Footnotes
EV and MKvdK are joint first authors.
EK and SHvdB are joint senior authors.
Contributors EV, EK and SvdB designed the clinical study. GL performed surgery and provided the resected tumor. PM and ATvS performed QP and QC checks of the production process and of the infusion product. IR and EK treated the patients. EV, MvdK, EK and SvdB analyzed and interpreted the patient data. EV, MvdK and SvdB designed and interpreted the monitoring experiments. EV, MvdK, MV, CvdM, LdB produced the infusion product and performed all analysis. MW and SS designed and validated the Ab panels for flow cytometry. EV, NdM, MV and SvdB designed, executed and interpreted the neoantigen identification experiments. EV, MvdK and SvdB wrote the manuscript and all authors read and approved the final manuscript.
Funding This work was financially supported by grants from the Anticancer Fund and the Dutch Cancer Society-KWF grant 2012–5544 and 2017–10815 to EV and SHvdB.
Competing interests None declared.
Patient consent for publication All patients gave written informed consent before inclusion in this study.
Ethics approval This phase I/II study was approved by the Medical Ethics Committee of the Leiden University Medical Center (study number P04.085) and conducted in accordance with the Declaration of Helsinki.
Provenance and peer review Not commissioned; externally peer reviewed.
Data availability statement All data relevant to the study are included in the article or uploaded as supplementary information. The datasets used and/or analyzed during the current study are available from the corresponding author on reasonable request.