Article Text

Abstract
Background Regulatory T (Treg) cells play a negative role in anti-tumor immunity against triple-negative breast cancer, so it is of great significance to find the potential therapeutic target of Treg cells.
Methods First, Annexin A1 (ANXA1) expression and survival of patients with breast cancer were analyzed using TCGA data. Then plasma ANXA1 levels in patients with malignant and benign breast tumors were detected by ELISA. Next, the effect of ANXA1 on Treg cells was studied through suppressive assays, and how ANXA1 regulates the function of Treg cells was detected by RNA sequencing. Finally, the in vivo experiment in balb/c mice was conducted to test whether the ANXA1 blocker Boc1 could shrink tumors and affect the function of Treg cells.
Results Our data suggest that ANXA1 expression is associated with lower survival and a higher risk of breast malignancy. Suppressive assays show that ANXA1 can enhance the inhibition function of Treg cells. RNA-Sequencing results indicate that Boc1 could reduce the expression of granzyme A mRNA in Treg cells. Animal experiments have been done to show that Boc1 can reduce tumor size and down regulate Treg cell function.
Conclusions ANXA1 can enhance the function of Treg cells and reduce the survival rate of patients with breast cancer. Targeting ANXA1 can reduce Treg cell function and shrink breast tumors.
- tumours
- immunology
This is an open access article distributed in accordance with the Creative Commons Attribution Non Commercial (CC BY-NC 4.0) license, which permits others to distribute, remix, adapt, build upon this work non-commercially, and license their derivative works on different terms, provided the original work is properly cited, appropriate credit is given, any changes made indicated, and the use is non-commercial. See http://creativecommons.org/licenses/by-nc/4.0/.
Statistics from Altmetric.com
Background
Breast cancer is the most common cancer among women worldwide, with 2,088,849 new cases and 626,679 deaths, according to GLOBOCAN 2018.1 Triple-negative breast cancer (TNBC), defined as non-expression of estrogen receptor (ER) and progesterone receptor (PR), and no amplification or overexpression of human epidermal growth factor receptor 2 (HER2), accounts for 10%–20% of breast cancers, with high early distant recurrence rate and poor 5-year survival rate.2 3 Studies have shown that TNBC has higher immunogenicity and tends to have higher regulatory T cells (Treg cells) infiltration than other subtypes.4–8
Treg cells expressing the transcription factor Forkhead Box P3 (FOXP3) play a pivotal role in maintenance of immune homeostasis by suppressing self-reactive T cells and other cells. In addition, Treg cells could impede anti-tumor immune responses.9 10 Data indicate that higher numbers of FOXP3-positive Treg cells identified patients with breast cancer with both shorter relapse-free and overall survival.11
Annexin A1 (ANXA1), also known as lipocortin I, belongs to the annexin family of Ca2+-dependent phospholipid-binding proteins.12 It plays important roles in the innate immune response as effector of glucocorticoid-mediated responses and regulator of the inflammatory process, and has anti-inflammatory activity.13 In resting conditions, cells contain high levels of ANXA1 in cytoplasm; after being activated, ANXA1 is mobilized to cell surface and secreted.14 ANXA1 signals through a seven-membrane-spanning G-protein-coupled receptor, known as formyl peptide receptor 2 (FPR2; also known as ALXR in humans). ANXA1 could inhibit neutrophil adhesion and promote neutrophil apoptosis.15 Previous studies have shown that Ac2-26 is an ANXA1-like peptide, while Boc1 is an ANXA1 antagonist that can competitively bind to the FPR2 receptor.16–18 Previous data show that high expression of ANXA1 is associated with poor survival of patients with breast cancer, especially TNBCs.19 20 Previous results show that FPR2 is found to be highly expressed in Treg cells, which indicates that ANXA1 may have important effects on Treg cells.21–23 However, ANXA1 functions in Treg cells remain largely unknown.
Therefore, it is of great significance to find the target of Treg cells for the treatment of TNBC. In our study, we first analyzed the relationship between ANXA1 expression and survival of patients with breast cancer. Next, we measured ANXA1 levels in patients with breast cancer and found that patients with TNBC had higher ANXA1 levels and more Treg cell infiltration. Subsequently, we investigated whether ANXA1 could affect the function of Treg cells and how ANXA1 regulated the function of Treg cells. Finally, we established mice tumor-bearing model to investigate whether the function of Treg cells can be weakened by blocking ANXA1, thus enhancing anti-tumor immunity. Based on these data, we demonstrated that ANXA1, by enhancing the suppressive function of Treg cells, can have a great impact on immune regulation and tumor growth, so our studies reveal that it is a potential target for future breast cancer treatment.
Methods and materials
TCGA data analysis
TCGA data were download from https://www.cancer.gov/ and Kaplan-Meier analysis was conducted as the methods described previously.24 25
Patient samples collection
The measures for preparation of cell suspension were described as previously reported.26 Briefly, tumor tissues (100 mm3), adjacent normal tissues (100 mm3) and peripheral blood (4 mL) were collected from patients with mammary tumor prior to their surgical procedures. Patients’ characteristics are listed in table 1. All tissue specimens were taken from hospital within 6 hours and cut into smaller pieces. Then they were incubated in 300 U/mL type IV collagenase (Sigma) for 1 hour at 37℃. After passing through a 200-mesh (75 μm) and then a 300-mesh filter (50 µm), cells were washed with phosphate-buffered saline (PBS, 0.01 M). Peripheral blood (4 mL) was obtained from patients with mammary tumor prior to their surgical procedures. The plasma was collected after centrifugation at 500 g, 5 min and 4°C. Peripheral blood mononuclear cell (PBMCs) were isolated by density gradient centrifugation with Ficoll-Paque (GE Healthcare). The enrolled patients were followed up by telephone. The whole process was performed according to the Declaration of Helsinki.
Characteristics of patients
Enzyme-linked immunosorbent assay
ELISA was performed according to the manufacturer’s guidance (human ANXA1 ELISA kit, Abcam, ab222868). Briefly, 50 µL standards or samples were added to appropriate wells and incubated at room temperature for 2 hours. Then 50 µL biotinylated antibody was added to all wells and incubated at room temperature for 1 hour. After washing, 50 µL streptavidin–peroxidase conjugate was added to all wells and incubated at room temperature for 30 min. After washing again, 50 µL chromogen substrate was added to all wells and incubated at room temperature for 15 min. Lastly, 50 µL stop solution was added to each well and the plate was read at 450 nm on microplate system (Bio-Tek ELX800).
Flow cytometry
For surface staining, cells were harvested and incubated in PBS containing 1% fetal bovine serum (FBS) with antibodies (Fixable Viability Dye eFluo 780, 1:1000, eBioscience, 65-0865-14; anti-Human CD4-Alexa Fluor 405, 1:100, Invitrogen, RM4-5, MCD0426; anti-Human CD8 Brilliant Violet 510, 1:100, Biolegend, HIT8a, V CD08.10; anti-Human FPR2-Alexa Fluor 594, 1:100, Santa Cruz, GM1D6, sc-57141; anti-Mouse CD4-Alexa Fluor 700, 1:100, eBioscience, RM4-5, MCD0429; anti-Mouse CD25-PE, 1:100, eBioscience, PC61.5, 12-0251-82; anti-Mouse CD8-FITC, 1:100, eBioscience, 53-6.7, 11-0081-82; anti-Mouse CD279-PE-Cy7, 1:100, eBioscience, J43, 25-9985-82; anti-Mouse CD152 PerCP-eFluor 710, 1:100, eBioscience, 14D3, 46-1529-42). For intracellular staining, cells were fixed/permeabilized (eBioscience) and incubated with antibodies (anti-human FOXP3-APC, 1:100, eBioscience, 77-5776-40; anti-mouse FOXP3-APC, 1:100, eBioscience, FJK-16s, 17-5773-82; anti-Mouse Ki-67 eFluor 450, 1:100, eBioscience, SolA15, 48-5698-82). For cellular proliferation, CellTrace Violet proliferation kit (Invitrogen, C34557) was used. Data were collected on Fortessa flow cytometer (BD Biosciences) and analyzed by FlowJo (TreeStar).26 27
Cell culture
Human umbilical cord blood was collected from Obstetrics and Gynecology Department, Renji Hospital, Shanghai Jiaotong University School of Medicine. PBMCs were isolated by Ficoll-Paque (GE Healthcare) as described above. Naive T cells (CD45RA+CD4+CD25loCD127hi) were sorted by fluorescence activated cell sorter (FACS) ARIA II cell sorter (BD Biosciences) with a purity of 90%–95%. Induction of Treg cells in vitro was performed in X-VIVO (Lonza) medium, with 10% FBS (Invitrogen, 10100147), 1% GlutaMax, 1% sodium pyruvate, 1% non-essential amino acids solution, 1% Pen/Strep, 100 U/mL rhIL-2 (R&D Systems), 5 ng/mL rhTGF-β (R&D Systems) and anti-human CD3/CD28-conjugated Dynabeads (Gibco, 11132D) at a bead:cell ratio of 1:4. After 5 days, the cells were harvested and tested for FOXP3 expression by flow cytometry.26 27
Quantitative real-time PCR (qPCR)
Sample RNA was extracted using TRIzol (Invitrogen) followed by reverse transcription by PrimeScript RT reagent Kit (Cat#RR037A; Takara, Japan). Then, the cDNA samples were prepared for real-time PCR analysis by TB Green Premix Ex Taq II (Cat#RR820A; Takara) and the primers to assess transcript levels of each gene. Three repeats were made for each gene in each sample. Primers for real-time PCR are listed in table 2.
Primers for real-time PCR
Suppressive assays
CD45RA−CD4+CD25loCD127hi T cells (T effector cells, Teff) were isolated from healthy donor PBMC, and were then labeled with CellTrace Violet (CTV, Invitrogen, C34557). The same number of Teff cells (4×10⁴) were added activated with anti-CD3/CD28 beads (Teff:beads=4:1) in each well of a round-bottom 96-well plate. Then serially diluted Treg cells (Teff:Treg=1:0, 2:1, 4:1, 8:1 and 16:1, respectively) were added and cultured for 3 days.26 27 In the experimental group, Ac2-26 (20 µM, ANXA1 similar peptide, R&D System, 1845) was added to each well, while the same volume of PBS was added to the control group.16 17 Teff cells without stimulation by anti-CD3/CD28 beads were regarded as negative control. All experiments were repeated three times. Cellular proliferation by CTV was further detected by flow cytometry. The decrease of Teff cell proliferation rate suggested that Treg cell function was enhanced.
RNA sequencing
The same dose of Ac2-26 (20 µM) was added to human Treg cells (cells were collected as previously described), which were activated with anti-CD3/CD28 beads (Treg:beads=4:1). Boc1 ((1R,2R)-trans-N-Boc-1,2-cyclohexanediamine, 50 µM, Selleck, S3896) was added to the experiment group, and the same dose of solvent was added to the control group.18 The cells were harvested after 4 hours. The samples were sent for RNA-sequencing analysis. The sequencing results and enrichment analysis results are listed below.
Animal experiment
All the mice (balb/c wild type, female, 6 weeks, n=16) were purchased from Jackson Laboratory. 4T1 suspension (2×10⁵) was injected into the fourth pair of mammary fat pads on the left under the skin of each mouse. After the average tumor size exceeded 150 mm3, Boc1 was intraperitoneally injected into experimental mice (n=8) at a dose of 10 mg/kg. The drug was given every 24 hours for 7 days. Meanwhile, the same dose of solvent was intraperitoneally injected into control mice (n=8). Tumor size was measured daily after tumor growth in each mouse. After the mice were sacrificed, the tumors were taken from the animal laboratory within 6 hours and prepared into cell suspension according to the previously described method. Then the cells were labeled with flow cytometry antibodies, as methods described previously. Livers, lungs and other organs were taken and preserved by 4% paraformaldehyde. Pathological sections were prepared to search for metastatic lesions.
Immunofluorescence
Briefly, specimens were collected and then they were fixed in 4% paraformaldehyde for 30 min. Next, the specimens were washed three times and incubated in blocking buffer (PBS, 3% bovine serum albumin (BSA), 0.5% Triton X-100, 10% FBS). Then they were incubated with primary antibodies for 1 hour in binding buffer (PBS, 3% BSA, 0.5% Triton X-100), followed by washing and incubation in secondary antibodies, and nuclei stain DAPI for 1 hour. Samples were used as immunofluorescence slide (CD8A, Cy5; FOXP3 SP-Orange and nuclear DAPI). All the processes should be at room temperature with avoidance of light. Lastly, the samples were observed on a Leica TCS SP5 microscope (Leica). CD8+ T cells and FOXP3+ cells were counted on each of the slides at high-power field (×400). Both groups included three tumors, and five high-power fields were calculated for each tumor.
Apoptosis assays
Apoptosis measurements were conducted using the Annexin V-PE/7-AAD apoptosis detection. Briefly, 1×10⁶ 4T1 cells were plated in six-well plates. After treated with Boc1 (20, 50, 100 µM) for 24 hours, or equivalent DMSO, cells were harvested. Next, 100 µL of Annexin V-binding buffer was added to the cells followed by the addition of 5 µL of Annexin V-PE (1 µg/µL) and 5 µL of PI (10 µg/µL). Cells were then incubated at 25°C in the dark for 20 min. All experiments were performed in triplicate. Apoptosis rate was determined using flow cytometry (FACS Calibur; BD Biosciences).
Transwell migration assays
The transwell migration assay was explored to measure migration ability of 4T1 cells in response to Boc1. Briefly, 5×10⁴ 4T1 cells were seeded in the upper chamber with serum-free medium. Boc1 (50 µM) or the same dose of DMSO solution was added to the upper chamber. Then, fresh DMEM supplemented with 10% FBS was added to the lower chamber in a 24-well plate (Corning, NY, USA). Then, this plate was incubated at 37°C with 5% CO2 for 24 hours. Next, the cells were fixed with 4% paraformaldehyde for 1 hour and stained with 0.5% crystal violet for 5 min at room temperature.
Cytotoxicity assays
The cytotoxic effects of Boc1 on 4T1 cells were detected by CCK-8 (Dojindo Laboratories). Briefly, 5×10³ 4T1 cells per well were seeded in 96-well plates. After 4 hours, a series of concentrations of Boc1 were added to these wells. Then, the cells were incubated for 24 hours at 37°C. Next, 10 µL of CCK-8 solution was added to each well of the plate and incubated for 4 hours. Lastly, the absorbance was measured at 450 nm using the BioTek ELx800 Universal Microplate Reader (BioTek, Winooski, VT, USA). The cell viability was calculated as: [(A−B)/(C–B)]×100%, where A, B and C were defined as the absorbance of experimental samples, blank controls and untreated samples, respectively. The IC50 values for Boc1 on 4T1 were calculated by GraphPad Prism V.7 (CA, USA).
Statistical analysis
The statistical significance of the data was calculated with paired, two-sided Student’s t-test performed using GraphPad Prism V.7. Generally, p values <0.05 were considered statistically significant: *p<0.05; **p<0.01; ***p<0.001; ns, not significant.
Results
High ANXA1 expression is associated with poor survival
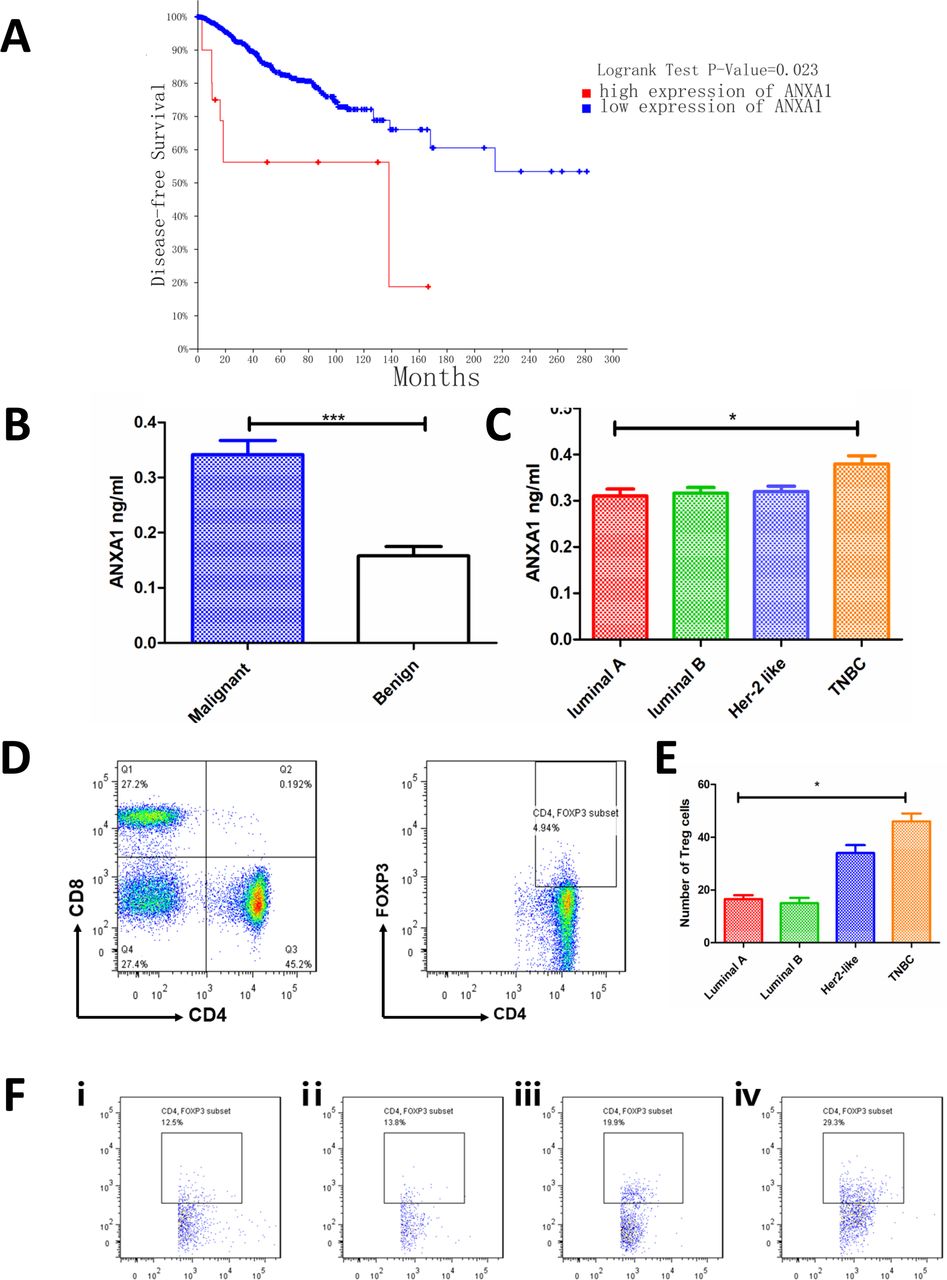
First, we verified the expression of ANXA1 and its association with survival of patients with breast cancer. We noticed that high ANXA1 expression patients have poorer disease-free survival than low patients (high ANXA1, n=22; low ANXA1, n=2663; figure 1A; patient lists, see online supplementary table 1 and online supplementary table 2. We then detected ANXA1 expression in the plasma of patients and found that the expression of malignant patients was higher than that of benign patients (figure 1B). Then, we compared the expressions of the four subtypes of breast cancer luminal A, luminal B, Her-2 like and TNBC, and we found that patients with TNBC had the highest expression of ANXA1 (figure 1C). Then the tumor specimens of malignant patients were prepared into cell suspension for flow cytometry detection. The number of cells collected from each specimen was the same, and CD4+ T cells and CD4+FOXP3+ (Treg) cells were gated as shown in figure 1D. Percentage of Treg cells in different subtypes of breast cancer is shown in figure 1F. The results showed that patients with TNBC had a higher number of Treg cells than other subtypes (figure 1E; gating strategies see supplementary figure 1A and fluorescence minus one (FMO) control see supplementary figure 1B, online supplementary file 1).
Supplemental material
Supplemental material
Supplemental material
Supplemental material

ANXA1 is associated with poor survival of patients with breast cancer. (A) Kaplan-Meier survival curves show disease-free survival in patients with breast cancer with low and high ANXA1 (high ANXA1, n=22; low ANXA1, n=2663, p=0.023, log-rank test). (B) Plasma ANXA1 level was higher in malignant patients (n=66) than in benign patients (n=8) (plasma, tested by ELISA). (C) Patients with TNBC (n=12) have higher ANXA1 levels than luminal A (n=17), luminal B (n=28) and Her-2 like (n=9) patients (plasma, tested by ELISA). (D) The tumor specimens were prepared into cell suspension and tested by flow cytometry; figures show how CD4+ T cells and Treg cells (CD4+Foxp3+) are gated. (E) The number of Treg cells in different subtypes of tumor specimens. All data represent mean±SD. *p<0.05, **p<0.01, ***p<0.001 as determined by Student’s t-test. (F) Percentage of Treg cells in different subtypes of breast cancer. (ⅰ) Luminal A; (ⅱ) luminal B; (ⅲ) Her-2 like; (ⅳ) TNBC. TNBC, triple-negative breast cancer.
ANXA1 promotes Treg cells’ suppressive functions
Next, we studied the effect of ANXA1 on Treg cell–mediated immune suppression. First, we detected the expression of FPR2 (ANXA1 receptor) in Teff and Treg cells by qPCR and flow cytometry. The results indicate that the mRNA and protein levels of FPR2 are higher in Treg cells (figure 2A,B). The proliferation rate of Teff cells without being activated by anti-CD3/CD28 beads was close to zero, which was a negative control (figure 2E). The proliferation rates of Teff cells (Teff:Treg=1:0) with and without 20 µM Ac2-26 (ANXA1 similar peptide) were compared. The data show no statistical significance (figure 2D,F). In suppressive assays, when Teff:Treg=2:1, 4:1, 8:1 and 16:1, the proliferation rates of Teff cells were 11.9%, 22.9%, 65.7% and 70.3%, respectively, compared with 17%, 33.1%, 76.3% and 79.4% in the control group (figure 2D). Teff proliferation rate was lower when 20 µM Ac2-26 was added to the cell culture medium (figure 2G).
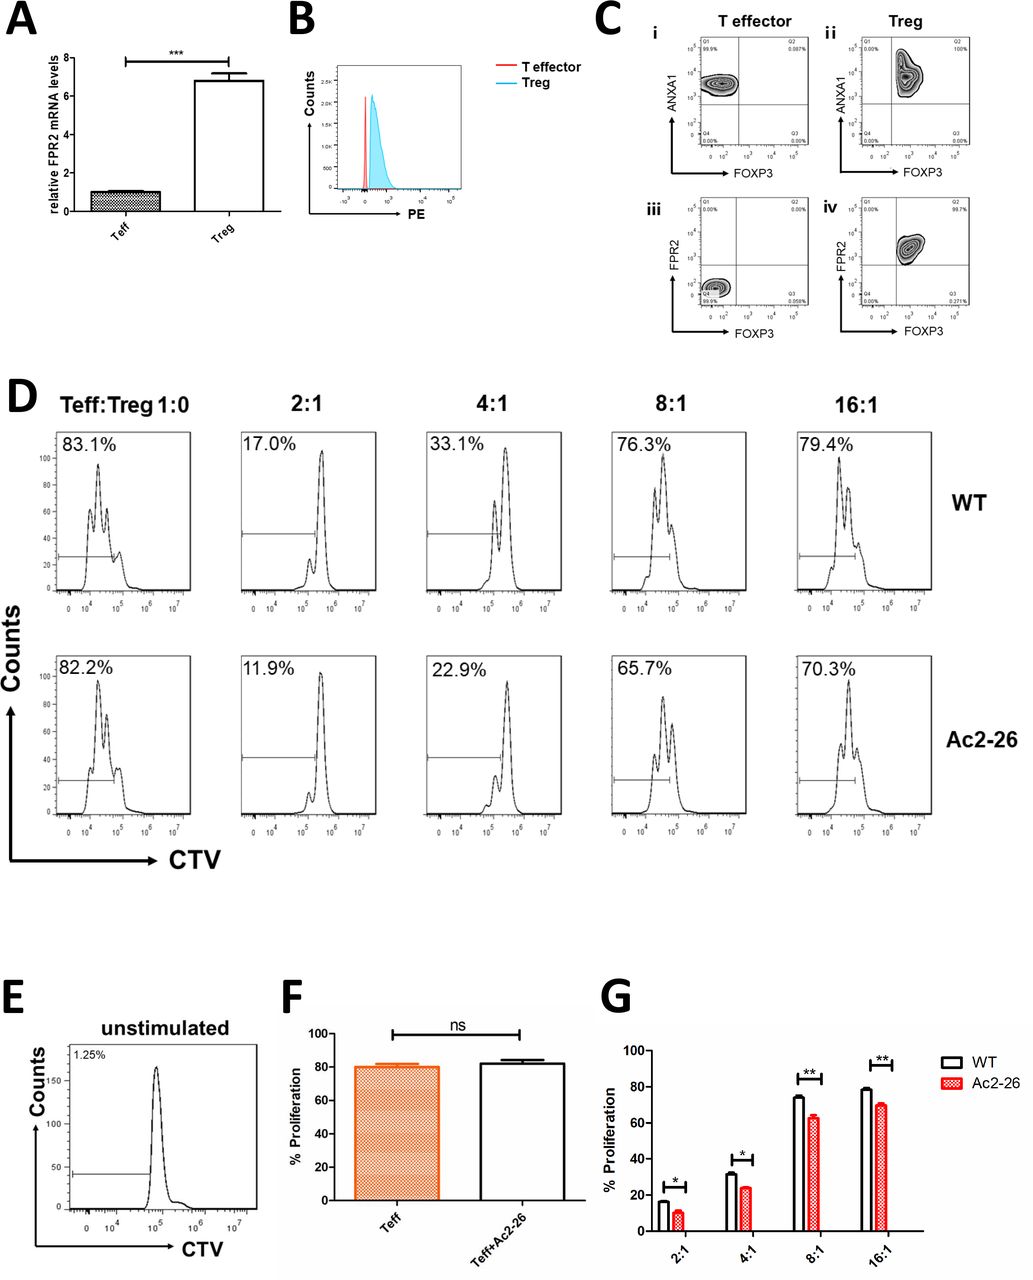
ANXA1 enhances the suppression function of Treg cells. FPR2 expression in cells (A) compared with Teff cells, Treg cells have higher Fpr2 mRNA levels (tested by qPCR). (B) Compared with Teff cells, Treg cells have higher FPR2 levels (tested by flow cytometry). (C) Expression of ANXA1, FPR2 and FOXP3 in T effector cells and Treg cells. ⅰ) ANXA1 and FOXP3 in T effector cells; ⅲ) FPR2 and FOXP3 in T effector cells; ⅱ) ANXA1 and FOXP3 in Treg cells; (iv) FPR2 and FOXP3 in T effector cells. (D) In vitro suppressive assays were performed. When Teff:Treg=2:1, 4:1, 8:1 and 16:1, the proliferation rates of Teff cells were 11.9%, 22.9%, 65.7% and 70.3%, respectively, compared with 17%, 33.1%, 76.3% and 79.4% in the control group. (E) Negative control: the proliferation rate of Teff cells without stimulation. (F) Comparison of proliferation rates between activated Teff cells (Teff:Treg=1:0) with and without Ac2-26. All data represent mean±SD. (G) Percentage of proliferated Teff cells was assessed. All data represent mean±SD. *p<0.05, **p<0.01, ***p<0.001 as determined by Student’s t-test.
ANXA1 blocker impairs the function of Treg cells
Next, to investigate how ANXA1 signaling regulates the function of Treg cells, we collected human Treg cells with and without ANXA1 blocker Boc1 (the same dose of Ac2-26 (20 µM) was added to both groups) and performed RNA sequencing. The heat map is shown in figure 3A. When the downstream ANXA1/FPPR2 pathway is blocked, red indicates upregulated genes and blue indicates downregulated genes. The volcano plot is shown in figure 3B, with blue indicating downregulated genes and red indicating upregulated genes. We then performed GO and KECG enrichment analysis, and found that most of the affected genes are concentrated in the cytokine production signaling pathway (figure 3C,D). Next, we checked the differentially expressed genes list and found that GZMA (granzyme A), CD25 (IL2RA), CCR8 and PDCD1 were significantly downregulated, while TGF-β, IL-10, CTLA4, PRF1, NT5E and ENTPD1 were not significantly changed. Then we performed qPCR and found that the expressions of GZMA, GZMB, CCR8, PDCD1 and IL2RA were downregulated, while the expressions of TGFB1, IL-10, CTLA4, NT5E, PRF1 and ENTPD1 were not significantly changed. The data are consistent with RNA-sequencing results (figure 3E).
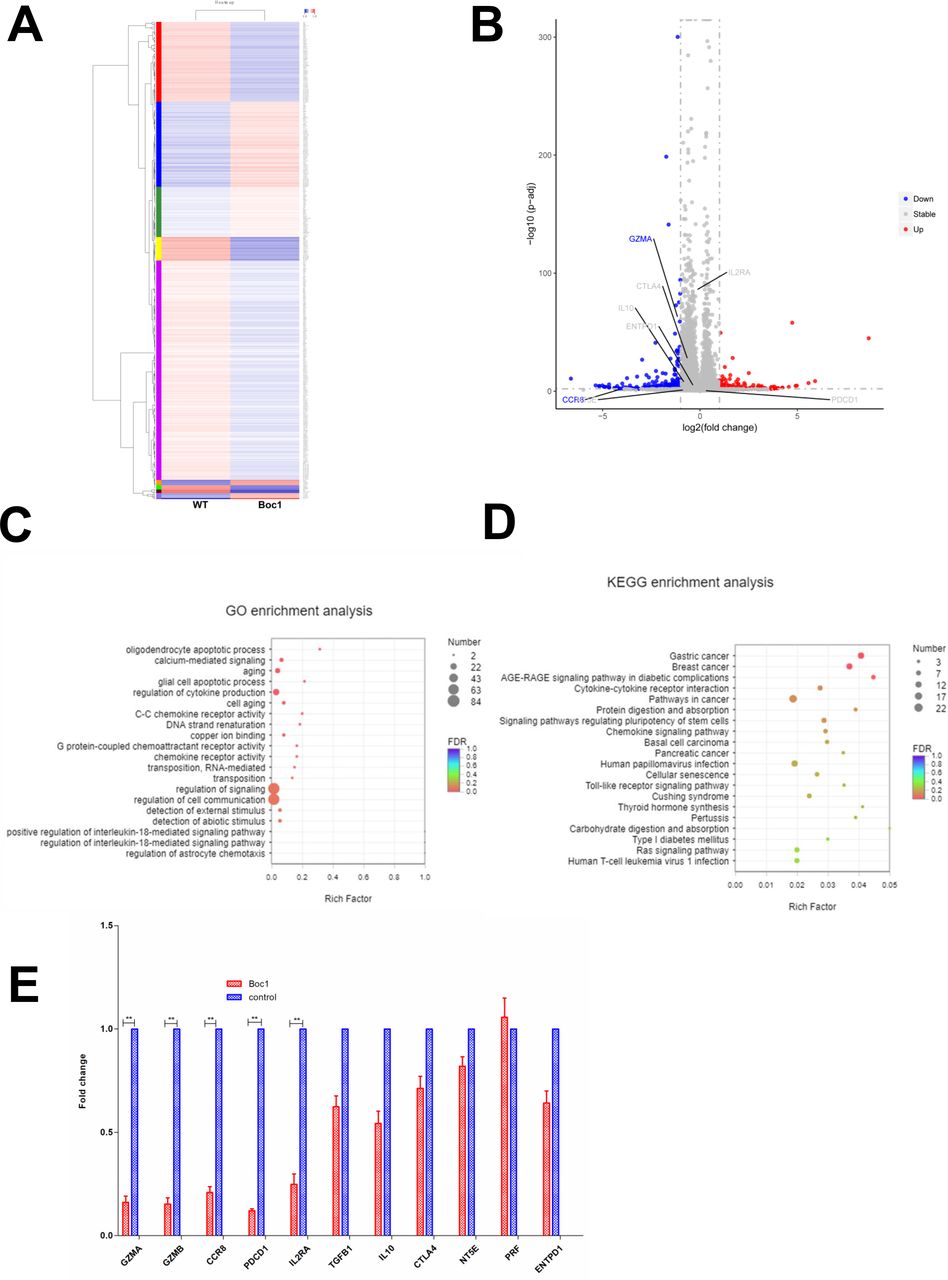
RNA-Seq data of downstream signaling after block ANXA1. (A) Heat map (wild type vs Boc1). (B) Volcano plot (wild type vs Boc1). (C) GO enrichment analysis. (D) KEGG enrichment analysis. (E) qPCR tests. All data represent mean±SD; all data represent mean±SD. *p<0.05, **p<0.01, ***p<0.001 as determined by Student’s t-test.
ANXA1 blocker can significantly reduce tumor size in in vivo mice model
Then we examined whether ANXA1 blocker can inhibit tumor growth in vivo or not. Through mouse tumor-bearing experiments, we found that Boc1 significantly reduced tumor size and weight compared with the control group (figure 4A–C). Furthermore, tumor metastasis was significantly reduced (figure 4D,E; tumor metastasis H&E data see supplementary Figure 2A, B; preliminary experiment data see supplementary figure 2C).
Supplemental material
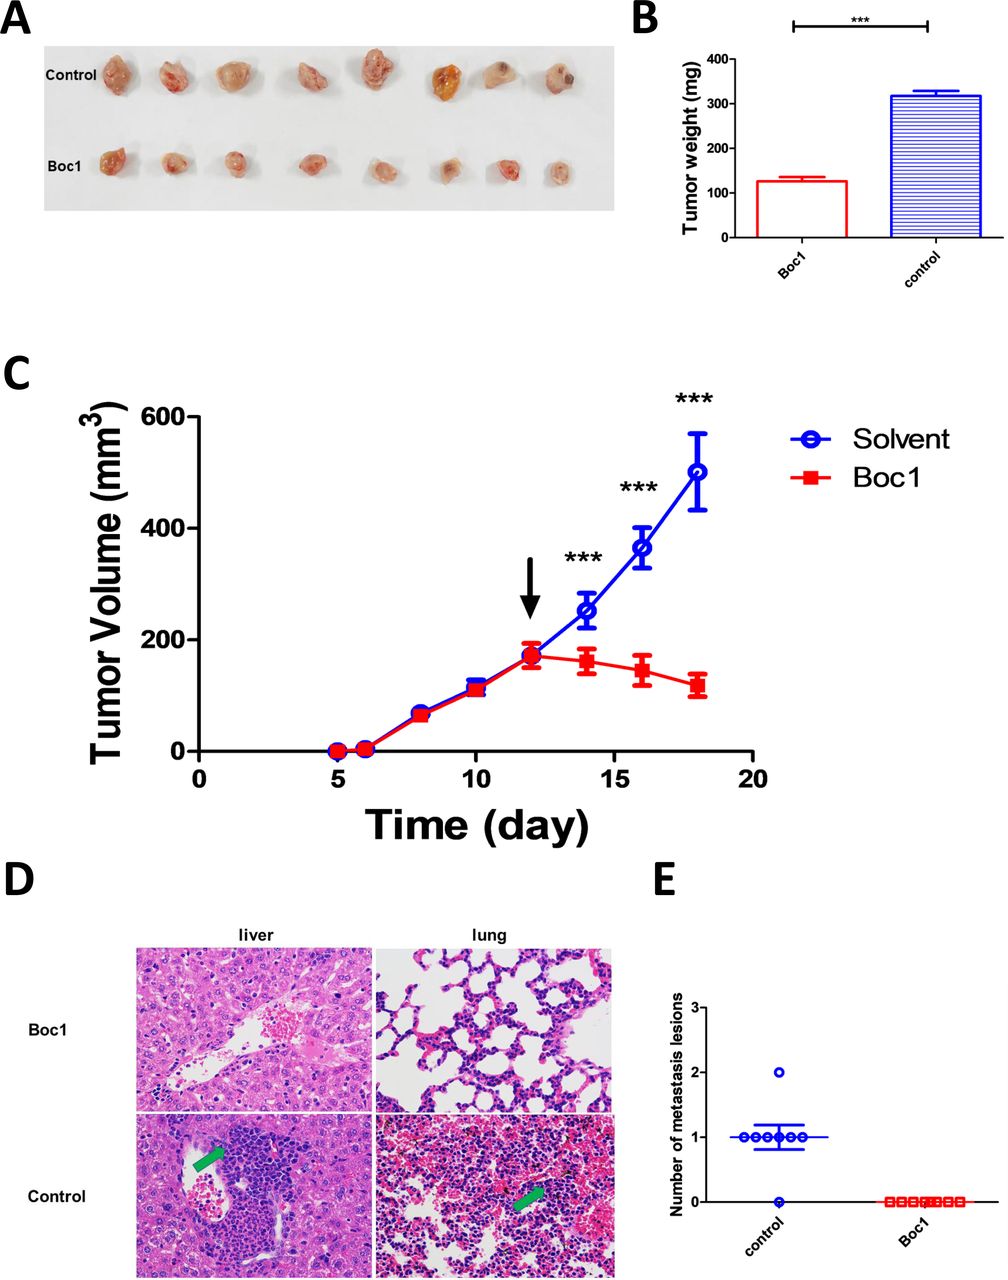
ANXA1 blocker inhibits breast tumor growth in vivo. (A) Images of resected tumors at the end point (n=8). (B) The excised tumors were weighed at the end point. The tumor weights of each group were compared using two-tailed unpaired t-tests. Data are presented as mean±SD (n=8). (C) The tumor growth curve; the arrow indicates the time starting drug administration. (D) Liver and lung lesions of both groups (×400); green arrows indicate metastasis lesions. (E) Number of metastasis lesions of both groups. *p<0.05, **p<0.01, ***p<0.001 as determined by Student’s t-test.
ANXA1 blocker does not directly kill tumor cells in vitro
Next, we studied whether Boc1 acted on tumor cells 4T1 or other cells, such as immune cells, to inhibit tumor growth. Annexin V-PE /7-AAD apoptosis kit was used to determine whether Boc1 could affect the apoptosis rate of 4T1 cells. The data showed that compared with the control group, Boc1 (20 µM, 50 µM and 100 µM) had no significant effect on the apoptosis rate of 4T1 cells (figure 5A–D). Next, transwell migration assays were used to determined whether Boc1 could affect the migration ability of 4T1 cells. As is shown in figure 5E,F, Boc1 did not significantly affect the migration ability of 4 T1 cells compared with the control group. Then, CCK-8 tests were used to determine whether Boc1 with different concentration gradients could affect the proliferation rate of 4T1 cells. The results showed that there was no significant difference between the two groups (figure 5G).
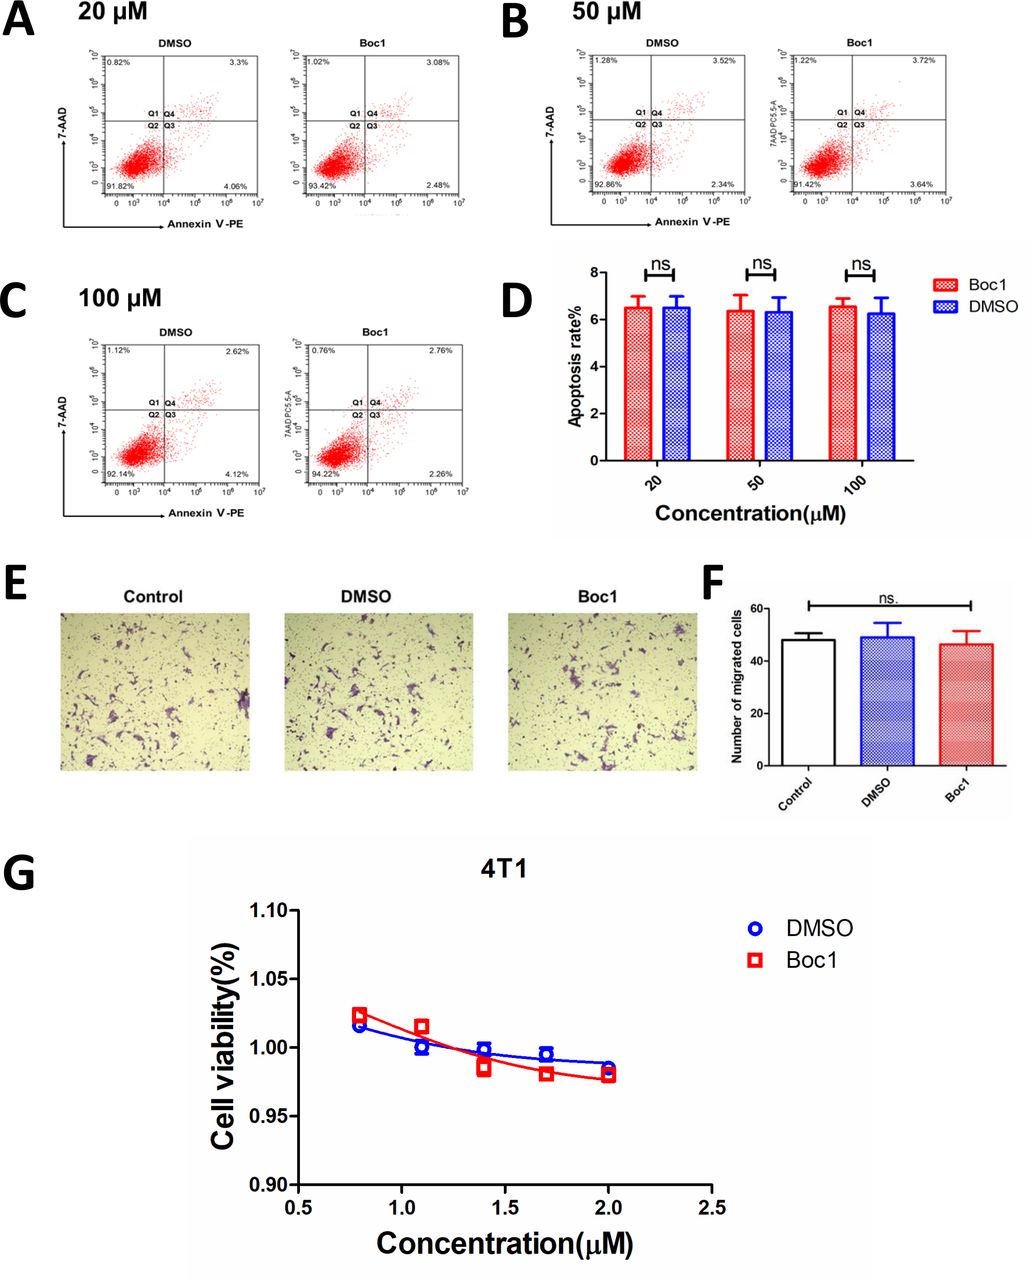
ANXA1 blocker has no effect on apoptosis rate of 4T1 cells. (A) Apoptosis rate of 4T1 treated with Boc1 (20 µM) in vitro. (B) Apoptosis rate of 4T1 treated with Boc1 (50 µM) in vitro. (C) Apoptosis rate of 4T1 treated with Boc1 (100 µM) in vitro. (D) Statistical analysis of apoptosis rates. Data are presented as mean±SD (n=3). (E) Transwell migration assays investigated the migration capacity of 4T1 cells treated with DMSO or Boc1 (50 μM) for 24 hours. (F) Statistical analysis of migrated cells. Data are presented as mean±SD (n=3). ns (no statistical significance) as determined by Student’s t-test. (G) The dose-dependent cytotoxicity induced by Boc1 on 4T1. Data are presented as mean±SD (n=3).
ANXA1 blocker can reduce the infiltration and functions of Treg cells in in vivo tumor model
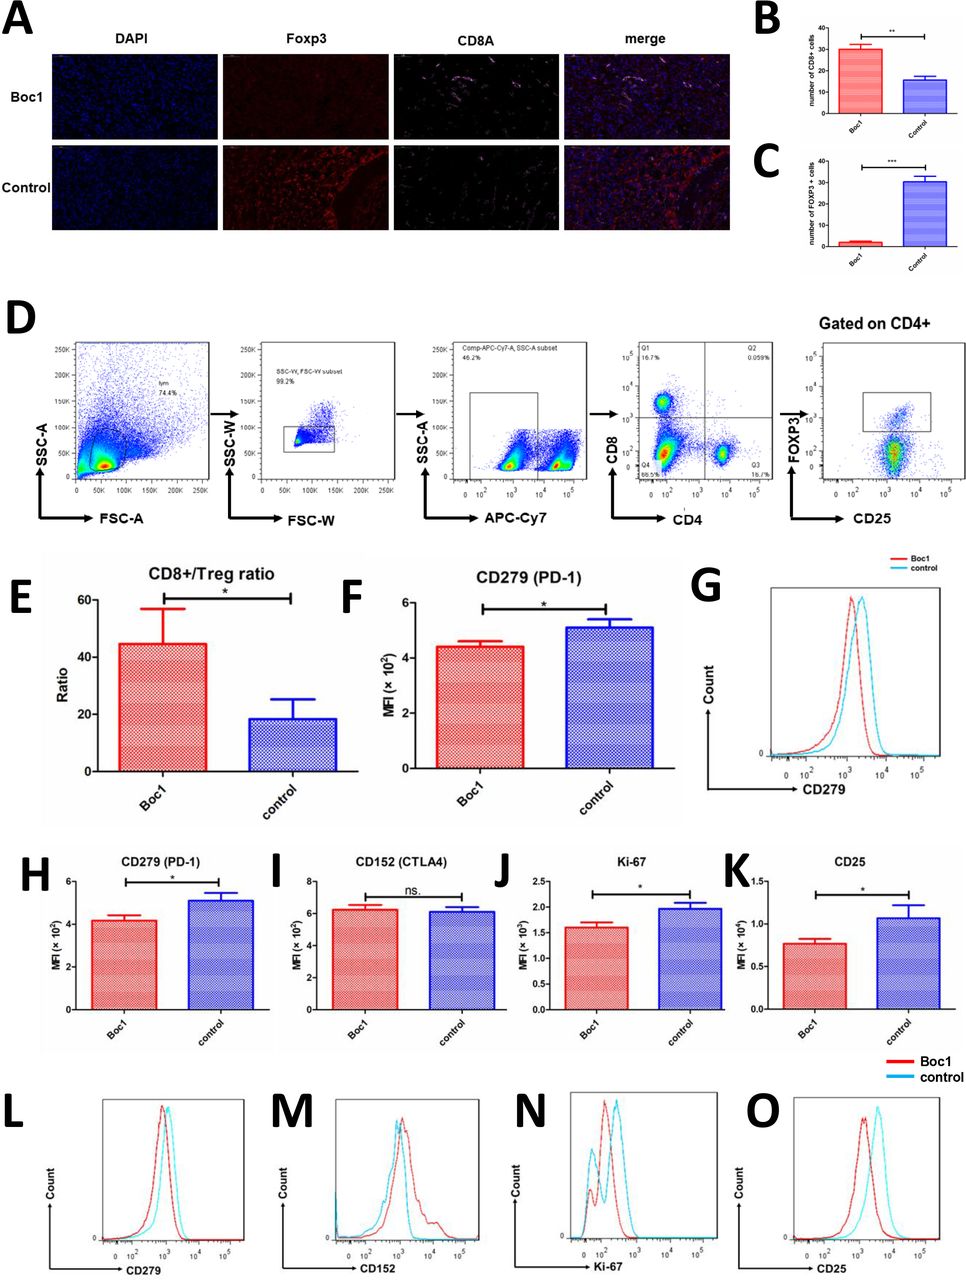
We then studied tumor immune cell infiltration to understand whether immune cells play an important role in tumor growth. The expression of CD8A and FOXP3 was detected by immunofluorescence in in vivo tumor model. The data show that Boc1 can increase CD8A expression and decrease FOXP3 expression in mouse tumors (figure 6A–C). Next, we examined CD8+ T-cell markers PD-1 (PDCD1) and Treg cell markers (CTLA4, Ki-67, CD25 and PDCD1). Data showed that PDCD1 decreased in CD8+ T cells, PDCD1, Ki-67 and CD25 decreased in Treg cells, and CTLA4 remained unchanged in Treg cells (figure 6F-O). In addition, the CD8:Treg ratio increased significantly (figure 6E).
ANXA1 blocker reduces the infiltration and functions of Treg cells in tumors. (A) Immunofluorescence of mice tumor (nuclear: DAPI, blue; FOXP3: SP-Orange, red; CD8a: Cy5, pink); (B, C) counted under high-power field (×400); each group included three tumors, and five high-power fields were calculated for each tumor; data are presented as mean±SD; (B) number of CD8+ T cells; (C) number of Foxp3+ cells; (D) the gating strategy of choosing CD8+ T cells and Treg cells; (E) the ratio of CD8+ T cells to Treg cells (CD4+CD25+FoxP3+) in the two groups was compared; data are presented as mean±SD (n=3); (F) CD279 expression of CD8+ T cells was measured by flow cytometry; data are presented as mean±SD (n=3); (G) MFI of CD279 was measured by flow cytometry; (H–K) flow cytometry tests of mice tumors; CD279, CD152, Ki-67 and CD25 expression of Treg cells (CD4+CD25+FoxP3+) were measured, respectively; data are presented as mean±SD (n=3); (L–O) MFI of CD279, CD152, Ki-67 and CD25 were measured, respectively. MFI, mean fluorescence intensity. *p<0.05, **p<0.01, ***p<0.001 as determined by Student’s t-test.
Discussion
Our study revealed that ANXA1 is highly expressed in TNBCs, which may promote Treg cell–mediated immune suppression. If we block ANXA1, we can weaken Treg cells, reducing tumor size. First, ANXA1 is highly expressed in malignant breast cancer, especially TNBC, and is associated with poor prognosis. By examining specimens, we found that TNBCs have a higher number of Treg cells. Therefore, it is of great importance to investigate the effects of ANXA1 on Treg cells. Next, our suppressive assays data have identified that ANXA1 enhance Treg cell functions. According to RNA-sequencing data, we discovered that after blocking ANXA1, granzyme A expression in Treg cells, which could suppress natural killer (NK) cells and cytotoxic T cells (CTLs),28 is significantly decreased. In addition, the expression of several important surface markers of Treg such as IL2RA (CD25), CCR8 and PDCD1 also have decreased. Furthermore, after blocking ANXA1, we could weaken the function of Treg cells to reduce tumor size in in vivo mice tumor model.
Treg cells are critical in suppressing inflammation and can play detrimental roles in promoting tumor progression.29 The ratio of FOXP3+ T cells to CD3 or CD8+ T cells is negatively correlated with multiple cancer survival.30–34 Treg cells regulate immune system by suppressing the function of conventional T (Tconv) cells including CD4+ and CD8+ T cells, as well as dendritic cells (DCs), B cells, macrophages, mast cells and other cells.29 35 36 Treg cells are reported to secrete inhibitory cytokines such as interleukin-10 (IL-10), IL-35 and TGFβ for their suppressive functions.35 37 The suppressive functions of Treg cells to NK cells and CTLs are dependent on the expression of granzyme and perforin.28 Treg cells express many co-stimulatory receptors such as ICOS, OX40, GITR and co-inhibitory receptors such as Lag-3, Klrg1, Tim-3, TIGIT, PD-1 that can interact with receptors on other cells resulting in cell-cycle arrest.29 36 In addition, Treg cells also express high CD25, namely, the IL-2 receptor alpha chain, which could compete with effector T cells for IL-2.36 The recruitment and retention of Treg cells to tumors is related to CCL2 and CCR4.38 In breast cancer samples, RNA-seq analyses show that tumor-infiltrating CD4+CD25+ Tregs have high expression of CCR8 compared with blood CD4+CD25+ Tregs.39 In conclusion, Treg cells are significant for anti-cancer immunity and investigations of potential target, such as ANXA1 as we found here to regulate their functions are important.
ANXA1 inhibits phospholipase A2 and has anti-inflammatory activity. In adaptive immune system, ANXA1 could enhance signaling cascades that are triggered by T-cell activation and regulate activated T-cell differentiation and proliferation.40 In innate immune system, ANXA1 could decrease neutrophil rolling and adhesion to endothelium, and inhibit neutrophil transmigration. In addition, ANXA1 also promotes monocyte recruitment and clearance of apoptotic neutrophils by macrophages. The evidence suggest ANXA1 as a promising tool for new therapeutic strategies to treat inflammatory diseases.41 Besides immune system, ANXA1 also plays an important role in cancers. TCGA data (https://www.cbioportal.org/) show that high ANXA1 expression is associated with poor survival in multiple cancer types, including cholangiocarcinoma, colorectal adenocarcinoma, bladder urothelial carcinoma, breast invasive carcinoma, brain lower grade glioma, cervical squamous cell carcinoma, head and neck squamous cell carcinoma, and so on. On cell levels, ANXA1 autocrine axis could enhance MDA-MB-231 breast cancer cell growth and aggressiveness.42
Our results suggest that ANXA1 is significant for Treg cells mediated anti-breast cancer immunity. First, increased plasma levels of ANXA1 in patients with breast cancer may provide clues to our diagnosis. Further research is needed to determine whether ANXA1 may be a potential diagnostic marker for breast cancer. Second, ANXA1/FPR2 could be a potential target of Treg cell functions. If we block ANXA1, Treg cell functions could be weakened, which could enhance anti-tumor immunity. However, how ANXA1 regulates Treg cell function remains to be further studied. Although we found that granzyme A secretion decreased after blocking ANXA1, how this affects the function of Treg cells and whether granzyme A affects CTLs or NK cells remains to be further studied.
Conclusions
In summary, Treg cells have a stronger inhibitory effect when ANXA1 level is increased in tumor microenvironment, which can promote the growth of breast tumors. If we block ANXA1, we may weaken the function of Treg cells and shrink breast tumors, which requires further investigation.
Acknowledgments
The authors thank members of our laboratory and our collaborators for our research work. And thank for the Bio-Research Innovation Center Suzhou for the kindly help.
References
Footnotes
FB, PZ and YF contributed equally.
Contributors Manuscript draft: FB, PZ, YF. RNA-Seq data analysis: QH. Patient specimen collection: HC, MZ. Subject and technical guidance: BL, DL. Project design: KW.
Funding Science and Technology Commission of Shanghai Municipality (no. 17411961100); National Key R&D Program of China 2019YFA09006100; National Natural Science Founding of China grants (81830051, 31525008, 31670911 and 31961133011); Shanghai Academic Research Leader 16XD140380, Shanghai Jiao Tong University (SJTU)–The Chinese University of Hong Kong (CUHK) Joint Research Collaboration Fund and the Fundamental Research Funds for Central Universities.
Conflict of Interes B.L. is a co-founder of Biotheus Inc and chairman of its scientific advisory board.
Patient consent for publication Obtained.
Ethics approval The collection of all the samples from patients of this study was approved by the Ethics Committees of Obstetrics and Gynecology Hospital of Fudan University and Renji Hospital, Shanghai Jiaotong University School of Medicine. All animal protocols are approved by the Ethics Committees of Obstetrics and Gynecology Hospital of Fudan University.
Provenance and peer review Not commissioned; externally peer reviewed.
Data availability statement Data are available in a public, open access repository. Data are available on reasonable request. All data relevant to the study are included in the article or uploaded as online supplementary information. The authors certify that they have participated sufficiently in the work to take public responsibility for the appropriateness of experimental design and method, and the collection, analysis and interpretation of the data. All the data and material are available when required.