Article Text

Abstract
Background Natural killer (NK) cells are one of the main effector populations of immunotherapy with monoclonal antibody and cytokines, used in combination with chemotherapy to treat children with high-risk neuroblastoma on this phase II trial. However, the impact of chemoimmunotherapy on NK cell kinetics, phenotype, and function is understudied.
Methods We prospectively examined NK cell properties from 63 children with newly diagnosed neuroblastoma enrolled in a phase II trial (NCT01857934) and correlated our findings with tumor volume reduction after 2 courses of chemoimmunotherapy. NK cell studies were conducted longitudinally during chemoimmunotherapy and autologous hematopoietic cell transplantation (autoHCT) with optional haploidentical NK cell infusion and additional immunotherapy.
Results Chemoimmunotherapy led to significant NK cytopenia, but complete NK cell recovery reliably occurred by day 21 of each therapy course as well as after autoHCT. Haploidentical NK cell infusion elevated the NK cell count transiently during autoHCT. NK cell cytotoxicity increased significantly during treatment compared with diagnosis. In addition, NK cells maintained their ability to respond to cytokine stimulation in culture longitudinally. Unsupervised cluster analysis of CD56bright NK cell count and tumor volume at diagnosis and after two courses of chemoimmunotherapy identified two patient groups with distinct primary tumor sizes and therapy responses.
Conclusion After profound NK cytopenia due to chemoimmunotherapy, endogenously reconstituted NK cells exhibit enhanced NK cytotoxicity compared with pretherapy measurements. Our data suggest a relationship between CD56bright expression and tumor size before and after two courses of chemoimmunotherapy; however, future studies are necessary to confirm this relationship and its predictive significance.
Trial registration number NCT01857934.
- oncology
- paediatric
- immunology
This is an open access article distributed in accordance with the Creative Commons Attribution Non Commercial (CC BY-NC 4.0) license, which permits others to distribute, remix, adapt, build upon this work non-commercially, and license their derivative works on different terms, provided the original work is properly cited, appropriate credit is given, any changes made indicated, and the use is non-commercial. See http://creativecommons.org/licenses/by-nc/4.0/.
Statistics from Altmetric.com
Background
Immunotherapy with an antidisialoganglioside (GD2) antibody, interleukin-2 (IL-2) and granulocyte-macrophage colony-stimulating factor (GM-CSF), combined with cis-retinoic acid, is the standard of care for the treatment of children with high-risk neuroblastoma in a state of minimal residual disease (MRD).1 These patients attain MRD (ie, at least a partial response (PR) to multimodal therapy) by completing induction chemotherapy, local control with surgery and radiation therapy, and myeloablative chemotherapy, followed by hematopoietic progenitor cell rescue (autologous hematopoietic cell transplantation (autoHCT)).1 Recently, we used immunotherapy (monoclonal anti-GD2 antibody with GM-CSF and IL-2) combined with chemotherapy (chemoimmunotherapy) as an upfront regimen, yielding early response rates that exceed those achieved by chemotherapy alone.2
Antibody-dependent cell-mediated cytotoxicity against neuroblastoma relies on natural killer (NK) cells as one of the major effector cell populations.3 4 IL-2 that is administered as part of immunotherapy activates NK cells and enhances their function.5 However, the impact of chemoimmunotherapy on NK cell phenotype and function is not well understood. Here, we aimed to better understand the quantitative and qualitative differences in NK cells in children with newly diagnosed neuroblastoma who underwent chemoimmunotherapy and autoHCT with optional adoptive NK cell therapy and immunotherapy as part of a phase II clinical trial. We obtained longitudinal peripheral blood samples from these patients, performed NK cell immune profiling, and examined the relationship of these markers with clinical tumor response and NK cytotoxicity.
Materials and methods
Patients and treatment
Children with newly diagnosed, high-risk neuroblastoma were enrolled in our institutional phase II trial (NCT01857934); the clinical outcomes from this study have been reported separately.2 Informed consent was obtained from parents or guardians, and assent from the patients, as appropriate.
Induction chemotherapy was identical to that described in the ANBL0532 trial6 (figure 1A). Each of the six courses was combined with intravenous anti-GD2 antibody hu14.18K322A (40 mg/m2; days 2–5), subcutaneous IL-2 (1×10⁶ units/m2; days 6, 8, 10, 12, 14 and 16), and daily subcutaneous GM-CSF (250 µg/m2; day 7 until neutrophil count ≥2000 mm3) (figure 1A).
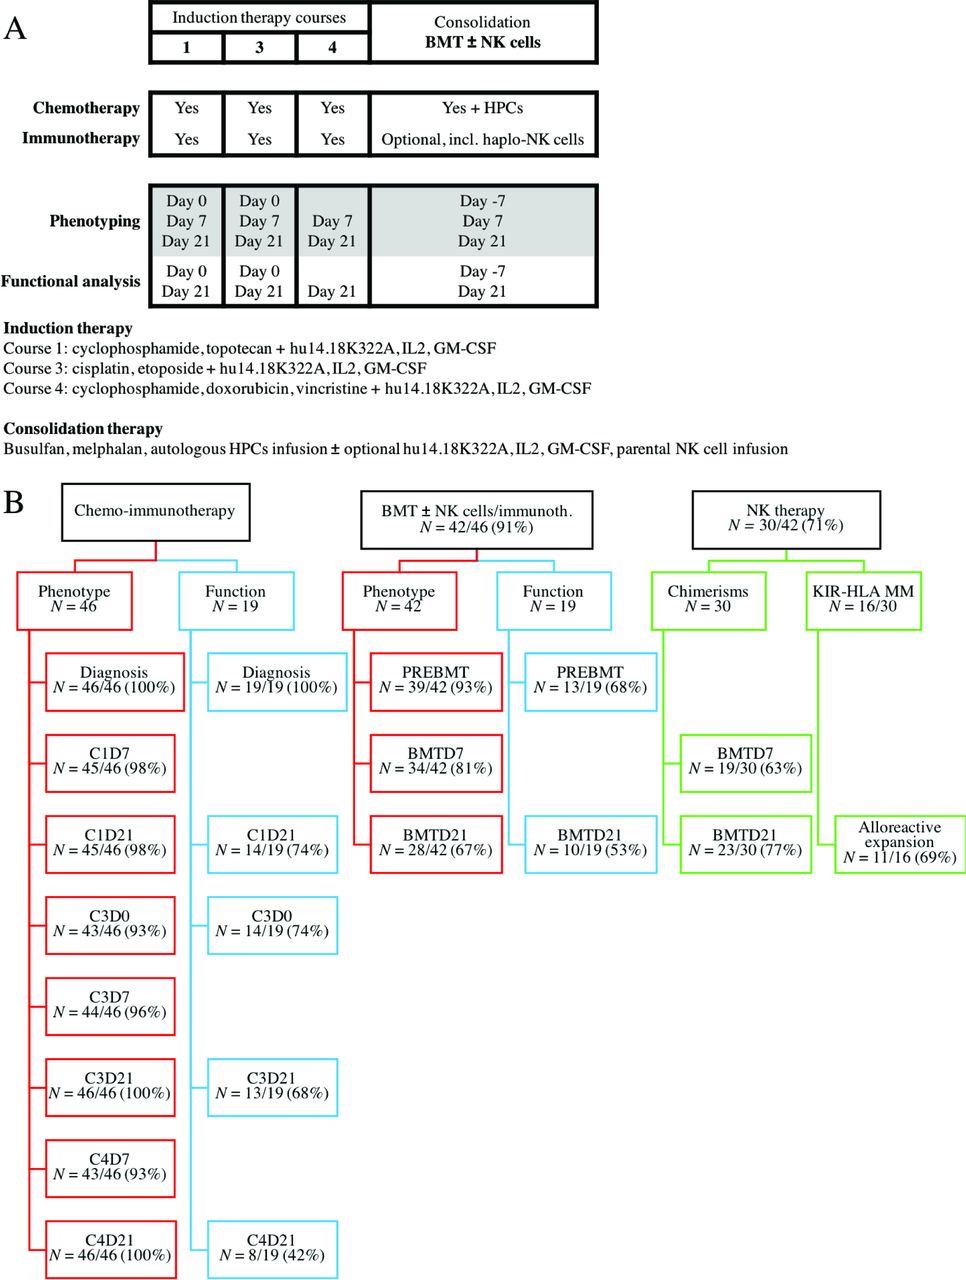
(A) Therapy regimen and time points of longitudinal NK cell studies. Patients received six induction courses but NK cell studies were only conducted during course 1, 3 and 4. (B) Flow diagram of patients included in the study and individual tests. Patients with missing data for specific time points were excluded resulting in deviation from the original number of patients. BMT, bone marrow transplantation; GM-CSF, granulocyte-macrophage colony-stimulating factor; HLA, human leukocyte antigen; HPCs, hematopoietic progenitor cells; IL-2, interleukin-2; KIR, killer immunoglobulin-like receptor; NK, natural killer.
The consolidation regimen is reported elsewhere.7 During consolidation, consenting patients also received an additional 4 days of hu14.18K322A (40 mg/m2/day) with haploidentical CD56+ CD3- NK cells, when available. Parentally derived NK cells were purified with the CliniMACS system (Miltenyi Biotec) by removing CD3+ cells, then enriching for CD56+ cells.8 Unmanipulated NK cells were infused any time between day 2 and 5 after autoHCT with subcutaneous IL-2 (1×10⁶ units/m2 every other day x 4) and daily intravenous GM-CSF 250 µg/m2, beginning on day 10 after NK cell infusion until neutrophil count ≥ 2000 mm3.
The tumor volume was calculated as Tvol=(anterior–posterior dimension×transverse dimension × length) × 0.52.9 Patients were stratified according to the International Neuroblastoma Response Criteria10 into responders (ie, complete (CR), very good partial (VGPR) and PR) and those with stable disease (SD) after two induction therapy courses. There were no patients with progressive disease.
Sample processing
At each study time point, 5–8 mL of peripheral blood were collected in acid citrate dextrose containing tubes and processed within 24 hours. Buffy coat was isolated by centrifugation, red blood cell lysis was performed’, and white blood cells were analyzed by flow cytometry.
NK cell studies
Phenotyping
Flow cytometry was performed on a Becton Dickinson (BD) LSRFortessaTM (Franklin Lakes, NJ, USA) equipped with five lasers. The machine was calibrated daily, rainbow calibration particles (Spherotech) were used to adjust and match the voltages between experiments, and a frozen stock of peripheral blood mononuclear cells were used as reagent control with each experiment. Irrespective of blood count recovery, phenotyping was performed on days 0, 7 and 21 of induction courses 1 (cyclophosphamide, topotecan), 3 (cisplatin, etoposide) and 4 (cyclophosphamide, doxorubicin, vincristine) (figure 1A), 7 days before (denoted as PREBMT; ie, prior to myeloablative conditioning) and 21 days after autologous hematopoietic cell infusion. As CD56 is also a strongly positive marker in neuroblastoma, we excluded tumor cells by gating on CD45+ populations, of which NK cells were defined as CD56+ CD3- cell population. CD158a was detected by antibody clone 143211, CD158b by CH-L (R&D systems), CD158e1 by DX9 (BD Biosciences), NKG2A by Z199, NKp30 by Z25, NKp44 by Z231, NKp46 by BAB281 (Beckman Coulter) and NKG2D by 1D11 (BD Biosciences).
Cytotoxicity studies
In a subset of patients, we isolated peripheral blood NK cells via magnetic negative selection on days 0 and 21 of induction course 1, 3, 4 and 7 days before and 21 days after autoHCT (figure 1A). NK cells were grown in culture overnight in Roswell Park Memorial Institute 1640 medium (Lonza), supplemented with 10% heat-inactivated fetal bovine serum (Biowest), 100 IU/mL penicillin, 100 µg/mL streptomycin, 2 mM L-glutamine (Gibco media) and IL-2 (50 IU/mL) or IL-15 (10 ng/mL) when indicated (Biological Resource Branch at the National Cancer Institute). Their cytotoxicity was assessed in cocultured with yellow fluorescent protein-expressing K562 cells for 4 hours. Because of the limited blood sample volume, we were unable to perform effector-to-target (E:T) ratio titrations. Instead, an E:T ratio of 5:1 was chosen for all experiments because we have demonstrated that this ratio best distinguishes the differences in NK cytotoxicity among donors and NK cell activation status.4 After 4 hours, tumor cells were quantified by flow cytometry.
Chimerism studies
Chimerism studies were conducted after adoptive NK cell transfer (n=31) to determine persistence of haploidentical donor NK cells. Sorted NK cells were subjected to standard variable number tandem repeat techniques on days 7 and 21 after haploidentical NK cell infusion.11
KIR-HLA genotyping
HLA and KIR genotyping were performed for each patient and NK cell donor. A KIR–HLA mismatch was defined by the lack of the cognate HLA class I molecule in patients that corresponded with the respective KIR identified in the NK cell donor.12 13 Alloreactive NK cells were defined as the subpopulation of NK cells that expressed the HLA-mismatched KIR by flow cytometry analysis but lacked NKG2A and KIRs corresponding with patient expressed HLAs. A rise in alloreactive NK cell counts after day 7 posthaploidentical NK cell infusion was deemed an alloreactive NK cell expansion.
Statistical methods
Patient characteristics were summarized by descriptive statistics (count and percent, mean and SD or median and range). The distribution of cell counts over time was illustrated by descriptive statistics and box-and-whisker plots based on a transformation; however, statistical testing was performed on untransformed data. When using a transformation, non-zero data were transformed with a log10 transformation and zero data were transformed with a log10 10 replacement. A series of Friedman tests were used to examine overall differences in NK cell counts between study time points with complete data. The overall test was followed by pairwise comparisons between study time points using Wilcoxon signed rank tests and were adjusted using the false discovery rate. The Fisher’s exact test was used to assess the relationship between donor to patient mismatch against CD158e1 (yes/no) and survival status (alive/deceased). Wilcoxon rank sum tests adjusted using the false discovery rate were used to compare the percentage of receptor cells by early clinical tumor response after two courses of chemotherapy (SD vs CR, VGPR, or PR). Unsupervised clustering using k-means clustering with average silhouette direct optimization for determining the optimal number of clusters was performed on CD56bright NK cell count and clinical responses.14 A visualization of the k-means partitioning method was performed using the R package factoextra where observations are represented by points using principal components and an ellipse is drawn around each cluster.15 Generalized estimating equation models were used for modeling continuous outcomes with repeated patient information. The robustness of these marginal models were further evaluated using Bayesian generalized linear regression using normal prior distribution for the coefficients. Forest plots were used to visualize the results of regression analysis by displaying the point estimate and 95% CI or uncertainty interval for the coefficients estimated by modeling. Statistical analyses were conducted with R V.3.6.1 and SAS V.9.4 (SAS Institute). A two-sided significance level of p<0.05 was used for all statistical tests.
Results
Patient characteristics and therapy
Altogether, 63 children (37 (59%) males) with a median age of 3.3 years (0.5–15.2 years) were evaluable (table 1). Fifty-seven (91%) underwent autoHCT, and 31 of 43 (72%) whom were given the choice to receive experimental haploidentical NK cell infusion during autoHCT consented to this option. Detailed clinical information for these patients are summarized in online supplementary tables 1 and 2.
Supplemental material
Clinical characteristics of studied patient cohort
NK cell reconstitution during induction
The number of patients included for each test is shown in figure 1B. The distribution of CD16+ NK cells (figure 2A) and NK cell counts (figure 2B) over the course of therapy showed profound NK cell deficiency on day 7 of each induction course 1 (C1D7), 3 (C3D7) and 4 (C4D7) compared with pretreatment levels (all p<0.001). The decline during course 3, when patients received cisplatin and etoposide, was less severe compared with the other two courses (all p<0.0001). By day 21 of each induction course 1, 3 and 4, the median NK cell counts reliably and fully reconstituted to equivalent (course 1 and 4) or higher levels than that at baseline (course 3; p=0.011).

Box plot of CD16+ (A) and total NK cells per μL (B) (transformed scale as detailed in statistical methods) by time point. (C) Individual alloreactive NK cell counts on days 7 and 21 after adoptive transfer of haploidentical and HLA-KIR-mismatched NK cells. Complete (CR), very good partial (VGPR), partial response (PR) (n = 8) are shown as solid lines and those with stable disease (SD) (n=4) as a dashed line. NK, natural killer.
NK cell reconstitution during consolidation
Thirty-one patients received adoptive transfer of haploidentical NK cells (median cell dose, 20.7; range, 3–114). NK cell count was higher on day 7 (median 7.9 (0.0–38.6) cells/µL vs median 2.8 (0.0–23.8) cells/µL P=0.005) and lower on day 21 (median 141.6 (24.5–561.0) cells/µL vs median 170.2 (124.1–408.6) cells/µL, p=0.106) in patients who received a haploidentical NK cell infusion compared with those who did not. Median donor NK cell chimerisms were 6% (range, 0%–81%) on day 7% and 0% (range, 0%–35%) on day 21. Thirteen of 31 (42%) patients received more than 25× 106/kg NK cells and had donor NK cells detectable 7–21 days after infusion. All six patients with undetectable donor NK cells at all time points after NK cell infusion received lower NK cell doses (online supplementary table 1, online supplementary figure 1).
Among the 31 patients who received haploidentical NK cell therapy, 17 were infused with alloreactive NK cells, but only 12 of these patients had evaluable alloreactive NK cell counts at both day 7 and day 21 post-transplant. All twelve patients had a rise and therefore an expansion in total alloreactive NK cell counts from day 7 to day 21 post-transplant (median (range): 18.97 [0.03–106.23]; (figure 2C). When stratifying by tumor response after two courses of therapy, it was observed that patients with SD (n=4) had greater expansion in alloreactive NK cells compared with patients with less residual disease (n=8; ie, in CR, VGPR or PR) after induction therapy (median 56.4 (11.8–106.2) cells/µL vs 8.43 (0.0–74.7) cells/µL; figure 2). Five of 23 patients (21.7%) without CD158e1 (KIR3DL1)-mismatch and none of the eight patients (0.0%) with KIR3DL1-mismatch died (p=0.291).
Longitudinal NK cell function during therapy
Cytotoxic capacity of resting NK cells increased in comparison to baseline measures during the first three courses of chemoimmunotherapy before declining to baseline levels (figure 3A). The most significant effect was seen on day +21 after autoHCT. The robustness of these findings was confirmed when we applied a Bayesian generalized linear regression model (online supplementary figure 2). Longitudinal ex vivo cytokine stimulation of NK cells from patients demonstrated that these cells had consistently higher cytotoxicity than resting NK cells, indicating that they maintain their potential to respond to stimulation and enhance their cytotoxic capacity ex vivo. The descriptive analysis is shown in figure 3B. Regression analysis of fixed covariates reached statistical significance for type of activation (p<0.001) and time point (p<0.001).

(A) Forest plot of NK cytotoxicity by time point. The forest plot summarizes the results of a generalized estimating equation model of time and condition adjusting for the repeated effect of patient on ex vivo kill. The reference group for time is diagnosis. The reference group for medium is resting. Estimates and 95% CIs are presented as points and lines, respectively. (B) Box plot of specific lysis by activation status and time point. (C) Unbiased and unsupervised cluster analysis identified two distinct patient clusters. (D) Demographic, tumor-related, and hematological features are listed and compared between the two patient clusters. CR, complete response; IL-2, interleukin-2; NK, natural killer; PR, partial response; SD, stable disease; VGPR, very good partial response.
NK phenotype and early clinical tumor response
All studied NK cell receptors shared similar longitudinal expression patterns during chemoimmunotherapy (online supplementary figure 3). Because we observed large variability in the CD56bright NK cell count and the change in pretreatment and postcourse 2 tumor volume (online supplementary figure 4), we chose these parameters to perform an unsupervised clustering analysis. The final cluster algorithm considered only tumor volume at diagnosis, tumor volume at course 2, and CD56bright percentage. We identified two non-overlapping patient clusters (figure 3C), among which we assessed the distributions of several demographic variables as well as tumor-related and therapy-related features. These two clusters differed in primary tumor size at diagnosis (p<0.001) and after two therapy courses (p<0.001), and tumor volume change (p=0.001; figure 3D).
Discussion
In this phase II trial, children with high-risk neuroblastoma received immunotherapy throughout multimodal treatment, and NK cell kinetics, phenotype, and function were evaluated longitudinally. Chemoimmunotherapy led to profound NK cytopenia, as expected. However, all children demonstrated sufficient and reliable endogenous reconstitution at the end of each induction course with enhanced NK cytotoxicity compared with that of baseline measurements (ie, prior to therapy). In addition, these cells maintained their capability to mount an activation response following cytokine stimulation ex vivo, altogether suggesting that NK cell function is enhanced either due to replacement of old by new NK cells and/or due to the administration of IL-2 or IL-15. To differentiate whether enhanced NK cytotoxicity is a result of NK cell reconstitution or immunotherapy, we suggest comparing the presented data to NK cell function in children receiving standard chemotherapy without immunotherapy.
When we examined the relationship between CD56bright NK cell count and degree of tumor response, we found two patient subgroups that are segregated by their primary tumor burden at diagnosis and after two courses of chemoimmunotherapy, tumor regression to chemoimmunotherapy, and therapy response. This finding suggests intrinsic differences in the NK cell repertoire and a relationship between tumor and NK cell features in this cohort that warrants further investigation. Our results also suggest that correlative biology studies in future clinical trials should incorporate broad unbiased phenotypic analyses as performed by mass cytometry, functional testing, and molecular analyses of NK cells. When correlated with clinical tumor response, these biological data may help stratify patients by their differential response to chemo-immunotherapy, resulting in individualized treatment approaches for high-risk neuroblastoma.
After autoHCT, haploidentical NK cell infusion can transiently correct the profound NK cytopenia; however, they were subject to rapid clearance as previously described in other studies.16 Haploidentical NK cells in the present study were purified and directly infused. It is possible that activation in culture17 18 may increase their survival in the recipient as suggested by in vivo studies.19 In addition, ex vivo NK cell expansion may allow the infusion of higher cell doses and could be beneficial given that all patients who received more than 25×106/kg NK cells had transient engraftment. Whether more prolonged engraftment would result in improved outcome is not known. We noted that qualitative features of donor NK cells, namely the presence of CD158e1 (KIR3DL1)-mismatch, could potentially be associated with better outcomes in some children as previously described20 and support further studies to determine favorable donor criteria.
Altogether, our findings suggest a relationship between NK cells and clinical responses to chemoimmunotherapy in neuroblastoma and encourage future investigations to improve our understanding of NK cell receptor biology and function in this context.
Acknowledgments
We thank Nisha Badders for editing the manuscript.
References
Footnotes
Contributors RN: design and conceptualization; data acquisition, analysis, interpretation; draft of the manuscript. NS and AS: statistical analysis and interpretation of data; review of the manuscript. MBM: volumetric tumor measurements; review of the manuscript. SMF: review of the manuscript. AS, DC, BR and WEJ: data acquisition; review of the manuscript. AT: review of the manuscript. BMT: design and conceptualization; review of the manuscript. GA: data acquisition; review of the manuscript. MAD: review of the manuscript; financial support of studies; ASP: design and conceptualization; review of the manuscript; financial support of studies. WHL: design and conceptualization; data interpretation; review of the manuscript. WLF: design and conceptualization; data interpretation; financial support of studies; supervision; review of the manuscript.
Funding This work was supported by the National Institutes of Health grant P30 CA021765 and the American Lebanese Syrian Associated Charities (all authors), Press On Fund (all authors), ASCO Conquer Cancer Young Investigator Award (RN), Howard Hughes Medical Institute (MAD).
Competing interests The authors declare that the research was conducted in the absence of any commercial or financial relationships that could be construed as a potential conflict of interest.
Patient consent for publication Not required.
Ethics approval The study was approved by our institutional review board.
Provenance and peer review Not commissioned; externally peer reviewed.
Data availability statement Data are available on reasonable request. Data are available on request from the corresponding author.