Article Text

Abstract
Background A significant challenge to overcome in pancreatic ductal adenocarcinoma (PDAC) is the profound systemic immunosuppression that renders this disease non-responsive to immunotherapy. Our supporting data provide evidence that CD200, a regulator of myeloid cell activity, is expressed in the PDAC microenvironment. Additionally, myeloid-derived suppressor cells (MDSC) isolated from patients with PDAC express elevated levels of the CD200 receptor (CD200R). Thus, we hypothesize that CD200 expression in the PDAC microenvironment limits responses to immunotherapy by promoting expansion and activity of MDSC.
Methods Immunofluorescent staining was used to determine expression of CD200 in murine and human PDAC tissue. Flow cytometry was utilized to test for CD200R expression by immune populations in patient blood samples. In vivo antibody blocking of CD200 was conducted in subcutaneous MT-5 tumor-bearing mice and in a genetically engineered PDAC model (KPC-Brca2 mice). Peripheral blood mononuclear cells (PBMC) from patients with PDAC were analyzed by single-cell RNA sequencing. MDSC expansion assays were completed using healthy donor PBMC stimulated with IL-6/GM-CSF in the presence of recombinant CD200 protein.
Results We found expression of CD200 by human pancreatic cell lines (BxPC3, MiaPaca2, and PANC-1) as well as on primary epithelial pancreatic tumor cells and smooth muscle actin+ stromal cells. CD200R expression was found to be elevated on CD11b+CD33+HLA-DRlo/− MDSC immune populations from patients with PDAC (p=0.0106). Higher expression levels of CD200R were observed in CD15+ MDSC compared with CD14+ MDSC (p<0.001). In vivo studies demonstrated that CD200 antibody blockade limited tumor progression in MT-5 subcutaneous tumor-bearing and in KPC-Brca2 mice (p<0.05). The percentage of intratumoral MDSC was significantly reduced in anti-CD200 treated mice compared with controls. Additionally, in vivo blockade of CD200 can also significantly enhance the efficacy of PD-1 checkpoint antibodies compared with single antibody therapies (p<0.05). Single-cell RNA sequencing of PBMC from patients revealed that CD200R+ MDSC expressed genes involved in cytokine signaling and MDSC expansion. Further, in vitro cytokine-driven expansion and the suppressive activity of human MDSC was enhanced when cocultured with recombinant CD200 protein.
Conclusions These results indicate that CD200 expression in the PDAC microenvironment may regulate MDSC expansion and that targeting CD200 may enhance activity of checkpoint immunotherapy.
- gastroenterology
- immunology
- tumors
- tumor microenvironment
- myeloid-derived suppressor cells
This is an open access article distributed in accordance with the Creative Commons Attribution Non Commercial (CC BY-NC 4.0) license, which permits others to distribute, remix, adapt, build upon this work non-commercially, and license their derivative works on different terms, provided the original work is properly cited, appropriate credit is given, any changes made indicated, and the use is non-commercial. See http://creativecommons.org/licenses/by-nc/4.0/.
Statistics from Altmetric.com
Introduction
Pancreatic cancer is currently the third leading cause of cancer death and due to a lack of early clinical signs, over 55% of patients present with advanced metastatic disease by the time of diagnosis.1–4 The prognosis for patients with metastatic disease remains poor, with a 5-year survival rate of only 3% and median survival time of 3–6 months.1 5 Published models predict that pancreatic ductal adenocarcinoma (PDAC) will surpass colon cancer, becoming the second leading cause of cancer-related deaths by the year 2030.6 One of the major difficulties with PDAC is its clinical silence. Typically, the disease only becomes apparent after the tumor invades surrounding tissues or metastasizes to distant organs.7 For many years, the current standard of care for most advanced PDAC patients has been gemcitabine-based regimens. However, slight improvements in overall survival are emerging with combination treatment using gemcitabine and nab-paclitaxel (Abraxane)8, or more aggressive chemotherapy regimens (eg, FOLFIRNOX) as a strategy to reduce systemic burden, debulk the tumor and improve candidacy for surgery. Regardless, these advances may only extend overall survival by a few months justifying further research to identify novel strategies with potential for long-term clinical responses and cures for this devastating malignancy. New and exciting immune-based cancer therapy has shown promising results in many cancers (melanoma and lung); however, little efficacy has been observed in the clinic for pancreatic cancer patients.9 As such, discovering novel immune-based targets and combination strategies in this disease are essential for advancing treatment in the clinic and improving survival rates for these patients.
A significant challenge to overcome in PDAC is the profound systemic immunosuppression that typically renders this disease non-responsive to immunotherapy.10 Proinflammatory cytokines and growth factors are a large hurdle for mounting antitumor immune responses in PDAC. Immunosuppressive cytokines, like IL-6 and IL-10, are highly elevated in patients with PDAC and correlate with poor overall survival.11 Our group and others have reported that these inflammatory cytokines are produced by the surrounding tumor stroma and these factors can promote the expansion of suppressive immune populations such as myeloid-derived suppressor cells (MDSC).12 MDSC are immature myeloid cells that are highly elevated in numerous different tumors and can suppress antitumor immune responses through the secretion of indoleamine 2,3-dioxygenase, arginase-I, inducible nitric oxide synthase, reactive oxygen species (ROS), and several suppressive cytokines (IL-10, IL-13, and TGF-β).13–15 These suppressive factors secreted by MDSC can inhibit antitumor T lymphocyte and Natural Killer (NK) cell responses and promote further expansion of immunosuppressive cell populations such as T-regulatory cells (T-regs), inhibitory dendritic cells (DC), and tumor-associated macrophages (TAMs). Several groups have reported that elevated MDSC in pancreatic cancer patients correlates with a poor overall survival compared with patients with low levels of MDSC.16 17 TAMs and DC can also fuel immunosuppression in the PDAC microenvironment and abrogate efficient antitumor immunity.18 Although pancreatic cancer patients are highly immunosuppressed, PDAC is typically not an “inflamed” microenvironment in that it has few tumor infiltrating T lymphocytes compared with other cancers where efficacious immunotherapy trials have been observed.19 20 Our recently published work demonstrated that targeted blockade of IL-6 combined with checkpoint blockade could enhance the number of tumor infiltrating T lymphocytes.21 Therapeutic options that can potentially promote migration of antitumor immune cells or reduce immunosuppressive cells from the pancreatic tumor microenvironment (TME) could lead to enhanced efficacy of immune-based therapies.
CD200 (OX-2; OX-90) is a cell surface glycoprotein and a poorly understood emerging checkpoint ligand previously found to be expressed by melanoma, brain tumors, and sarcomas. CD200 binds to its receptor, CD200R, which is primarily expressed by myeloid cells (MDSC, macrophages, and DC) and on a small subpopulation of T cells.22 23 Binding of the receptor has been shown to promote myeloid cell expansion and limit antitumor immunity (eg, ovarian and brain tumors).24–27 However, in another study in melanoma tumor-bearing mice, CD200 binding to CD200R on myeloid cells inhibited their activity providing a host benefit.28 These data suggest that the role of CD200 may vary depending on the tumor and potentially the inflammatory microenvironment. The role of CD200 signaling in myeloid populations, including MDSC, in PDAC patients has not been well characterized. It is well established that MDSC are significantly elevated in pancreatic cancer patients and are one of the many obstacles that hinder immunotherapy responses for these patients. Thus, targeting CD200 signaling may be a method for reducing MDSC and immunosuppression in patients with PDAC.
This study tested the hypothesis that CD200 expression in the PDAC microenvironment limits responses to immunotherapy by promoting expansion and activity of MDSC. Herein we show that CD200 expression was elevated in both the epithelial and stromal compartments of the pancreatic TME, and that CD200R expression is significantly increased on MDSC in patients with PDAC. Our preclinical studies indicate that antibody blockade of CD200 limits PDAC tumor growth and reduces intratumoral MDSC. Further, antibody blockade of CD200 significantly improves the antitumor response of PD-1 checkpoint immunotherapy. Single-cell RNA sequencing suggests elevated expression of genes involved in cytokine signaling and MDSC expansion in CD200R+ peripheral blood mononuclear cell (PBMC) of patients with PDAC. In vitro studies provide evidence that CD200 promotes cytokine-driven expansion and downstream signaling pathways in MDSC. Additionally, CD200 stimulation of MDSC increased their suppressive activity against autologous T-cell proliferation. These results indicate that CD200 expression in the PDAC microenvironment may regulate MDSC expansion and that targeting CD200 can enhance activity of checkpoint immunotherapy.
Methods
Cells lines and reagents
Pancreatic cell lines MiaPaca2, BxPC-3, and PANC-1 were cultured in DMEM (Gibco) with 10% FBS, 10 mM L-glutamine, and antibiotics. Murine MT5 (KrasLSL−G12D, Trp53LSL−R270H, and Pdx1-cre) pancreatic cells were a kind gift from Dr Tuveson (Cold Spring Harbor Laboratory, Cold Spring Harbor, NY) and cultured in RPMI (Gibco) with 10% FBS, 10 mM L-glutamine, and antibiotics. Pancreatic cancer patient tissue microarray was purchased from US Biomax (Derwood, MD). Murine antibodies to CD200 (Clone OX-90), PD-1 (Clone RMP1-14), or isotype control (Rat IgG2a, κ, Clones 2A3) were purchased from BioXcell (West Lebanon, NH) for in vivo studies.
Pancreatic stellate cell isolation and nanostring analysis
Pancreatic tumors from humans undergoing surgical resection at the James Cancer Hospital and Solove Research Institute (Columbus, OH) were obtained under an institutional review board-approved protocol following informed consent. Tissue was dissected with a scalpel into 0.5–1 mm3 pieces, then plated in six-well 10 cm2 uncoated culture wells in DMEM with 10% FBS and antibiotics and incubated at 37°C. Stellate cells typically grew out of the tissue in 2–3 weeks, and were characterized by morphology and histological analysis of alpha-smooth muscle actin (α-SMA+) staining. Stellate cells were maintained in culture with fresh media added twice weekly for three passages and then RNA was collected by Trizol extraction. RNA was analyzed using the nCounter PanCancer Immune Profiling Panel (Nanostring Technologies, Seattle WA).
Immunofluorescent staining and imaging
Paraffin embedded pancreatic tumor tissue from surgical resection patients and KPC-Brca2 mice were cut at 5 µM sections on mounted Superfrost Plus slides. Slides were dewaxed and rehydrated, antigen retrieval using a 10 mM sodium citrate buffer and permeabilized using a 0.4% Triton X-100 solution. Non-specific binding was blocked using 5% serum. Tissue was stained with primary antibodies: α-SMA (Clone 1A4; Sigma) and CD200 (Abcam; Cambridge, UK); and secondary antibody Alexa-Fluor 647 donkey antirabbit (Invitrogen). Slides were stained with DAPI to visualize nuclei and mounted with a coverslip. Fluorescent images were analyzed at 20× on a Zeiss Axiovert A1 Observer microscope and analyzed using Image J software.
Flow cytometry
Immunophenotypic analyses of PMBCs from patients, mouse splenoctyes, and single cell suspensions from mouse tumors were assessed by flow cytometry. Cells were incubated on ice for 30 min with fluorochrome-conjugated antibodies, washed, and fixed in PBS containing 1% formalin for flow cytometric analysis on an Attune (Life Technologies) or Fortessa (BD Biosciences) flow cytometer. Antibodies used to stain for human antigens: CD33 (Clone: P67.6; Biolegend), HLA-DR (Clone: L243; Biolegend), CD11b (Clone: ICRF44; Biolegend), CD15 (Clone: HI98; Biolegend), CD14 (Clone: HCD14; Biolegend), CD80 (Clone: 2D10; Biolegend), CD163 (Clone: RM3/1; Biolegend), CD206 (Clone: I5-2; Biolegend), CD56 (Clone: HCD56; Biolegend), CD3 (Clone: OKT3; Biolegend), CD4 (Clone: OKT4; Biolegend), CD8 (SK1; Biolegend), CD45RA (HI100; Biolegend), CCR7 (Clone: 3D12; BB Biosciences), CD25 (Clone: REA570; Miltenyi Biotec), GITR (Clone: 108–17; Biolegend), CD200R (Clone: OX-108; Biolegend), and IgG1 control (Clone: MOPC-21; Biolegend). Antibodies used to stain for mouse antigens: CD45 (Clone: 30-F11; Biolegend); Ly6-g (Clone: 1A8; Biolegend), Ly6-C (Clone: AL-21; BD Biosciences), CD11b (Clone: M1/70; BD Biosciences), CD4 (Clone: GK1.5; Biolegend), CD8 (Clone: 53–6.7; Biolegend), NK1.1 (Clone: PK136; Biolegend), and F4/80 (Clone: BM8; Biolegend).
Murine models of pancreatic cancer
KPC-Brca2 mice were generated by interbreeding Brca2flox2/flox2 ; KrasLSL−G12D/+ with Brca2flox2/flox2 ; Trp53LSL−R270H/+ ; Pdx1-cre animals.29 The mouse strains p53LSL−R270H (strain number 01XM3), KrasLSL−G12D (strain number 01XJ6), and Pdx1-cre (strain number 01XL5) were acquired from the National Cancer Institute (NCI) Frederick Mouse Repository. All transgenic mice generated in this study were maintained on a mixed 129/B6 genetic background.
In vivo efficacy studies
In vivo treatments were completed as previously described.21 Briefly, KPC-Brca2 mice (5 weeks of age) were treated with isotype control or anti-CD200 Ab at a dose of 200 µg/mouse, three times each week (Monday, Wednesday, and Friday). Following 2 weeks of treatment, animals were euthanized via CO2 asphyxiation, followed by cardiac puncture. Splenocytes and tumor tissue were collected for further analysis. Pathology was assessed in H&E stained slides to determine the differentiation state of tissue as pancreatic intraepithelial neoplasia (PanIN)−1, PanIN-2, PanIN-3, or PDAC. For studies using MT5 tumor cells, 1×10⁶ cells were injected subcutaneously in the flank of C57BL/6 mice and injected intraperitoneally three times each week with 200 µg/mouse of isotype, anti-CD200 and/or anti-PD-1 Ab (BioXCell) treatment starting once tumors reached 50–100 mm3 volume.
Single-cell RNA sequencing using chromium 10× genomics platform
Cryopreserved whole PBMC from PDAC patients (n=4) were thawed, washed, and counted. Cell viability was between 83% and 92%. Single cells were isolated using the Chromium Next GEM 5′ gene expression kit, targeting recovery of 4000 cells per patient. Libraries were constructed and sequenced according to the manufacturer’s instructions (Illumina NovaSeq, Nationwide Children’s Hospital Institute for Genomic Medicine/Genomic Services Laboratory). Sequence data were processed using Cell Ranger V.3.1.0. Cell recovery was 4132±1486 cells per sample. After aggregation, one sample showed significant batch effect and was removed from the analysis. Single-cell gene expression analysis was performed using Monocle V.3.30 Dimensionality reduction was performed using Uniform Manifold Approximation and Projection (UMAP) which is better at preserving local and global structural differences in high-dimensional data compared with tSNE.31 Cell clusters were defined using the Leiden method and cluster top markers were identified by logistic regression.32 Maximum expression of CD200R, DOK1, and DOK2 was plotted by taking the maximum of the scaled, size-factor normalized expression values for these genes in each cell. The genes that were overexpressed by MDSC were analyzed by the Reactome Pathway Profile software to determine potential pathways that may be active in CD200R expressing cells.
PBMC isolation, MDSC generation, and MDSC suppressive activity
PBMC were isolated from source leukocytes of healthy donors (Versiti, Milwaukee, WI) and patients with pancreatic cancer and chronic pancreatitis (CP, from a prospective Institutional Review Board-approved study) via density gradient centrifugation using Ficoll-Paque (Amersham, Pharmacia Biotech, Bjorkgatan, Sweden) as described.33–35 PBMC from healthy donors were cultured in 10% FBS, 10 mM L-glutamine, and 100 µg/mL penicillin/streptomycin in RPMI 1640 (Gibco). To generate functional MDSC, PBMC were cultured with 10 ng/mL of IL-6 and GM-CSF (Peprotech, Rocky Hill, NJ) for 7 days as previously described by our group and others.33 34 PBMC were cocultured with increasing concentration of human recombinant CD200 protein (Sino Biologicals). PBMC were stained for surface markers (HLA-DR, CD11b, and CD33) to confirm percentage of MDSC. To test MDSC suppressive function, MDSC were generated by differentiating PBMC with 10 ng/mL of IL-6 and GM-CSF for 5 days and were then stimulated with vehicle or rhC200 protein for 48 hours. MDSC were cocultured with Carboxyfluorescein succinimidyl ester (CFSE) labeled (Thermo Fisher) autologous negatively selected T cells via RosetteSep (STEMCELL) and activated with anti-CD3/CD28 beads (Gibco) for 4 days. T-cell proliferation was measured on an LSRII flow cytometer.
Immunoblot analysis
Cell lysates were analyzed for protein expression by immunoblot analysis with antibodies against CD200 (Abcam), STAT3 (Catalog 4904; Cell Signaling), pSTAT3 (Catalog 9145; Tyr705; Cell Signaling), and β-actin (Clone: BA3R; Thermo Fisher). Following incubation with appropriate conjugated secondary antibodies, immune complexes were detected using an LI-COR CLx imager (LI-COR, Lincoln, NE).
Real-time PCR
TRIzol reagent (Life Technologies) was used to extract total RNA. Reverse transcription reactions were performed using 400 ng RNA in a reaction with the high-capacity reverse transcription kit (Life Technologies). cDNA was used as a template to measure expression of human IRF-8 (Life Technologies) by quantitative real-time PCR. Human GAPDH (Life Technologies) served as an internal control for each reaction. Real-time PCR reactions were performed using the StepOnePlus Real-time PCR system (Applied Biosystems) with TaqMan (ThermoFisher Scientific) chemistry.
Statistics
A one-way analysis of variance (ANOVA) was used to compare CD200R percentage and mean fluorescent intensity (MFI) between the three groups on the log-transformed values. A two-sample t-test was used to compare percentage and MFI CD200R expression between CD15+ and CD14+ MDSC. Similarly, two-sample t-tests compared tumor volume, intratumoral MDSC, CD4+ T cells, intratumoral CD8+ T-cell percentages, and lesions between mice receiving anti-CD200 and those receiving isotype controls. Further, differences in tumor growth between these two groups of mice, those receiving anti-CD200 antibodies and those receiving isotype controls, were evaluated with a mixed effects regression model containing random effects for intercept and slope by mouse with an unstructured covariance. Differences in tumor growth rate between mice treated with antibodies to CD200 and/or PD-1 were analyzed similarly. To determine the effects of hrCD200 and IL-6/GM-CSF versus PBS on MDSC expansion, and separately IRF-8 expression, linear regression models were fit with fixed effects for each as well as the interaction between the two. Dunnett’s post-hoc test was used to compare each hrCD200 level to 0. One-way ANOVA models with Tukey-Kramer post-hoc tests assessed each of the remaining outcomes between three groups: healthy donors, patients with PDAC, and patients with CP. For each of the above, log transformations were taken when necessary to satisfy assumptions of constant variance and normality. P-values less than 0.05 were considered significant and all analyses were conducted in SAS V.9.4.
Results
CD200 is highly expressed in the PDAC microenvironment
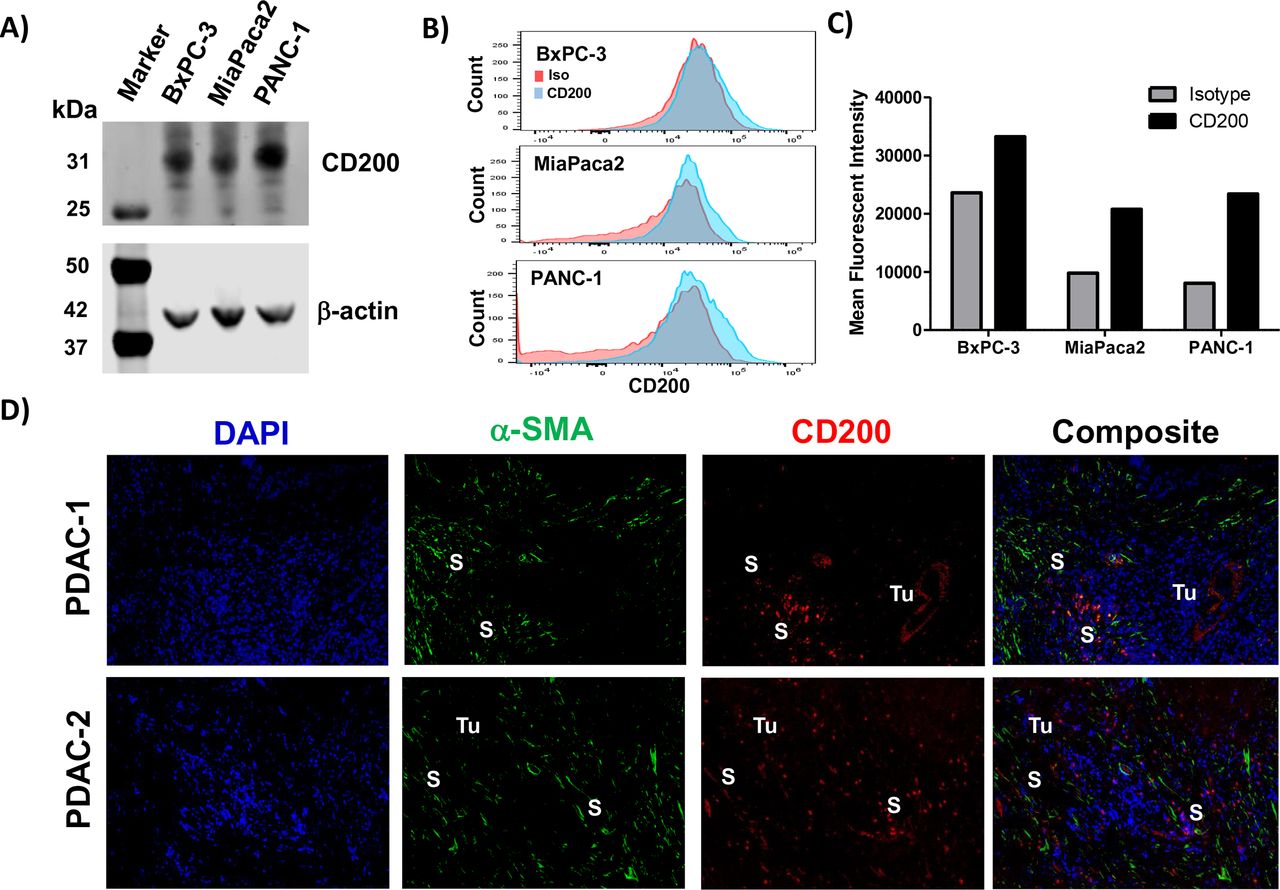
Human pancreatic cancer cell lines (BxPC-3, MiaPaca2, and Panc-1) were confirmed to express CD200 by immunoblot analysis (figure 1A) and a moderate level of surface expression via FACS analysis (figure 1B,C). Immunofluorescence staining of human PDAC surgical specimens provides evidence that CD200 is expressed in the human pancreatic TME (figure 1D) compared with isotype control stained tissue (online supplementary figure 1). Further analysis of CD200 expression in the PDAC tissue led to the observation that CD200 was expressed by both the epithelial tumor cells and a population of α-SMA+ stromal cells. Additionally, investigation of RNA isolated from patient-derived stromal cell lines (n=10 patients) exhibited significantly increased expression of CD200 as compared with RNA isolated from normal human pancreatic fibroblasts (online supplementary figure 2; p<0.01). A commercially available tissue microarray with different levels of pancreatic cancer disease progression (PanIN-1, PanIN-2, and PanIN-3/PDAC) was stained via immunohistochemistry for CD200 expression (online supplementary figure 3A). Quantification of the CD200 expression by histology (H-score) confirmed no difference in expression levels across the spectrum of microscopic progression (ie, PanIN-1/2 compared with PanIN-3/PDAC) (online supplementary figure 3B).
Supplemental material
Supplemental material
Supplemental material

Pancreatic tumor and stromal cells express elevated levels of CD200. Cell lysates from pancreatic cancer cell lines (BxPC3, MiaPaca2, PANC-1) were analyzed by (A) immunoblot for CD200 with β-actin as a loading control. (B) CD200 surface staining on the pancreatic cancer cell lines were analyzed by flow cytometry (Red, Isotype control; Blue, CD200). (C) Mean fluorescent intensity values from flow cytometry stained cell lines for CD200. (D) Archived surgical patient PDAC specimens were stained by IF for DAPI (blue), α-SMA (green), and CD200 (red). Tumor (Tu) and stromal (S) positive compartments of the tissue are marked in white. α-SMA-alpha-smooth muscle actin.
MDSCs from patients with PDAC express elevated levels of CD200R
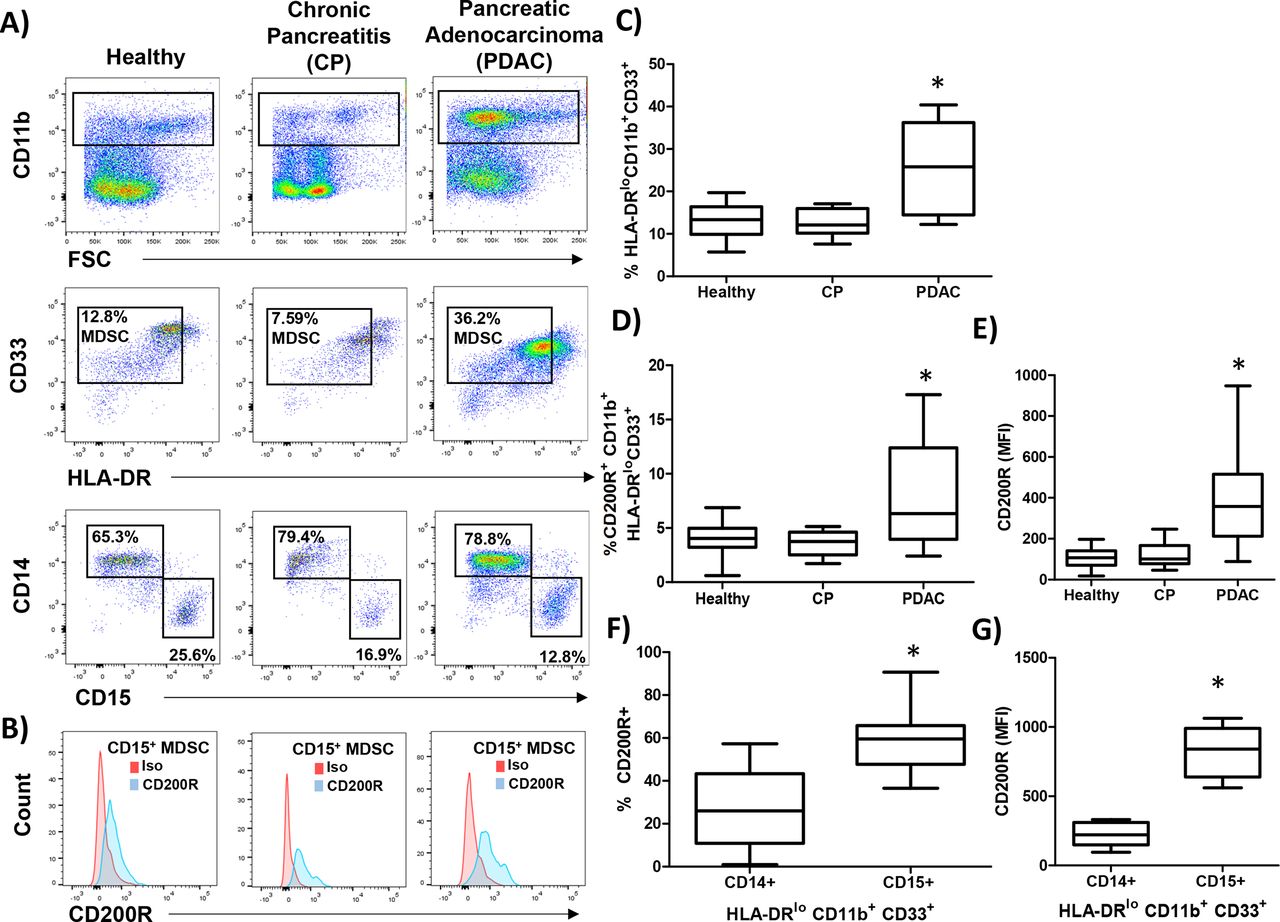
Next, we investigated whether the expression of the CD200 receptor (CD200R) was expressed by MDSC populations from healthy donors, patients with CP, and PDAC. PBMC were stained for granulocytic (CD11b+CD33+HL-DR−/lowCD15+) and monocytic (CD11b+CD33+HL-DR−/lowCD14+) MDSC (figure 2A) and analyzed for expression of CD200R (figure 2B). As expected, patients with PDAC had elevated numbers of circulating MDSC compared with healthy donors and patients with CP (figure 2C; p=0.0060 and p=0.0042, respectively). Interestingly, MDSC in patients with PDAC had a significantly higher percentage of cells expressing CD200R (figure 2D; p=0.0433 and p=0.0132) and a higher level expression (MFI) of CD200R than healthy or CP patients (figure 2E; p<0.0001 and p=0.0001). Additionally, we observed a greater percentage (figure 2F; p=0.0007) and greater MFI (figure 2G; p<0.0001) of CD200R in CD15+ MDSC and compared with CD14+ MDSC.

CD200 receptor (CD200R) is elevated on MDSC from patients with PDAC. PBMC were isolated from healthy donors (n=9), patients with chronic pancreatitis (CP; n=10), or pancreatic ductal adenocarcinoma (PDAC; n=17) and (A) stained by flow cytometry for granulocytic (CD11b+CD33+HL-DR−/lowCD15+) and monocytic (CD11b+CD33+HL-DR-/lowCD14+) MDSC. (B) Representative CD200R (blue) or isotype control (red) staining of CD15+ MDSC. (C) Percent total MDSC, (D) CD200R positive cells, and (E) mean fluorescent intensity (MFI) were quantified across all patient groups. (F) Percent and (G) MFI of either CD14+ or CD15+ MDSC that express CD200R. Mean±SD; *p<0.05. MDSC, myeloid-derived suppressor cells; PBMC, peripheral blood mononuclear cells.
CD200R expression in other immune populations in patients with PDAC
We expanded our analysis of CD200R on other immune populations including macrophages, which have previously been reported to express the receptor.36 PBMC were stained for macrophage phenotypes previously described as M1 (CD14+CD163+) or M2-like (CD14+CD206+) (figure 3A). Patients with PDAC had a significantly higher number of circulating M2 macrophages (figure 3C; p<0.0001) compared with healthy or CP patients (p=0.0007) with no significant difference in M1 macrophages (figure 3B). Both M1 and M2-like macrophages expressed the CD200R (figure 3D,E). There was no significant difference in CD200R percentage expression or MFI observed in M1-like macrophages (figure 3F,G) and in M2-like macrophages (figure 3H,I) in PBMC between groups.

No significant increase in expression of CD200R on M2 macrophages in patients with PDAC. PBMC were isolated from healthy donors (n=9), patients with CP (n=10), or PDAC (n=11) and (A) stained by flow cytometry for M1 (CD14+CD163+CD206−) or M2 (CD14+CD163+CD206+) macrophages. Percent of (B) M1 or (C) M2 macrophages were quantified across the patient groups. Representative CD200R (blue) or isotype control (red) staining of (D) M1 or (E) M2 macrophages. (F) Percent and (G) MFI of M1-like macrophages expressing CD200R quantified across all patient groups. (H) Percent and (I) MFI of M2-like macrophages expressing CD200R quantified across all patient groups. Mean±SD; *p<0.05. CP, chronic pancreatitis; MDSC, myeloid-derived suppressor cells; MFI, mean fluorescent intensity; PBMC, peripheral blood mononuclear cells; PDAC, pancreatic ductal adenocarcinoma.
We investigated other relevant immune populations in patients with PDAC for differences in CD200R expression. We analyzed by flow cytometry CD4/8 T-cell populations (online supplementary figure 4A) and subpopulations (online supplementary figure 4B). We observed a higher percentage of terminally differentiated effector (CD45RA+CCR7−) CD4+ (online supplementary figure 4C; p=0.0261) and CD8+ (online supplementary figure 4D; p=0.0091) T cells in PDAC compared with healthy controls. However, there was no difference in the expression or number of CD200R+ T cells between the groups within any of the subpopulations (online supplementary figure 4E and F). Additionally, expressions of CD200R in NK (CD3+CD56+; online supplementary figure 5A–C), NKT (CD3lowCD56+; online supplementary figure 5D and E), and T-regulatory cell (CD4+CD25+GITR+; online supplementary figure 5G and H) populations were found to be very low with no significant difference compared with healthy controls.
Supplemental material
Supplemental material
CD200 antibody blockade limits PDAC tumor progression
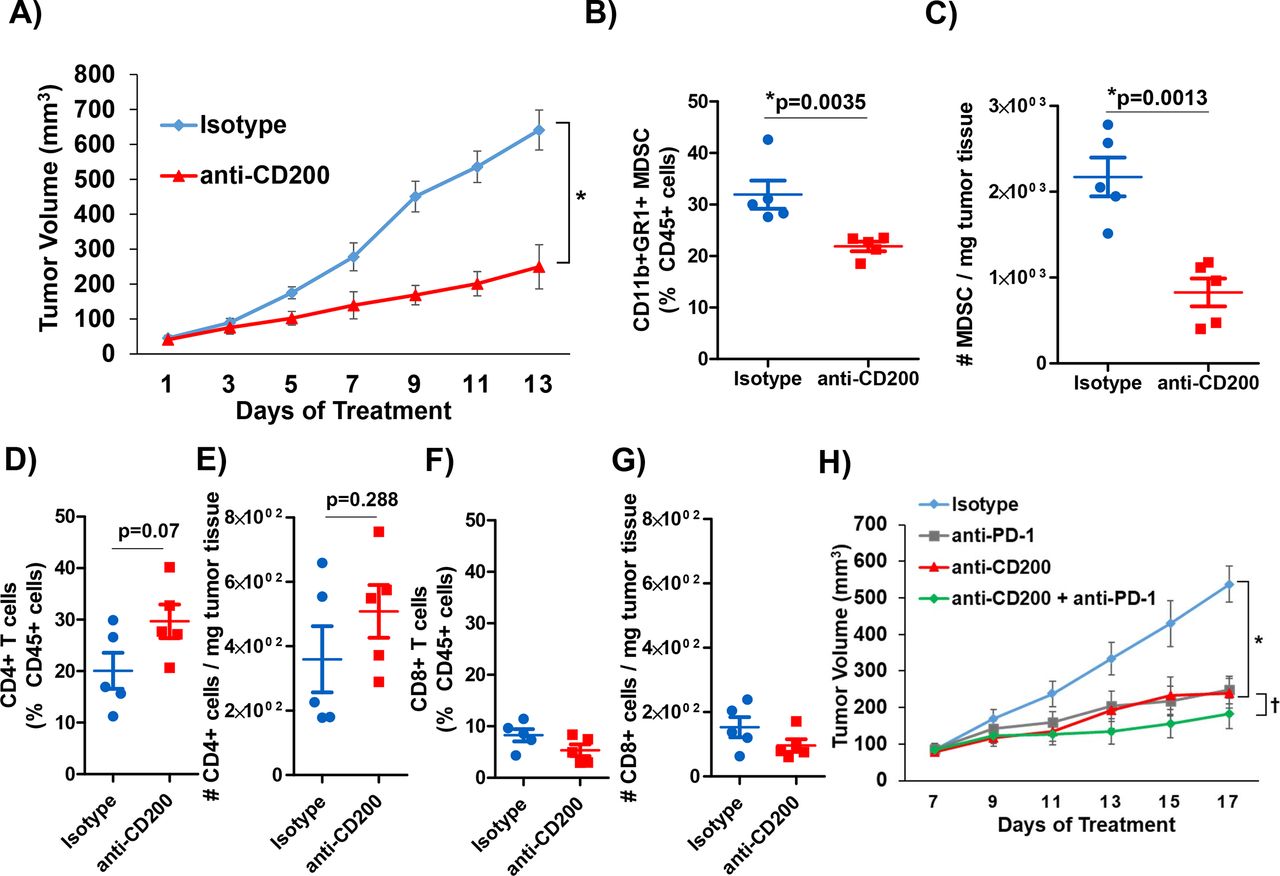
We postulated that CD200 expression in the PDAC TME is driving the expansion of MDSC, thus inhibiting the antitumor immune-mediated responses. To test this hypothesis, we utilized murine MT5 tumor cells subcutaneously injected into C57BL/6 mice. As previously described, this cell line was derived from KPC tumors and has both G12D mutated Kras and R172H Trp53.21 37 We confirmed that CD11b+GR1+MDSC from MT5 tumor-bearing mice expressed the CD200R (online supplementary figure 6A and B) similar to what was observed in patient MDSC. Once tumors were palpable, mice were treated with anti-CD200 or isotype control antibodies until study endpoint. A significant inhibition of tumor growth was observed in response to anti-CD200 antibody blockade compared with isotype control treated mice (figure 4A; p=0.0208). Tumors were processed at the study endpoint and underwent phenotypic analysis by flow cytometry. These data confirmed a significantly decreased percentage and number of infiltrating MDSC in the tumor tissue of mice receiving anti-CD200 antibodies compared with mice receiving isotype controls (figure 4B,C; p=0.0035). Additionally, we also observed a trend in an increase in intratumoral CD4+ T cells (figure 4D,E; p=0.07 and p=0.288) and no change in intratumoral CD8+ T-cell percentages and numbers (figure 4F,G).
Supplemental material

CD200 antibody blockade elicits antitumor response. KPC-derived MT5 tumor were subcutaneously injected into C57BL/6 mice. (A) Mice were treated with 200 µg/mouse of CD200 or isotype control antibodies 3× a week (n=5 mice/group). Intratumoral flow cytometry staining (percent of CD45+ cells and number per mg of tumor tissue) for (B) and (C) MDSC (CD11b+GR1+), (D) and (E) CD4+ T cells, (F) and (G) CD8+ T cells. (H) C57BL/6 mice were inoculated subcutaneously with MT5 tumor cells and were treated once palpable. MT5 tumor-bearing mice were treated with 200 µg/mouse of anti-CD200, PD-1, or isotype control antibodies 3× a week (n=5 mice/group). Mean±SD; * and †=p<0.05. MDSC, myeloid-derived suppressor cells.
We investigated whether blockade of CD200 could enhance the efficacy of PD-1 checkpoint antibody blockade in a murine model of PDAC. For these studies, MT5 tumor-bearing mice were treated with antibodies to CD200 and/or PD-1 until study endpoint. Mice receiving single antibody CD200 or PD-1 treatment had a significantly reduced tumor volume compared with isotype control treated mice (figure 4H; p=0.0368 and p=0.0037). Additionally, mice administered the combination of CD200 and PD-1 antibodies demonstrated significantly limited tumor growth compared with single antibody and isotype control treated mice (figure 4H; p<0.05).
CD200 antibody blockade limits tumor growth in a genetically engineered mouse (GEM) model of PDAC
To further confirm our data in a genetic model that better recapitulates many aspects of patient tumors, we used a highly aggressive, autochthonous model of spontaneously arising PDAC driven by mutant Kras, Trp53, and Brca2 which expresses CD200 similar to what we observed in human tissue (figure 5A). As previously described, there is a 100% penetrance of PDAC in these KPC-Brca2 mice at age 5–6 weeks of age.21 Additionally, KPC-Brca2 mice have identical histopathology as the KPC model, but have a more aggressive phenotype that decreases the overall survival of these mice. We have reported that KPC-Brca2 mice have similar numbers of CD3+ and F4/80+ macrophage infiltration compared with KPC mice and are typically unresponsive to single-agent immune-based therapies.21 38 Further, the increased rate of disease progression in KPC-Brca2 along with histopathology, stromal involvement, and immune infiltration make this model ideal for therapeutic studies compared with using the classical KPC genetically engineered mouse (GEM) model. KPC-Brca2 began antibody treatment at 6 weeks of age and were treated for 2 weeks with anti-CD200 or isotype control antibodies. Following 2 weeks of treatment, mice were euthanized and pancreata were isolated for histologic analysis (figure 5B). There was a significant increase in the percentage normal tissue, with fewer PanIN-3 and foci of adenocarcinoma in mice treated with antibodies targeting CD200, as compared with animals treated with isotype control Ab (figure 5C; p<0.05).
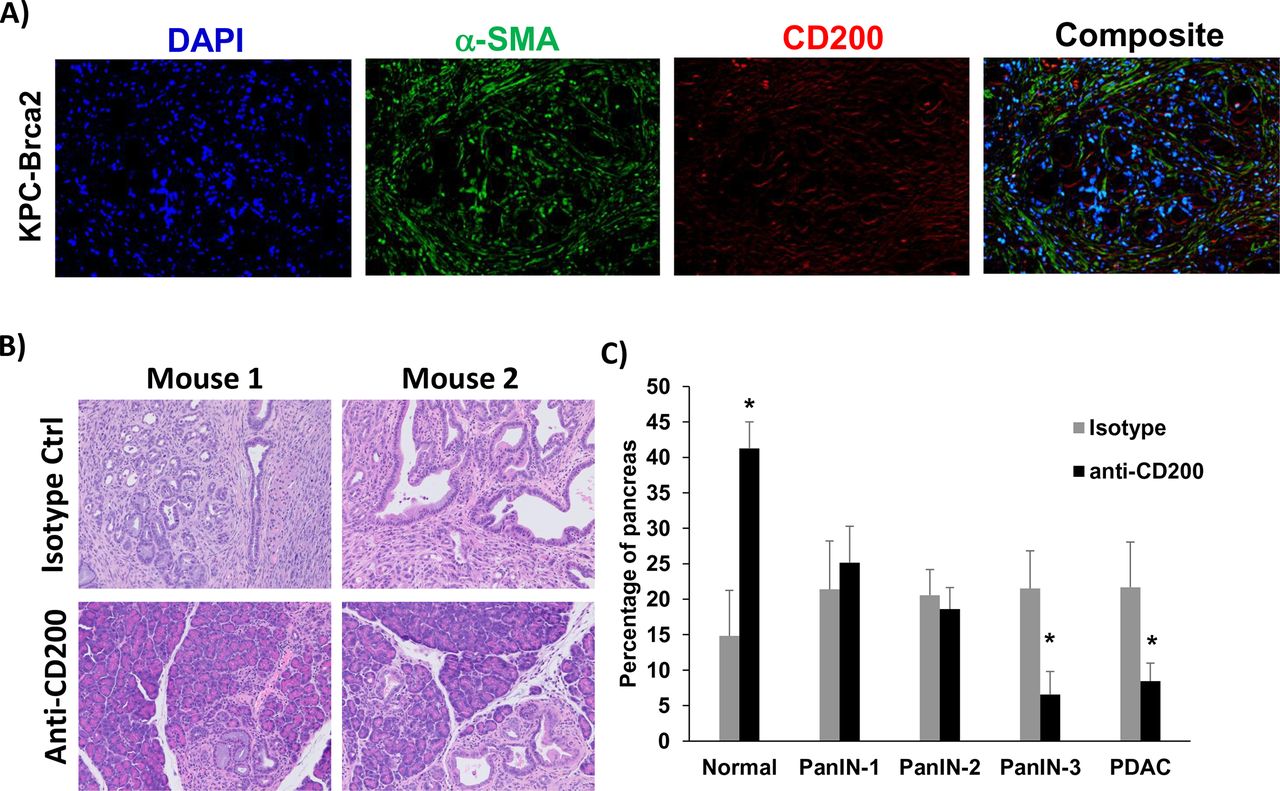
CD200 antibody blockade limits tumor progression in GEM model of PDAC. (A) Representative immunofluorescence from pancreatic tissue of KPC-Brca2 mice stained for DAPI (blue), a-SMA (green), and CD200 (red). (B) KPC-Brca2 mice were treated at 6 weeks of age with 200 µg (intraperitoneal injection three times/week) of isotype control or CD200 antibodies (n=5 mice/group). (C) Histology was pathologically scored for PanIN lesions and quantified. Mean±SD; *p<0.05. GEM, genetically engineered mouse; PDAC, pancreatic ductal adenocarcinoma; α-SMA-alpha-smooth muscle actin.
CD200 enhances cytokine-driven expansion and activity of MDSC in vitro
To better understand the mechanism by which CD200 affects MDSC in vivo, we further investigated PBMC from patients with PDAC and performed single-cell RNA sequencing to identify downstream pathways. Immune populations were defined using graph-based clustering and identified by expression of canonical genes (online supplementary figure 7A–C). These patients were aggregated into a single UMAP plot (figure 6A) and in figure 6B analyzed for over-expression of CD200R and canonical downstream targets Dok1 and Dok2. We identified a list of genes that were overexpressed in the cluster of MDSC that expressed CD200R/Dok1/Dok2. We investigated the differential expression of these genes (online supplementary table 1) and analyzed the signaling pathways in which these genes are active.39 40 We observed significant interactions in signaling by interferons, and other cytokines (figure 6C; p<0.05), indicating that CD200R signaling may potentially activate pathways involved in MDSC expansion.
Supplemental material
Supplemental material

Analysis of genes expressed by CD200R+ populations from PBMC of patients with PDAC. PBMC from patients with PDAC (n=3) were processed by single-cell RNA sequencing and analyzed by Chromium 10× genomics. (A) All three patients were aggregated and clustered into different immune populations based on gene expression data. (B) Cells overexpressing genes involved in CD200R signaling (CD200R, Dok1, and Dok2) were identified by taking the maximum of the scaled, size-factor normalized expression values for these genes in each cell. (C) Reactome Pathway Profile software was used to analyze the significant interactions of genes that were expressed by CD200R+ MDSC. The genes that were overexpressed by CD200R+ MDSC were analyzed by the Reactome software to determine potential pathways that may be active in CD200R expressing cells. MDSC, myeloid-derived suppressor cells; PBMC, peripheral blood mononuclear cells; PDAC, pancreatic ductal adenocarcinoma; UMAP, Uniform Manifold Approximation and Projection.
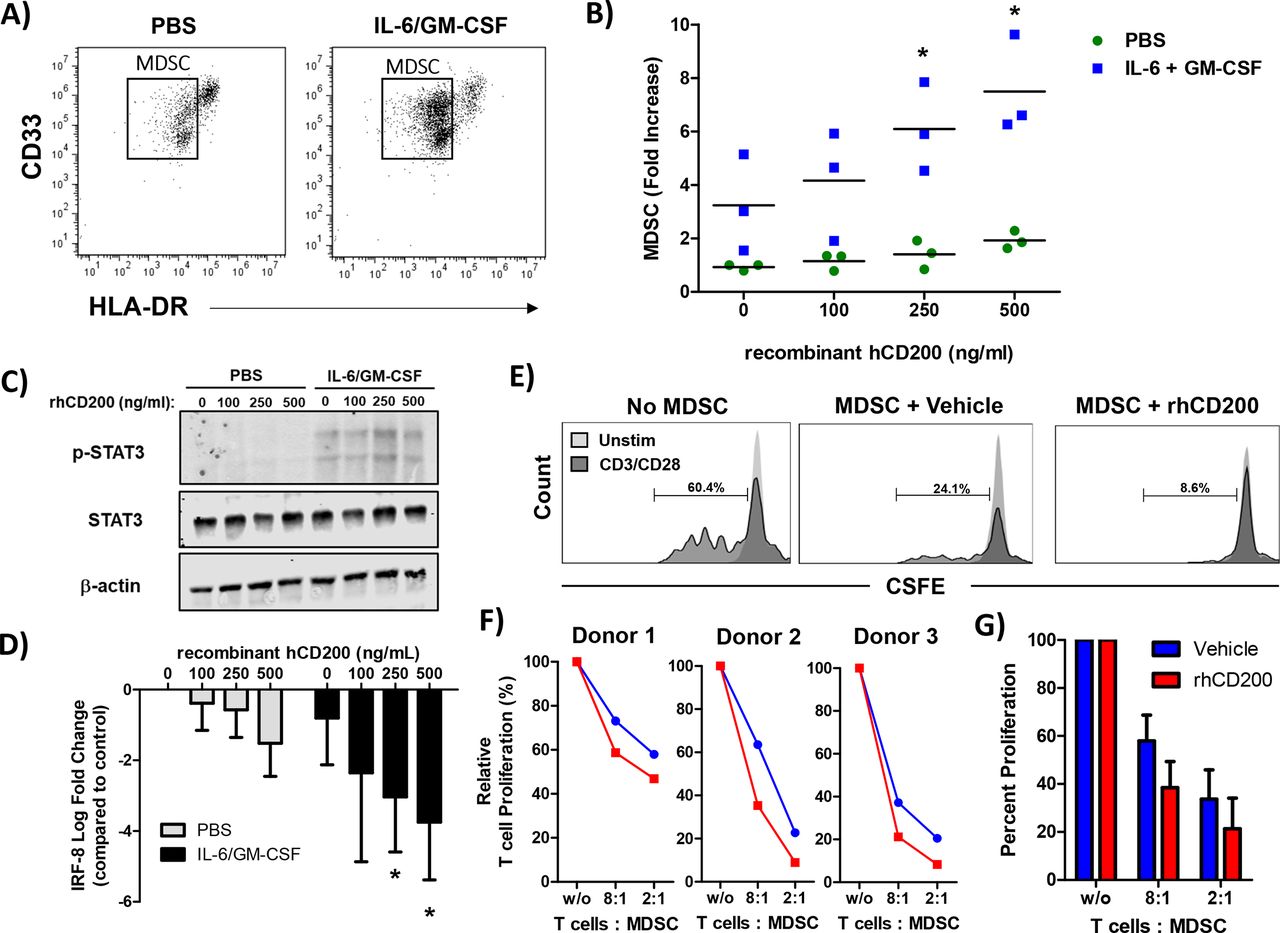
To test whether CD200 affects MDSC expansion, we performed a series of in vitro assays on healthy donor PBMC. As previously described, healthy donor PBMC stimulated with IL-6 and GM-CSF for 7 days leads to the expansion of functional MDSC in vitro.12 For these experiments, PBMC were stimulated with increasing concentrations of recombinant human CD200 protein (hrCD200) in the absence or presence of cytokines (IL-6 and GM-CSF) for 7 days and analyzed for percentage of MDSC via flow cytometry (figure 7A). Analysis revealed a significant increase in the percentage of cytokine-driven expansion of MDSC when cells were cultured with hrCD200 (figure 7B, p<0.05). When examining downstream signaling pathways involved in MDSC expansion, we observed an increase in phosphorylation of STAT3, when cells were stimulated with IL-6/GM-CSF and rhCD200 (figure 7C). We also observed a significant decrease in the expression of IRF-8 (figure 7D; p<0.05), which can negatively regulate MDSC expansion. To test whether CD200 affects MDSC activity, we generated MDSC in vitro from healthy donor PBMC stimulated with IL-6 and GM-CSF. After 5 days, we removed cytokines and stimulated cells with 200 ng/mL of rhCD200 for 48 hours and tested their ability to inhibit autologous CD3/CD28 mediated T-cell proliferation (figure 7E). MDSC stimulated with rhCD200 resulted in a trend of greater inhibition of CD3/CD28 mediated-T-cell proliferation compared with vehicle stimulated MDSC (figure 7F,G).
CD200 enhances the cytokine-driven differentiation and suppressive activity of MDSC in vitro. Normal donor PBMC were cultured for 7 days with 10 ng/mL of IL-6 and 10 ng/mL of GM-CSF and stained by flow cytometry for the percentage of MDSC (CD11b+CD33+HLA-DRlo). (A) Representative flow cytometry dot plots from unstimulated or IL-6/GM-CSF stimulated PBMC after 7 days of differentiation. (B) During differentiation, cells were cultured in the presence of recombinant human CD200 protein (rhCD200). (C) Healthy donor PBMC were stimulated with 10 ng/mL of IL-6 and GM-CSF for 30 min with increasing concentrations of rhCD200 protein. Cell lysates were analyzed for STAT3 phosphorylation (p-STAT3) with β-actin as a loading control. (D) Healthy donor PBMC were stimulated with 10 ng/mL of IL-6 and GM-CSF with increasing concentrations of rhCD200 protein for 2 hours. RNA was isolated and expression of IRF-8 was analyzed by real-time PCR. (E) PBMC from healthy donor blood was stimulated with 10 ng/mL of IL-6 and GM-CSF to differentiate cells into MDSC for 5 days. Cells were then cultured with vehicle control or 200 ng/mL rhCD200 for 48 hours. MDSC were then cocultured with autologous CFSE-labeled T cells stimulated. T cells were stimulated with CD3/CD28 beads and proliferation was measured after 4 days by CFSE dilution. (F) Individual donor T-cell proliferation and (G) quantification across all donors. Mean±SD; *p<0.05. MDSC, myeloid-derived suppressor cells; PBMC, peripheral blood mononuclear cells.
Discussion
Responses to immune-based therapeutics in pancreatic cancer patients have shown limited results with poor efficacy.41–44 Recent clinical trials in patients with metastatic PDAC testing the combination of anti-PD-L1 and anti-CTLA4 immunotherapy reported disappointing objective responses of only 3.1%.9 Novel immunotherapy strategies both targeting T cells and also immunosuppression may help to overcome the poor efficacy observed in current clinical trials. Levels of infiltrating CD8+ T lymphocytes are low in the PDAC TME and numbers of immunosuppressive factors (IL-6, VEGF, IL-10) and suppressive cell types (MDSC, T-regs, Th-17 cells) are highly elevated.11 16 17 Previous work from our group showed that targeting suppressive factors, such as IL-6, resulted in enhanced efficacy of immunotherapy in preclinical models of PDAC.21 However, antibody blockade of IL-6 had no effect on circulating or intratumoral numbers of MDSC in mice with PDAC. This study provides evidence that CD200 expression in the pancreatic TME can promote immunosuppression and inhibit responses to immunotherapy. CD200 is expressed on the surface of both tumor epithelial and tumor-derived stroma in the TME. Expression of CD200R is elevated on MDSC from patients and mice with PDAC. Mice with subcutaneous MT5 pancreatic tumors had inhibited growth when treated with single agent anti-PD-1, CD200, or the combination. Antibody blockade of CD200 limited tumor growth leading to reduced intratumoral percentages of MDSC. However, MT5 subcutaneous tumors contain high numbers of T-cell infiltrates and are slightly immunogenic to anti-PD-1 immunotherapy which does not exactly replicate patient responses to checkpoint inhibitors. PDAC tumors in mice that display a T-cell inflamed phenotype do have greater responses to immunotherapy.45 Although, we performed additional experiments using the less immunogenic KPC-Brca2 GEM model in which we still observed antibody blockade of CD200 could also limit tumor growth. We found that pathways involved in MDSC expansion were upregulated and cytokine-driven expansion of MDSC in vitro was enhanced by CD200 stimulation. Our data suggests that CD200 promotes the expansion and activity of MDSC in the PDAC TME and inhibition can enhance the efficacy of checkpoint blockade immunotherapy.
The mechanism by which CD200 regulates immune responses remains unclear. Reports in ovarian and brain tumor models suggest that CD200 promotes immune suppression leading to increased tumor growth.24 46 CD200 has been shown to be elevated in glioblastoma patients and expression in preclinical models promote tumor growth and immunosuppression.24 However, recent results in melanoma models indicate that CD200 expression inhibits tumor growth.28 47 Liu et al detailed a mechanism in a melanoma model that CD200R signaling limits tumor growth in CD200+ tumor cells.28 This dichotomous nature of CD200 promoting or inhibiting tumor growth may be due to the inflammatory and suppressive makeup of the microenvironment of a specific tumor. Melanoma and lung cancer, which are more “inflamed” (ie, enriched with T cells) and highly mutated (evidenced by neoepitope antigens), are generally permissive and responsive to immunotherapies, including checkpoint inhibitor therapy.48 These properties in melanoma may result in CD200 being more protective, whereas in tumors such as glioblastoma and PDAC, CD200 may actually promote immune suppression as these tumors lack significant T-cell infiltration, have less mutational burden, and are highly enriched in a suppressive stroma. Results in this study provide a role for CD200 in promoting tumor growth and suppressive immune populations in the pancreatic TME.
One approach to improving the efficacy of immunotherapies for cancer patients is to target suppressive immune populations such as MDSC. MDSC are effective in inhibiting the antitumor activity of T and NK cells through the secretion suppressive factors such inducible-nitric oxide species (iNOS), ROS, and arginase.49 Preclinical studies provide evidence that inhibition of iNOS by MDSC can enhance NK cell antibody-dependent cellular cytotoxicity against tumor targets.50 Recent work has highlighted iNOS as a potential mediator of immune suppression in PDAC and would be a good actionable target.51 Studies that have targeted chemokine receptors (CXCR2) on MDSC lead to inhibited trafficking to the tumor and enhance PD-1 antibody efficacy.52 Targeting cytokines and factors that promote MDSC expansion, such as IL-6 and GM-CSF, are therapeutic options for PDAC. However, combination blockade of IL-6 and PD-L1 in preclinical models of PDAC limited tumor progression, but had no effect on MDSC numbers in vivo.21 Data in this study provide evidence that CD200 can activate expansion pathways in MDSC and antibody blockade promotes antitumor immunity. Mice treated with antibodies blocking CD200 resulted in a reduced percentage of MDSC in the pancreatic TME (figure 4). Additionally, in vitro data suggest that CD200 enhances MDSC expansion pathways indicating a potential mechanism for increased MDSC numbers in patients with PDAC. Subsequent studies will further explore these genes and pathways in CD200R+ MDSC which could elucidate potential downstream signaling candidates for targeting these suppressive immune populations in patients. Finally, MDSC from patients with PDAC express elevated levels of CD200R and CD200 expressed in the TME which may lead to increased MDSC expansion and activity in these patients. Understanding how these CD200 signaling pathways modulate MDSC expansion and activity will be important in targeting these cells to reduce immunosuppression in the pancreatic TME.
Conclusions
In summary, CD200 is expressed by the pancreatic TME and CD200R is elevated in expression on MDSC in patients with PDAC. CD200 blockade limits pancreatic tumor growth and enhanced PD-1 efficacy in preclinical animal models. Single-cell RNA sequencing and qPCR provides evidence that CD200 promotes MDSC expansion pathways. Further, stimulation with recombinant CD200 enhanced MDSC expansion and may increase their suppressive activity. Therefore, targeting CD200 could represent a potential option for reducing immunosuppressive MDSC and enhancing antitumor immunotherapeutic treatment approaches in PDAC.
References
Footnotes
Twitter @TMaceLab
Contributors Study concept design: TAM and WC. Acquisition, analysis, or interpretation of data: FC, MT, RS, JS, BWB, ZC-M, and TAM. Statistical analysis: AH. Critical revision of the manuscript for important intellectual content: all authors. All authors read and approved the final manuscript.
Funding The project described was supported by Award Number Grant KL2TR002734 from the National Center for Advancing Translational Sciences. The project described was supported by Award Number Grant UL1TR002733 from the National Center for Advancing Translational Sciences. Research reported in this publication was supported by the National Cancer Institute and National Institute of Diabetes and Digestive and Kidney Diseases (NIDDK) under award number U01DK108327 (DC, PH). This project was supported by the OSU Comprehensive Cancer Center (OSUCCC) Biostatistics, Genomics, Target Validation, Analytical Cytometry, and Comparative Pathology & Mouse Phenotyping Shared Resources supported in part by NCI grant P30 CA016058. Project was also supported by an IDEA award from the intramural research program at OSUCCC. Project was supported by the Biliary System and Liver Cancer Research Fund at the OSUCCC. The content is solely the responsibility of the authors and does not necessarily represent the official views of the National Center for Advancing Translational Sciences or the National Institutes of Health.
Competing interests None declared.
Patient consent for publication Not required.
Ethics approval All patients provided voluntary written informed consent (Institutional Review Board protocols: 2017H0041; 2010C0051; 2016C0039) to participate. The protocols and subsequent amendments were approved by The Ohio State University Institutional Review Board. All animal protocols were approved by the Ohio State University Institutional Animal Care and Use Committee (IACUC) at The Ohio State University (Approved IACUC protocol 2009A0178-R3) and mice were treated in accordance with institutional guidelines for animal care. The Ohio State University Laboratory Animal Shared Resource is an Association for Assessment and Accreditation of Laboratory Animal Care International accredited program that follows Public Health Service policy and guidelines. All other experiments were completed under the research protocols (2014R00000086; 2013R00000056) approved by the Ohio State University Institutional Biosafety Committee.
Provenance and peer review Not commissioned; externally peer reviewed.
Data availability statement Data are available upon reasonable request.