Article Text

Abstract
Background High C reactive protein (CRP) levels have been reported to be associated with a poor clinical outcome in a number of malignancies and with programmed cell death protein 1 immune checkpoint blockade in patients with advanced cancer. Little is known about the direct effects of CRP on adaptive immunity in cancer. Therefore, we investigated how CRP impacted the function of T cells and dendritic cells (DCs) from patients with melanoma.
Methods The effects of CRP on proliferation, function, gene expression and phenotype of patient T cells and DCs, and expansion of MART-1 antigen-specific T cells were analyzed by multicolor flow cytometry and RNA-seq. Additionally, serum CRP levels at baseline from patients with metastatic melanoma treated on the Checkmate-064 clinical trial were assessed by a Luminex assay.
Results In vitro, CRP inhibited proliferation, activation-associated phenotypes and the effector function of activated CD4+ and CD8+ T cells from patients with melanoma. CRP-treated T cells expressed high levels of interleukin-1β, which is known to enhance CRP production from the liver. CRP also suppressed formation of the immune synapse and inhibited early events in T-cell receptor engagement. In addition, CRP downregulated the expression of costimulatory molecules on mature DCs and suppressed expansion of MART-1-specific CD8+ T cells in a dose-dependent manner by impacting on both T cells and antigen-presenting cells. High-serum CRP levels at baseline were significantly associated with a shorter survival in both nivolumab-treated and ipilimumab-treated patients.
Conclusions These findings suggest that high levels of CRP induce an immunosuppressive milieu in melanoma and support the blockade of CRP as a therapeutic strategy to enhance immune checkpoint therapies in cancer.
Trial registration number NCT01783938 and NCT02983006.
- immunology
- oncology
- medicine
This is an open access article distributed in accordance with the Creative Commons Attribution Non Commercial (CC BY-NC 4.0) license, which permits others to distribute, remix, adapt, build upon this work non-commercially, and license their derivative works on different terms, provided the original work is properly cited, appropriate credit is given, any changes made indicated, and the use is non-commercial. See http://creativecommons.org/licenses/by-nc/4.0/.
Statistics from Altmetric.com
Background
C reactive protein (CRP) is a pentameric protein (pentraxin) synthesized by the liver, and also to a lesser degree by smooth muscle cells, macrophages, endothelial cells, lymphocytes and adipocytes in response to interleukin (IL)-6 and IL-1β.1 2 CRP levels in the serum are highly elevated in response to acute inflammation and, to a lesser degree, chronic inflammation. CRP binds to lysophosphatidylcholine on the surface of dead or dying eukaryotic cells and bacteria, activating complement via C1q.1 It was first identified in the serum of patients with infection as a molecule that reacted with the somatic ‘C’ carbohydrate antigen of pneumococcus.1 Normal levels in healthy individuals reach up to 5–10 µg/mL, but patients with cancer can display CRP levels >500 µg/mL.
A number of studies have shown that high CRP levels are associated with increased cancer risk, but the mechanisms by which that occurs are unclear and little is known about the effects of elevated CRP on immune function in patients with cancer. Recent data suggest that chronic inflammation and high CRP levels are associated with poor survival in renal cell, lung, pancreatic and breast cancer, in patients with head and neck cancer treated with radiotherapy and that CRP is associated with bone destruction in multiple myeloma.3–9 CRP has been shown to supress T cell function in autoimmunity in mouse models and to suppress dendritic cell function in normals.10 11 High CRP levels have been shown in small studies to be associated with a poor outcome with the use of the cytotoxic T-lymphocyte-associated protein 4 (CTLA-4) blocking antibody tremelimumab.12 A recent study demonstrated a significant association between pretreatment CRP levels and progression-free and overall survival in patients with lung cancer treated with programmed cell death protein 1 (PD-1) immune checkpoint blockade.13 These data are consistent with our published data, which demonstrated that acute phase proteins including CRP, serum amyloid A and P and complement components were associated with a poor clinical outcome in patients with melanoma treated with PD-1 blockade.14
In spite of decades of monitoring CRP and other chronic inflammatory mediators in patients with cancer, little is known about the direct effects of CRP on adaptive immunity in cancer. In the current work, we explored how CRP impacted on the phenotype and function of effector T cells and dendritic cells (DCs) derived from patients with melanoma, and generated a hypothesis as to the mechanism by which CRP suppressed adaptive immunity. Using patient samples and in vitro assays, we demonstrated that CRP negatively impacted DC and T-cell function, supporting a hereto unknown role for CRP and acute phase proteins in immunosuppression. These results highlight the clinical potential of targeting CRP and acute phase proteins (eg, by IL-1β and/or IL-6 inhibitors) as means to overcome resistance to immune checkpoint blockade.
Methods
Patient samples
Peripheral blood samples and serum were obtained from patients with metastatic melanoma under an Institutional Review Board-approved protocol.15 Samples were coded with an anonymized 5-digit number and their identity was unknown to those performing the experiments. Peripheral blood mononuclear cells (PBMCs) were isolated by density gradient with 1.077 g/mL Ficoll-Paque (GE Healthcare, Chicago, Illinois, USA). For cryopreservation, PBMCs were re-suspended in human AB serum (Omega Scientific; Tarzana, California, USA) with 10% dimethyl sulfoxide (Sigma-Aldrich, St Louis, Missouri, USA), frozen at −80°C and stored in liquid nitrogen. CD3+ and CD8+ T cells were isolated using a magnetic negative selection kit (StemCell Technologies, Vancouver, British Columbia, Canada). Cells were cultured with 10% AB human serum in beta-mercaptoethanol, non-essential amino acids, HEPES, penicillin, streptomycin and gentamicin supplemented X-VIVO media (Corning, Corning, New York, USA). Serum was obtained from whole blood patient samples, centrifuged to remove cells and frozen at −80°C until time of use.
Analysis for serum CRP levels in patients with melanoma
A total of 95 patients with melanoma from the Checkmate-064 trial15 had available serum for CRP testing by a magnetic bead-based assay (R&D Systems, Minneapolis, Minnesota, USA), performed according to the manufacturer (29 samples from cohort A, 66 from cohort B). A Luminex MagPix instrument (R&D) was used for sample acquisition.
Reagents
Recombinant human IL-2 (Aldesleukin, Prometheus Laboratories, San Diego, California, USA), C3a, C5a, IL-4, IL-7, IL-15, IL-21 and granulocyte-macrophage colony-stimulating factor (GM-CSF) (R&D) and sodium azide-free, endotoxin-free CRP (R&D, and US Biological; Salem, Massachusetts, USA) were commercially obtained. αCD3 (clone OKT3), αCD28 (clone CD28.2) and IgG4 antibodies were obtained from Biolegend (San Diego, California, USA).
Flow cytometry analysis
Cells were washed using phosphate-buffered saline with 2% fetal calf serum, and stained with monoclonal antibodies (mAbs) specific for CD3 (UCHT1, BD Biosciences, Franklin Lakes, New Jersey, USA), CD4 (RPA-T4, BD Biosciences), CD8 (RPA-T8, BD Biosciences), CD45RA (HI100, BD Biosciences), CD62L (DREG-56, eBioscience, San Diego, California, USA), CD40 (5C3, BD Biosciences), CD80 (L307.4, BD Biosciences), CD83 (HB15e, BD Biosciences), CD86 (2331, BD Biosciences), PD-1 (MIH4, BD Biosciences), PD-L1 ( MIH1, BD Biosciences), ICOS (DX29, BD Biosciences), CD223 (LAG-3) (3DS223H, eBioscience), Tim-3 (F38-2E2, BD Biosciences), CD137 (4-1BB) (4B4-1, BioLegend), CD69 (FN50, BD Biosciences), CD134 (OX-40) (ACT35, BD Biosciences) or CD152 (CTLA-4) (BNI3, BD Biosciences). Intracellular staining of Ki67 (B56, BD Biosciences), EOMES (WD1928, eBioscience), T-BET (O4-46, BD Biosciences), GRANZYME A (CB9, eBioscience), GRANZYME B (GB11, BD Biosciences), GRANZYME K (G3H69, eBioscience), PERFORIN (b-D48, BioLegend) and CRP (Abcam, Cambridge, Massachusetts, USA) were performed after fixation and permeabilization using Foxp3 kit (eBioscience), according to manufacturer’s instructions. Live Dead dyes (Invitrogen, Carlsbad, California, USA) were used to assess viable cells. The cells in all experiments were analyzed with an Attune NXT flow cytometer (ThermoFisher Scientific, Waltham, Massachusetts, USA) and data were analyzed using FlowJo 10 software (FlowJo, Ashland, Oregon, USA).
Stimulation of CD3+ or antigen-specific CD8+ T cells
CD3+ or CD8+ T cells were labeled with 2.5 µM carboxyfluorescein succinimidyl ester (CFSE) or CellTrace Violet (Invitrogen) for 5 min at 37°C. Cells were stimulated with γ-irradiated PBMCs pulsed with MART-1 peptide, or anti-CD3/CD28 mAb (Dynabeads, ThermoFisher) for 72–120 hours. To investigate CRP uptake, cells were treated with mitomycin C (Sigma).
Intracellular cytokine staining
CD3+ T cells were treated for 72 hours with CRP at the indicated concentrations, in the presence of IL-2 (100 IU/mL), then stimulated for 4 hours with phorbol 12-myristate 13-acetate (PMA) and ionomycin (plus protein transport inhibitors) (Invitrogen). Cells were stained for cell surface markers followed by intracellular cytokines (interferon (IFN)-γ (4S.B3, BD Biosciences), tumor necrosis factor (TNF)-α (MAb11, BD Biosciences) and IL-2 (MQ1-17H12, BD Biosciences)) after fixation and permeabilization.
T-cell receptor signaling analysis by flow cytometry
CD3+ T cells were treated with CRP at the indicated concentrations, washed once with medium and stimulated with H2O2 for 30 min. Cells were stained by flow cytometry for cell surface and phosphoprotein makers (ZAP70 (pY319)/Syk (pY352) (17A/P-ZAP70, BD Biosciences), LCK (pY505) (4/LCK-Y505, BD Biosciences) and LAT (pY717) (I58-1169, BD Biosciences) (M89-61, BD Biosciences)) after fixation and permeabilization using a transcription factor phosphor-buffer set (BD Biosciences).
Calcium influx analysis
CD3+ T cells were treated with CRP at the indicated concentrations, stained by flow cytometry for surface markers, then loaded with Ca2+ indicator using a calcium assay kit (BD Biosciences) for 1 hour at 37°C after staining for cell surface makers. Intracellular Ca2+ influx after PMA and ionomycin (Invitrogen) was monitored for 5 min by flow cytometry.
Generation of monocyte-derived dendritic cells
CD14+ cells were purified from PBMCs using a human CD14-positive selection kit (StemCell), cultured with 20 ng/mL GM-CSF and 20 ng/mL IL-4 with replacement with fresh medium containing the cytokines 3 days later, and harvested on day 6 to generate immature DCs (iDCs) for subsequent experiments.16 To generate mature DCs (mDCs), 1 µg/mL lipopolysaccharide (LPS) (Sigma-Aldrich) was added to iDCs cultures for 48 hours.
Generation of antigen-specific CD8+ T cells
Antigen-presenting cells (APCs) (PBMCs or mature DCs) were pulsed with 10 µM Melan-A26-35 (EAAGIGILTV) peptides (BioSynthesis, Lewisville, Texas, USA) specific for HLA-A*0201 for 2 hours. After 35 Gy γ-irradiation (CellRad, Faxitron, Tucson, Arizona, USA), APCs were cultured in round-bottom 96-well plates containing sorted CD8+ T cells previously cultured for 7 days.16 17 Half of the medium was replaced with fresh medium containing 20 IU/mL IL-2, 10 ng/mL IL-7, 10 ng/mL IL-15 and 20 ng/mL IL-21 on the next day. MART-1-specific CD8+ T cells were detected by direct flow staining with MART-1/HLA-A*0201 tetramer PE (MBL, Woburn, Massachusetts, USA).
RNA-seq analysis
CD8+ T cells were cultured with CRP or no additional treatment at the indicated concentrations and with APC previously pulsed with MART-1 peptides, as described below for 5 days. Total RNA was isolated with the RNeasy Mini Kit (Qiagen, Venlo, The Netherlands). RNA quality and quantity were analyzed on a Bioanalyzer 2100 (Agilent, Santa Clara, California, USA) using a pico chip. Indexed cDNA libraries were pooled and sequenced on a HiSeq2500 machine (Illumina, San Diego, California, USA). Sequencing results were demultiplexed and converted to FASTQ format by using bcl2fastq software. All paired RNA reads were mapped to the human reference genomes hg38 using the aligner STAR.18 Then, we applied featureCounts to the BAM files from STAR and generated counts for each gene based on the number of aligned reads which overlapped its exons.19 The normalization of RNA expression counts and differential analysis were performed by the DESeq2 by using negative binomial generalized linear models.20
Analysis of CRP cellular localization
CD3+ T cells in the presence or absence of CRP for 1 hour were settled onto poly-lysine-coated slides, stained with 4′,6-diamidino-2-phenylindole (DAPI) (Invitrogen) after fixation and permeabilization using Image-iT Fixation/Permeabilization Kit (Invitrogen), and then stained with fluorescein isothiocyanate (FITC)-conjugated CRP antibody (Abcam) and Alexa Fluor 594-conjugated antihuman CD4, and CD8a analyzed by confocal microscopy (LSM 880, Zeiss, Jena, Germany).
Immunological synapse detection
To detect the immunological synapse, CD3+ T cells were treated for 48 hours with CRP at the indicated concentrations, then activated with anti-CD3/CD28 mAb (Dynabeads) for 10–30 min. Co-cultures of cells and beads were settled onto poly-lysine-coated slides, fixed in 4% formaldehyde and stained with DAPI, FITC-conjugated CRP antibody and Texas Red-X Phalloidin (Invitrogen) then analyzed by confocal microscopy (Zeiss LSM 880), as previously described.21 22
Statistical analysis
Differences between two groups (control and treatment groups) were analyzed by Student’s two-tailed paired t-test using Prism V.8 software (GraphPad, San Diego, California, USA). The survival probabilities were estimated using the Kaplan-Meier method, where differences in the variables were calculated using the log-rank test. P values <0.05 were considered to be statistically significant.
Results
CRP binds T cells and inhibits proliferation
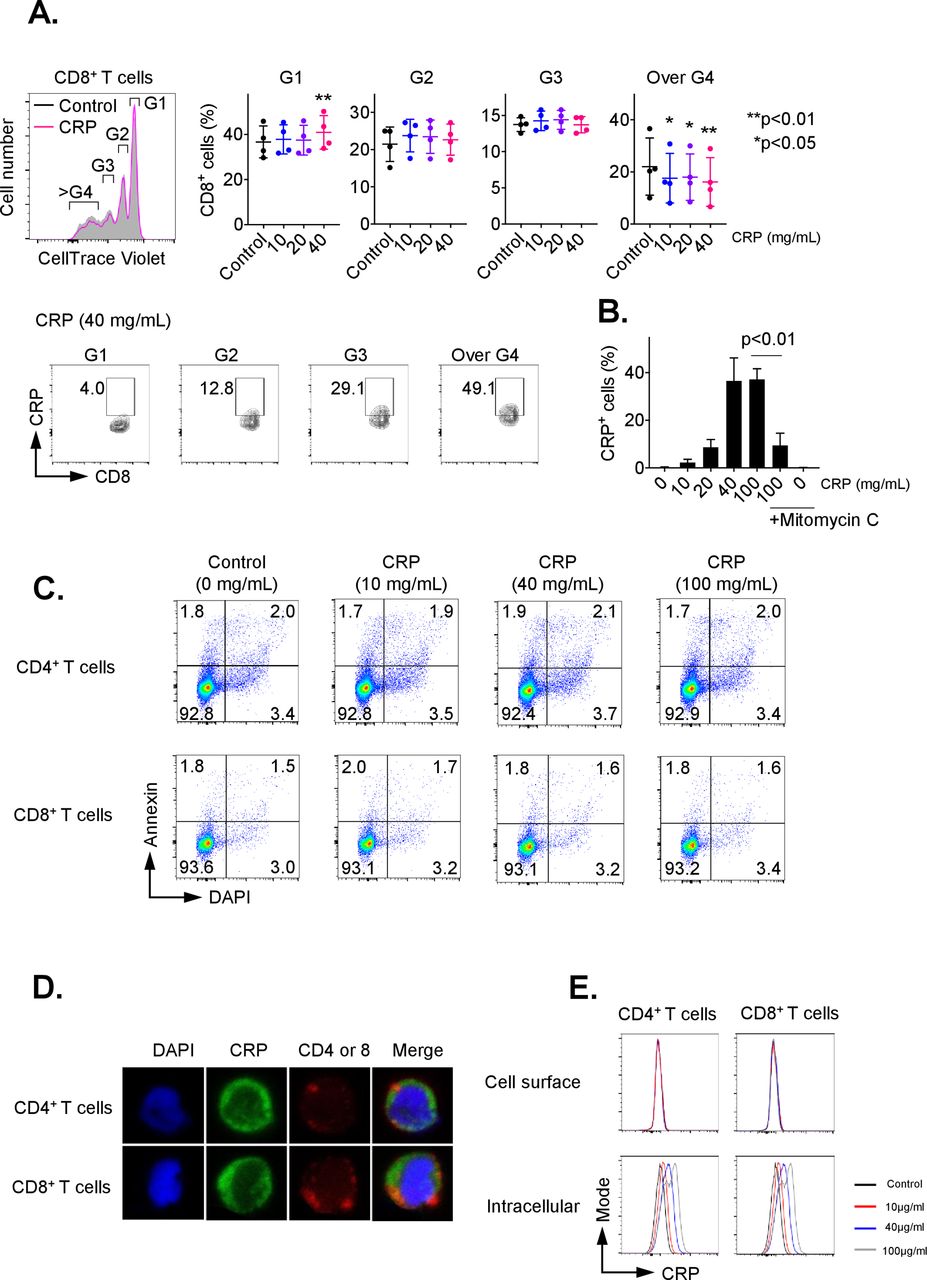
To investigate the influence of CRP on adaptive T-cell immunity, we first examined the impact of CRP on proliferation of CD3/CD28-activated CD8+ and CD4+ T cells. As shown in figure 1A, CD8+ T cells treated with CRP had significantly decreased percentages of cells with ≥3 divisions (p<0.05), as determined by Cell Trace Violet Staining. After 72 hours of treatment, approximately 40% of CD8+ T cells were positive for CRP, with a plateau at 40 µg/mL (figure 1B, p<0.01). Similar data were seen for CD4+ T cells with up to 25% positivity (online supplementary figure 1A). T cells are not known to express CRP,1 and the non-treated control CD8+ and CD4+ groups demonstrated no positivity for CRP, supporting that the observed positivity was from uptake of exogenous CRP. CRP staining was inhibited by mitomycin C as shown in figure 1B, suggesting that it was dependent on cell division. Uptake was seen as early as 15 min after exposure (data not shown). CRP exposure for 72 hours also consistently inhibited Ki67 expression in activated CD8+ and CD4+ T cells (online supplementary figure 2A/B).
Supplemental material

C reactive protein (CRP) affects the proliferation on activated T cells. CD3+ T cells were isolated by negative magnetic separation from baseline patient peripheral blood mononuclear cells (PBMC), and activated with CD3/CD28 antibody for 72 hours in the presence of different CRP concentration. (A) Proliferation analysis of CellTrace Violet-labeled CD3+ T cells stimulated with anti-CD3 and CD28 monoclonal antibodies (mAbs) for 72 hours. The cell ratio and CRP+ population of CD8+ cells in each generation (G1 to over G4) were detected. *P<0.05, **p<0.01 relative to control. (B) Representative data of CRP uptake by CD3+/CD8+ T cells. The uptake of CRP was dose-dependent and inhibited by mitomycin C. Error bars are SD for triplicate samples assessed. (C) Annexin V (BD Biosciences) and 4′,6-diamidino-2-phenylindole (DAPI) double staining of CD3+ T cells treated with CRP at doses of 10, 40 or 100 µg/mL for 24 hours. (D) CD3+ T cells pretreated with CRP at 100 µg/mL were stained with anti-CD4, CD8 (red) and CRP (green) antibodies, and nuclei were stained with DAPI. Stained cells were analyzed under a confocal microscope. (E) The frequency of CRP-treated CD4 and CD8 T cells stained with anti-CRP antibody before permeabilization (cell surface) was compared with cells after permeabilization (intracellular) by flow cytometry.
CRP is also known to activate the classical complement pathway.1 2 No impact on T-cell proliferation was observed with treatment using C3a and C5a, which are major cleavage components of the classical complement pathway (online supplementary figure 2C). In addition, we analyzed whether LPS affects T-cell proliferation, since the commercial CRP might be contaminated with trace LPS; no impact on proliferation was observed after treatment with LPS (online supplementary figure 2D).
To determine the impact of CRP on T-cell viability, CD3+ cells were treated for 24 hours with CRP at doses ranging from 10 to 100 µg/mL. T-cell apoptosis was evaluated by staining with annexin V and DAPI on cells from at least three patients. There was no significant difference in the percentage of annexin V+/DAPI− (6.23% vs 6.28%) nor annexin V+/DAPI+ (1.52% vs 1.67%) (figure 1C). T-cell treatment with CRP for 24 hours also had no significant effect on active caspase 3, 8 and 9 expression (online supplementary figure 3A).
We also evaluated the effect of CRP on cell cycle progression. After 72 hours of activation by PMA and ionomycin, CRP induced G0/G1 cell cycle arrest in CD3+ T cells (online supplementary figure 3B). These results suggest that CRP inhibited T-cell proliferation but had no impact on apoptosis or cell death.
CRP is internalized by T cells after treatment
We next examined the localization of CRP in T cells after CRP (10–100 µg/mL) treatment using confocal microscopy. CRP was internalized by T cells 24 hours after CRP exposure in vitro, as shown in figure 1D. Following CRP treatment (10–100 µg/mL) for 1 hour, we assessed surface versus intracellular CRP presence in T cells by flow cytometry. T cells stained with anti-CRP antibody before permeabilization did not display CRP bound on the surface of CD4+ and CD8+ cells, but 20%–40% of T cells stained with anti-CRP antibody after permeabilization were positive for CRP (figure 1E). The presence of CRP in T cells increased in a dose-related manner 24 hours after CRP treatment (online supplementary figure 3C), suggesting that CRP is internalized after exposure.
FcR blockade does not reverse CRP internalization and inhibition of proliferation in CRP-treated T cells
While CRP binds to eukaryotic and microbial phosphocholine,1 2 playing a role in innate immunity, viable T cells do not express membrane phosphocholine. IgG Fc receptors (FcR: CD16, CD32 and CD64) have also been identified as receptors for CRP on a variety of cells. However, little evidence supports the expression of FcRs by T cells.23 Fewer than 10% of CD4+ and CD8+ T cells express CD16, CD32 or CD64 (online supplementary figure 4A). To determine if blocking FcR hindered CRP internalization and inhibition of T-cell proliferation, sorted CD3+ T cells were cultured with CRP at concentrations ranging from 10 to 100 µg/mL in the presence of anti-CD16, anti-CD32 or anti-CD64 antibodies. These blocking antibodies did not reverse the binding of CRP to CD4/8 T cells (online supplementary figure 4B) nor did they alter the effects of CRP on the proliferation of T cells (online supplementary figure 4C).
CRP alters phenotype, activation and checkpoint protein expression of activated T cells
To determine whether CRP alters T-cell phenotypes, we treated CD3/CD28-stimulated, flow-sorted CD3+ T cells of patients with melanoma with CRP at doses from 10 to 40 µg/mL, for 72 hours. CD4+ and CD8+ T cells were categorized based on CD62L (L-selectin) and CD45RA expression into naïve CD45RA+CD62L+ (TN), CD45RA+CD62L+CDF95+ (TSCM), central memory CD45RA−CD62L+ (TCM), effector memory CD45RA−CD62L− (TEM) and effector CD45RA+CD62L− (TE) populations. CRP treatment did not result in any significant differences in the frequency of CD8+ (online supplementary figure 5A) or CD4+ (online supplementary figure 6A) T-cell phenotypes relative to controls. In contrast, CRP-expressing cells exhibited a small and non-significant decrease in the frequency of TN CD8+ cells (3.4%–1.6%), TE CD8+ cells (7%–4%) and increase in TCM and TSCM CD8+ cells (32.3%–36.9% and 13.1%–16.3%) (online supplementary figure 5B). Similar results were observed for CD4+ T cells (online supplementary figure 6B).
Since inhibitory checkpoint receptors (eg, CTLA-4, PD-1) and activating molecules (eg, ICOS, 4-1BB) are upregulated during T-cell activation, we evaluated expression of these proteins on T cells after CRP treatment. Heatmaps show that CRP at doses up to 40 µg/mL significantly increased protein expression of 4-1BB, CTLA-4, ICOS, LAG3 and TBET in CRP+ CD8+ T cells (figure 2A, p<0.05) and 4-1BB, ICOS, EOMES, PD-1, TBET, TIM3 and PERFORIN in CRP+ CD4+ T cells (figure 2B, p<0.05), compared with their counterpart CRP− T cells.

C reactive protein (CRP) affects the function of activated T cells. Expression of checkpoint, stimulatory and cytolytic proteins by flow cytometry on activated CD8 (A) and CD4 (B) T cells treated with CRP at 10, 20 and 40 µg/mL as a heat map. Representative data from three patients. (C) CD3+ T cells isolated from baseline peripheral blood mononuclear cells (PBMC) samples of patients with melanoma prior to any treatment were cultured for 72 hours with or without CRP at doses of 10, 40 and 100 µg/mL, and subsequently stimulated for 4 hours with phorbol 12-myristate 13-acetate (PMA)/ionomycin for analysis of intracellular cytokine production (interferon (IFN)-γ, tumor necrosis factor (TNF)-α and interleukin (IL)-2) and granzyme B. Representative data from five patients. Error bars are +SEM for triplicate samples assessed. **P<0.05, **p<0.01, ***p<0.001 relative to cells with no treatment.
We next investigated the effects of CRP on IFN-γ, TNF-α and IL-2 cytokine production. CD3+ T cells were cultured for 72 hours with CRP at doses from 10 to 100 µg/mL, and subsequently stimulated for 4 hours with PMA/ionomycin. Addition of CRP (100 µg/mL) inhibited intracellular cytokine expression, with a reduction by 13% (p=0.0005) and 30% (p=0.0003) in IL-2 and IFN-γ by CD4+ T cells, and by 6.5% (p=0.0285) and 25.5% (p=0.0005) in CD8+ T cells (figure 2C). In contrast, CRP increased TNF-α production by 10% (p=0.0002) and 9.6% (p=0.0008) in CD4+ and CD8+ T cells (figure 2C). We also analyzed intracellular granzyme B expression, as a surrogate of cytolytic activity, after CRP treatment of T cells activated via CD3/CD28 for 72 hours. No impact on CD4+ and CD8+ granzyme B expression was observed with CRP treatment up to 100 µg/mL (figure 2C).
CRP inhibits TCR signaling in T cells
To determine the effects of CRP on T-cell receptor (TCR) signaling, we employed flow cytometry to measure phosphorylated TCR signaling intermediates expressed by CD3+ T cells pretreated with CRP and concomitantly stimulated with H2O2. Exogenously added H2O2 induces phosphorylation of functionally relevant TcR tyrosine residues in a manner similar to TCR engagement by anti-CD3 antibodies, resulting in potent phosphorylation of TCR signal pathway intermediates such as LCK, ZAP70 and LAT.24 25 CRP treatment at doses of 10 to 100 µg/mL for 72 hours blocked H2O2-triggered phosphorylation of LCK (early), ZAP70 (intermediate), LAT (late) and ERK (late) on both CD4+ and CD8+ T cells in a dose-dependent manner (figure 3A).

C reactive protein (CRP) inhibits T-cell receptor (TCR) signaling pathway in T cells. (A) Expression of phosphorylated LCK (pY505), ZAP70(pY319)/Syk(pY352), LAT(pY717), ERK(pT202/pY204) and AKT(pS473) on CD3+ T cells pretreated with CRP at 10, 40 and 100 µg/mL for 72 hours and concomitantly stimulated with H2O2 are from one representative of five similar patients. *P<0.05, **p<0.01, ***p<0.001 relative to cells with no treatment. (B) Representative data from three patients of calcium influx on T cells. CD3+ T cells treated with CRP for 24 hours at 10–100 μg/mL were activated with phorbol 12-myristate 13-acetate (PMA) and ionomycin. (C and D) Anti-CD3/CD28 monoclonal antibodies (mAbs) Dynabeads recruit lipid rafts of CD3+ cells to form immunological synapses. CRP (40 µg/mL) treated CD3+ T cells stained with anti-CRP antibody (green) were significantly less likely to recruit lipid rafts to form the immunological synapse at the bead-T cell interface denoted by Phallodin staining (red) that control treated CD3+ T cells. Representative tiled image and high-magnification images from one of three patients.
We next determined whether CRP affected calcium influx in T cells, one of the key early signaling events on binding of TCR by antigen-major histocompatibility complex (MHC), playing an important role in T-cell activation, proliferation and differentiation. CD3+ T cells treated with CRP for 72 hours at 10–100 µg/mL were activated with PMA and ionomycin. CRP suppressed calcium influx by both CD4+ and CD8+ T cells in a dose-dependent manner (figure 3B).
To confirm that binding of CRP to T cells affected early events in TCR signaling, we determined whether CRP blocked formation of the immunological synapse by measuring actin focused at the interface between CD3/CD28 stimulatory beads and T cells. CD3+ T cells treated with 100 µg/mL CRP activated with CD3/CD28 beads were stained for actin, DAPI and CRP (figure 3C–D). T cells that up took CRP formed significant fewer immunological synapses at the bead/T-cell interface, as denoted by actin staining, compared with those without CRP intake (46.0% vs 29.4%, p=0.0481). These data suggest that CRP blocked formation of immunological synapses, inhibiting the earliest events in TCR signaling, and are consistent with CRP-induced decrease in phosphorylation of LCK, ZAP70 and LAT, which are required for lipid raft formation.
CRP inhibits activation and expression of costimulatory molecules on mature dendritic cells
To investigate whether CRP influences antigen presentation, we assessed expression of the DC maturation marker CD83. Purified CD14+ monocytes were cultured with GM-CSF and IL-4 for 5 days, then iDCs were treated with CRP for 72 hours, and stimulated with LPS in order to induce maturation. CRP inhibited CD83 expression after LPS-induced maturation (p=0.05), although CRP did not change CD83 expression on imDCs (figure 4A,B).
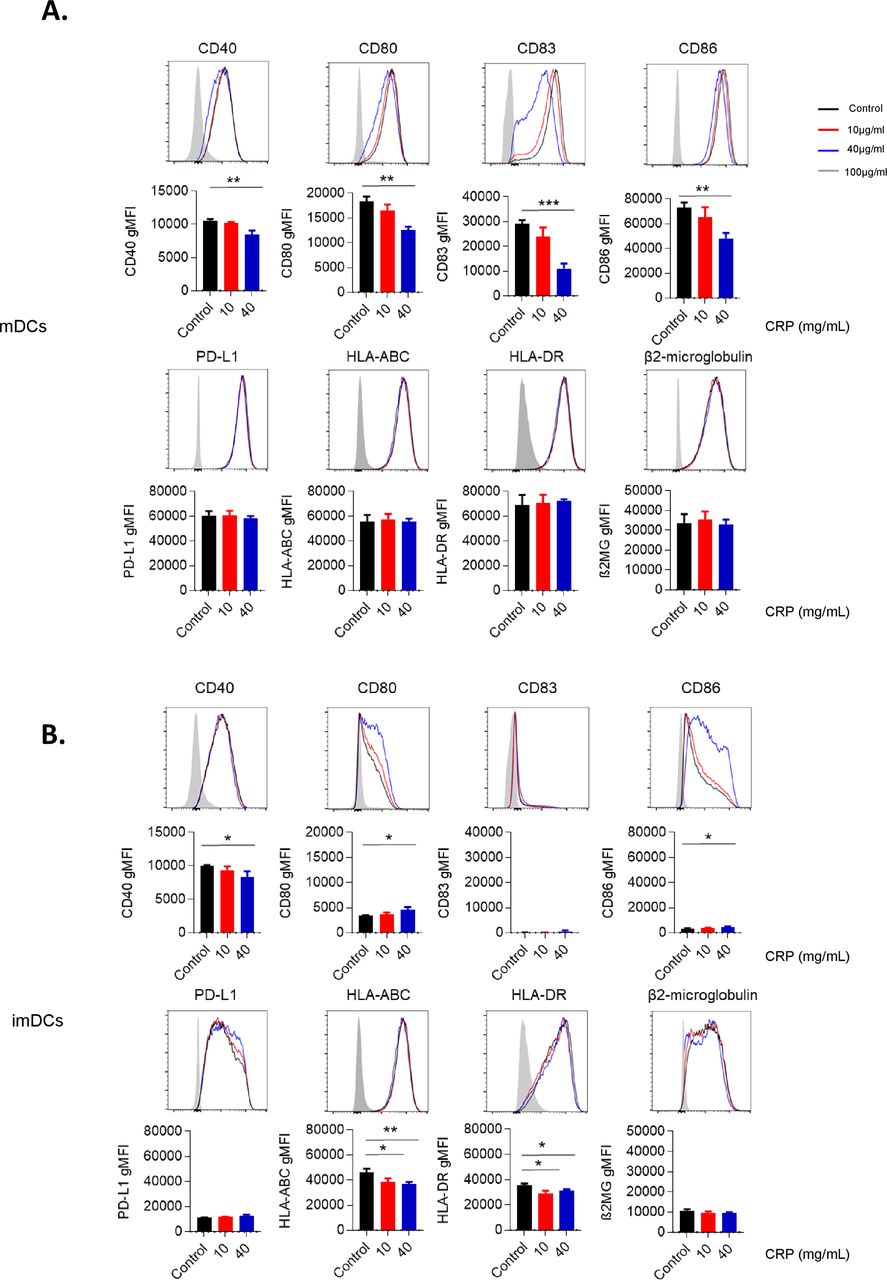
C reactive protein (CRP) inhibits function, costimulatory and checkpoint proteins on dendritic cells (DCs). Frequency of mature (A) and immature (B) DCs treated with CRP at 10 and 40 μg/mL for 48 hours expressed costimulatory markers (CD40, CD80, CD83, CD86, PD-L1, HLA-ABC, HLA-DR and beta-2 microglobulin). Representative data are from one of five patients. Error bars are +SEM for triplicate samples assessed. **P<0.05, **p<0.01, ***p<0.001 relative to cells with no treatment.
We next examined whether CRP affected expression of costimulatory markers (CD40, CD80 and CD86), MHC) (HLA-ABC, HLA-DR and β2-microgulobulin) and checkpoint ligands (PD-L1) on iDCs and mDCs pretreated with CRP before maturation (figure 4A,B). mDCs pretreated with 40 µg/mL CRP exhibited a reduction of CD40 (p=0.003), CD80 (p=0.001) and CD86 (p=0.002) relative to control mDCs. Oppositely, 40 µg/mL CRP increased CD80 (p=0.015) and CD86 (p=0.015) expression on iDCs. CRP did not change PD-L1, HLA-ABC, HLA-DR or β2-microglobulin expression by mDCs, but decreased CD40 (p=0.034), HLA-ABC (p=0.005) and HLA-DR (p=0.0203) expression on imDCs.
CRP inhibits expansion of antigen-specific T cells
Given the inhibitory effects observed on T-cell function and DCs phenotypes by CRP, we evaluated whether CRP inhibited generation of antigen-specific CD8+ T cells from patients with melanoma. Melan-A-specific CD8+ T cells were expanded ex vivo for 7 days with peptide-pulsed PBMC acting as autologous APCs in HLA A*0201 patient samples, increasing from undetectable levels to approximately 0.5%–1% of total CD8+ T cells. However, CRP exposure in vitro suppressed expansion of Melan-A tetramer-positive (Tet+) CD8+ T cells in a dose-dependent manner (figure 5A). In addition, Ki67 expression (p<0.05) and proliferation by CFSE-labeled CD8+ T cells and Melan-A-specific CD8+ T cells were decreased after CRP treatment at either 10 or 40 µg/mL (figure 5B–C).

C reactive protein (CRP) inhibits the expansion of antigen-specific T cells. (A) MART-1-specific CD8 T-cell expansion. CD8+ T cells isolated from HLA-A*0201 patients with melanoma were stimulated by γ-irradiated, MART-126-35 peptide-pulsed peripheral blood mononuclear cells (PBMCs) (antigen-presenting cells (APCs)) for 7 days in presence of different CRP concentration (0, 10, 40 µg/mL). (B and C) Ki67 expression and proliferation by CFSE-labeled Melan-A-specific CD8+ T cells and MART-1 tetramer-positive T cells stimulated by γ-irradiated MART-126-35 peptide pulsed APC. (D) Scheme for assessing whether CRP-impaired generation of Melan-A-positive CD8+ T cells was due to its effect on T cells and/or on mature dendritic cells (mDCs). (E) Purified CD8+ T cells and mDCs separately before co-culture were treated with CRP for 48 hours, and co-cultured with MART-1 peptide-pulsed mDCs. Results shown are representative of three patients assessed over three independent experiments. (F) Volcano plot for the differential expression of total genes. The y-axis corresponds to negative log10 transformed adjusted p value, and the x-axis displays the log2 fold change gene expression value. The red and blue dots represent the significantly differential expressed transcripts (adjusted p value < 0.05); the gray dots represent the transcripts whose expression levels did not reach statistical significance (adjusted p value > 0.05). (G) Expression heat map of genes associated with cytokine-cytokine receptor interaction pathway, and osteoclast differentiation pathway. Error bars are +SEM for triplicate samples assessed. **P<0.05, **p<0.01, ***p<0.001 relative to cells with no CRP treatment.
CRP affects DCs and CD8+ T cells in inhibiting expansion of MART-1-specific T cells
To determine whether the impaired generation of Melan-A-specific CD8+ T cells after CRP treatment was primarily due to its effect on T cells and/or on DCs, CRP was added to purified cultures of CD8+ T cells and mDCs separately for 48 hours before co-culture (figure 5D). Exposure to CRP decreased the number of Melan-A-specific CD8+ T cells whether T cells or mDCs were treated with CRP, and the greatest reduction came with concomitant treatment of T cells and DCs (figure 5E).
CRP upregulates IL-1β in expanded MART-1specific T cells
To gain further insight into the direct impact of CRP on T cells, paired samples of CD8+ T cells activated with HLA-A*0201-restricted Melan-A peptide 26-35(27L) pulsed PBMCs, in the presence of absence of CRP (40 µg/mL) were assessed by RNA-Seq for three patients. Changes in gene expression of T cells treated with CRP compared with no CRP treatment were assessed for each patient (figure 5F). CRP consistently upregulated the expression of the IL-1β gene, a known stimulator of the production of CRP by hepatocytes (log2 FC=3.4, and adjusted p value (q value)=0.00015), in CD8+ T cells. Additionally, we evaluated IL-1β levels in culture supernatants from T cells treated with CRP, and found that CRP increased IL-1β levels in a dose-dependent manner (online supplementary figure 7). Next, pathways associated with significant peaks of RNA expression were evaluated using Enrichr referenced to the KEGG 2016 pathways database (online supplementary table 2).26 27 The most significantly upregulated pathway in CRP-treated CD8+ T cells was cytokine-cytokine receptor interaction pathway including IL-1β, CCL1 and CCL22 (figure 5G, adjusted p value (q value) <0.0001). The top six upregulated pathways included IL-1β and three of them included complement components. The pathway most downregulated by CRP were the osteoclast differentiation pathway (figure 5G q value <0.0001), and all six of the top downregulated pathways included elements involved with antigen presentation.
Supplemental material
Serum CRP levels are associated with clinical efficacy of PD-1 and CTLA-4 blockade
We measured serum CRP in patients with advanced melanoma from the Checkmate-064 trial15 by a Luminex assay to determine if baseline CRP levels were associated with response to nivolumab (anti-PD-1) and ipilimumab (anti-CTLA-4). In the trial, 140 patients were enrolled and randomly assigned to nivolumab for 12 weeks followed by ipilimumab for 12 weeks or to the reverse sequence of ipilimumab followed by nivolumab, of whom 68 and 70 patients, respectively, received at least one dose of study drug. Among these patients, 95 serum samples obtained before study drug administration were available for the analysis (figure 6A). Patient demographics are reported in online supplementary table 1. As seen in figure 6B, overall survival was significantly worse in patients with baseline CRP levels higher than the median (15.48 µg/mL) compared with those with levels lower than the median initially receiving nivolumab or ipilimumab (p=0.001 and 0.0002, respectively).

Serum C reactive protein (CRP) levels in treatment-naïve patients receiving nivolumab (cohort A) or ipilimumab (cohort B) from the Checkmate-064 trial. (A) Consolidated Standards of Reporting Trials diagram for the study. Among 140 patients enrolled in the Checkmate-064 trial, 95 serum samples before administration of study drug were obtained for CRP analysis (29 from cohort A, 66 from cohort B). (B) Kaplan-Meier plot of the relation of overall survival (OS) to CRP levels before treatment. Cut-off point was at the median (15.48 µg/mL). The red curve represents survival for patients below the median, and the blue curve shows survival for those patients above the median. The survival probabilities were estimated using the Kaplan-Meier method, where differences in the variables were calculated using the log-rank test.
Discussion
Acute phase proteins (APP) synthesized in the liver, particularly CRP, have been associated with a variety of detrimental chronic inflammatory states, including infection, diabetes and ischemic heart disease.28 The short pentraxins like CRP or serum amyloid A are secreted pattern recognition receptors and play a role in antibacterial defense as opsonins by binding to apoptotic cell membrane components including phosphatidylcholine and phosphatidylethanolamine.29 Pro-inflammatory cytokines such as IL-1β, IL-8, TNF-α or IL-6 induce hepatic and monocyte-derived production of a number of APPs, including CRP, via transcriptional activation of the STAT3, C/EBP and NF-κB pathways.30 Levels of CRP have long been observed to be elevated in patients with a variety of advanced cancers with levels as high as 500 µg/mL, yet a role of CRP and other APPs in modulating the antitumor immune response has not been previously explored in detail. In the current work, we show that CRP has a profound suppressive effect on adaptive immunity in patients with melanoma. Up to 40% of CD8 T cells bound and internalized CRP, and high levels of CRP diminished the proliferation of CD4+ and CD8+ T cells from patients with melanoma, and it downregulated DC function and altered T-cell and DC phenotypes, which is consistent with previous reports on APCs.11 31 In T cells, CRP was rapidly internalized in a significant proportion of T cells and inhibited the immune synapse, leading to suppression of the earliest events in TCR engagement, including calcium flux and TCR signaling, resulting in a chronic state of immune suppression which has been shown to be associated with a poor outcome with the use of PD-1 blockade in melanoma and lung cancer. Additionally, RNA-seq analysis suggested that CRP upregulated expression of IL-1β gene, a known stimulator of CRP by hepatocytes. CRP also upregulated CCL1 and CCL22 genes, which can attract regulatory T cells to the tumor microenvironment, although CRP did not have any impact on the frequency of peripheral blood regulatory T cells (data not shown).32 In contrast, CRP inhibited the osteoclast differentiation pathway which is associated with antigen presentation to CD8+ T cells.33 The data presented herein suggest that CRP may be responsible for a state of systemic immune suppression in patients with cancer by impacting on both effector T cells and antigen presentation, consistent with previous reports that CRP is associated with a poor clinical outcome for diverse cancers and with checkpoint blockade therapies in melanoma and other malignancies.13 14 Our work evaluated the impact of CRP on peripheral blood T cells and DCs from patients with melanoma, and did not explore the effects of CRP on neoantigen-specific T cells or immunity within the tumor microenvironment. CRP was taken up by activated, proliferating T cells, by mechanisms that are as yet unclear. Further studies, including an assessment of the impact of APPs on antitumor immunity using tumor spheroids are planned as part of an ongoing clinical trial. The role of CRP on T-cell responses and resistance to PD-1 blockade has also not been evaluated in murine models, and the differences in protein sequence and function of CRP in mice and humans may render such studies problematic.34
CRP has been shown in mice to facilitate the opsonization of bacteria by binding to Fc gamma receptors, yet in this work, blockade of Fc gamma receptors did not impact on the adaptive immunosuppression observed with CRP.35 The levels of CRP that were associated with suppression of T-cell and DC function (10–40 µg/mL) in this study are observed in the serum of many patients with advanced cancer. The finding in this study that serum CRP levels are associated with overall survival in patients with stage IV melanoma treated with nivolumab or ipilimumab further support an immune suppressive role for CRP and possibly other APPs and suggest a novel mechanism for resistance to PD-1 blockade in melanoma that may be applicable to other cancers. CRP has been shown to alter DC maturation and function in murine models,31 although it has not been previously shown to behave similarly with human DCs, and few investigations have explored the impact of high levels of CRP on human T cells.
There are considerable data supporting reduction of CRP as an anticancer strategy. CRP has been described as a prognostic factor for outcome in patients with melanoma, as has serum amyloid A.36 37 Antibodies against IL-1β and IL-6 receptor that block liver and monocyte synthesis of CRP and other APPs have been tested in patients and are Food and Drug Administration (FDA) approved for a variety of indications. Tocilizumab, a humanized anti-IL-6Rα antibody that is FDA approved for the treatment of rheumatoid arthritis, juvenile idiopathic arthritis and polyarticular juvenile rheumatoid arthritis, has been shown in patients with cancer to suppress the cytokine release syndrome (CRS) observed with the use of chimeric antigen receptor (CAR)-T-cell therapy and is approved for that indication by the FDA, and more recently was demonstrated to reverse PD-1 blockade-associated immune-related adverse events.38 39 Blockade of IL-6Rα resulted in a significant decrease in serum CRP that was associated with rapid resolution of immune-related adverse events in one report.40 When tocilizumab was used to treat CRS, onset of the condition and recovery was associated with changes in CRP levels, and had no impact on the therapeutic effect of the transferred CAR-T cells.36 41 Tocilizumab was used in a patient with Crohn’s disease and melanoma in combination with a PD-1 blocking antibody, and resulted in a sustained complete antitumor response without causing a flare of the colitis.42
The IL-1β blocking antibody canakinumab was used in a cardiac prevention trial to test the hypothesis that it could reduce the incidence of heart attack, stroke or cardiovascular death in patients with elevated CRP, a biomarker for cardiovascular risk. There was a significant reduction in incidence of lung cancer noted in that trial.43 Reduction in both cardiac events and lung cancer diagnoses was associated with extent of reduction of serum CRP levels.44 There are many different explanations for the reduction in incidence of lung cancer, but the adaptive immune suppressive role for CRP suggested by our data herein suggest that a re-invigorated immune response may at least in part be responsible. Our data would support the use of tocilizumab or canakinumab in combination with PD-1 blockade, and a trial of the former antibody is currently being pursued in patients with metastatic melanoma that are receiving PD-1 and CTLA-4 blockade (NCT03999749).
Conclusions
Elevated levels of acute phase proteins, particularly CRP, are associated with a poor outcome in cancer, but the mechanism by which that occurs is unclear. We found that CRP bound to T cells, suppressed signaling events early in TCR engagement and downregulated antigen-presenting function in melanoma.
Acknowledgments
The authors would like to thank the colleagues from Bristol-Myers Squibb including Christine Horak and Megan Wind-Rotolo for their insight and assistance as well as for providing nivolumab. The authors would also like to thank the Genome Technology Center and Microscopy Laboratory at NYU Langone Health for their assistance.
References
Footnotes
TY and JI contributed equally.
Contributors TY: designed and conducted experiments; analyzed and interpreted results; assembled manuscript. JI: designed and conducted experiments; analyzed and interpreted results; assembled manuscript. IG: designed and conducted experiments; analyzed and interpreted results. ASL: designed and conducted experiments; analyzed and interpreted results; assisted in assembly of manuscript. YH: analyzed the data on RNA-seq. MK: designed and conducted experiments; analyzed and interpreted results; assisted in assembly of manuscript. MV: designed and conducted experiments; analyzed and interpreted results; assisted in assembly of manuscript. DMW: designed and conducted experiments; analyzed and interpreted results.
Funding This work was supported by grant funding from the National Cancer Institute (grant number R01CA175732).
Competing interests JW: honoraria and travel from BMS, Merck, GSK, Genentech, AstraZeneca, Pfizer, CytoMx, EMD Serono, Incyte. Stock in Biond, Altor, Protean, CytoMx, Celldex, Sellas. Research funding from NextCure. All other clinical research funding to my institution, not me. Named on a patent for a PD-1 biomarker by Biodesix not used in this work. Named on a CTLA-4 biomarker patent by Moffitt Cancer Center not used in this work. Named on a patent for the use of 41-BB antibody for tumor infiltrating lymphocyte growth by Moffitt Cancer Center not used in this work.
Patient consent for publication Not required.
Provenance and peer review Not commissioned; externally peer reviewed.
Data availability statement Data are available on reasonable request.