Article Text

Abstract
Background New and fully validated tests need to be brought into clinical practice to improve the estimation of recurrence risk in patients with colon cancer. The aim of this study was to assess the analytical performances of the Immunoscore (IS) and show its contribution to prognosis prediction.
Methods Immunohistochemical staining of CD3+ and CD8+ T cells on adjacent sections of colon cancer tissues were quantified in the core of the tumor and its invasive margin with dedicated IS modules integrated into digital pathology software. Staining intensity across samples collected between 1989 and 2016 (n=595) was measured. The accuracy of the IS workflow was established by comparing optical and automatic counts. Analytical precision of the IS was evaluated within individual tumor block on distant sections and between eligible blocks. The IS interlaboratory reproducibility (n=100) and overall assay precision were assessed (n=3). Contribution of the IS to prediction of recurrence based on clinical and molecular parameters was determined (n=538).
Results Optical and automatic counts for CD3+ or CD8+ were strongly correlated (r=0.94, p<0.001 and r=0.92, p<0.001, respectively). CD3 and CD8 staining intensities were not altered by the age of the tumor block over a period of 30 years. Neither the position of tested tissue sections within a tumor block nor the selection of the tissue blocks affected the IS. Reproducibility of the IS was not affected by multiple variables (eg, antibody lots, DAB revelation kits, immunohistochemistry automates and operators). Interassay repeatability of the IS was 100% and interlaboratory reproducibility between two testing centers was 93%. Finally, in a case series of patients with stage II–III colon cancer, the relative proportion of variance for time to recurrence was greatest for the IS (53% of prognostic variability) in a model that included IS, T-stage, microsatellite instability status and total number of lymph nodes.
Conclusion IS is a robust and validated clinical assay leveraging immune scoring to predict recurrence risk of patient with localized colon cancer. The strong and independent prognostic value of IS should pave the way for it use in clinical practice.
- immunology
- image analysis
- oncology
This is an open access article distributed in accordance with the Creative Commons Attribution Non Commercial (CC BY-NC 4.0) license, which permits others to distribute, remix, adapt, build upon this work non-commercially, and license their derivative works on different terms, provided the original work is properly cited, appropriate credit is given, any changes made indicated, and the use is non-commercial. See http://creativecommons.org/licenses/by-nc/4.0/.
Statistics from Altmetric.com
Introduction
Colorectal cancer represents one of the most commonly diagnosed cancers worldwide.1 Estimation of prognosis and decision on the treatment of patients are based on features of tumor extension (the Union for International Cancer Control (UICC) tumor-node-metastasis (TNM) classification) and tumor-cells differentiation.2 3 However, clinical outcome can significantly vary among patients within the same tumor stage and the TNM classification alone does not predict response to therapy.4 Given these limitations, much effort has been devoted to the identification of tumor cell-based biomarkers, mutational status, molecular pathway and tumor gene expression-based stratification approaches to further refine risk estimation.4–7 However, only a few of these factors have been validated as robust independent prognostic markers for care of patients with colon cancer.5 6 Novel insights into the molecular biology of colon cancer have enabled new therapeutics to be developed, but new biomarkers of high prognostic or predictive value are still needed to select the most optimal adjuvant management strategies.8
There is evidence that anticancer immune responses contribute to the control of tumor growth and metastasis.9–11 The cytotoxic adaptive immune response has been almost consistently associated with a favorable prognostic in solid tumors.12 We previously showed that in situ adaptive immune reaction in the tumor core (CT) and its invasive margin (IM) strongly correlates with time to recurrence (TTR), disease-free survival (DFS) and overall survival (OS),13–15 regardless of cancer stage.13 Digital pathology leveraging automated image analysis has been suggested as a potential standardization method to improve the accuracy and reproducibility of the immune cells quantification.16 17 Consequently, we developed a prognostic immune scoring system, termed Immunoscore (IS), that quantitates both CD3+ lymphocytes and CD8+ cytotoxic T cells in the CT and IM. The prognostic performance of IS has been validated through an international pivotal validation study of 3539 patients with stage I–III colon cancer.18
However, additional sources of variability related to sample preparation or immunostaining technique must also be controlled, that is, lot-to-lot variability of critical reagents such as primary antibodies, the choice of tumor block among those potentially eligible, the reproducibility of the sectioning process or external factors such as age of the paraffin block and storage conditions.19 20 The demonstration of the analytical performance characteristics (IS robustness according to the parameters mentioned above and an intralaboratories and interlaboratories reproducibility) are necessary for implementation of the IS into clinical practice.
In this study, we describe the development of the IS, validate its analytical performance and examine its prognostic value compared with tumor biomarkers.
Material and methods
Patients and specimens
The prognostic value of the IS was assessed in the French cohort of patients with stages I–III colon cancer included in the international validation study of the IS between 1989 and 2009 (n=538)18 and in a French cohort of patients with stage I-III colon cancer from 2 studies : the Immunoscore as a prognostic marker for patients with a colorectal cancer (ImmuCol) and personalizing medecine of colorectal cancer (ImmuCol2), between 2012 and 2016 (n=57; NCT02274753, NCT01688232). Samples were excluded if the patient did not meet the inclusion criteria (clinical quality control: rectal cancer, Tis/Tx tumor, metastatic cancer, neoadjuvant chemotherapy, missing mortality or recurrence status).18 Histopathological and clinical findings of these datasets were scored according to the eighth UICC-TNM staging system.21 Formalin-fixed paraffin-embedded (FFPE) surgical tissues from the colon cancers were collected and used for the IS analyses.
A second cohort of patients with stage I–III colon cancer (n=100) treated in the Department of Surgical Oncology of the Regional Institute of Oncology (Iaşi, Romania) was used to assess the between-lab agreement for the immune cell densities and IS levels.
The analytical precision elements of this study were determined using 13 anonymous FFPE colon cancer blocks (Indivumed, Hamburg, Germany and ProteoGenex Culver City, California, USA).
Clinical outcomes
The primary outcome was TTR defined as time from surgery to disease recurrence. Secondary outcomes were DFS defined as the time from surgery to the first observation of disease recurrent or death due to any cause, and OS defined as time from surgery to death due to any cause.
Immunohistochemistry
FFPE surgical tissue specimens were used for the immunohistochemical analyses. H&E staining confirmed the presence of both adenocarcinoma tissue and normal tissue and the evidence of immunity cells infiltration in the CT and its IM. Two adjacent tissue 4 µm sections were cut from the FFPE tissue blocks and processed for immunochemistry. Primary antibodies were directed against CD3+ (2GV6, Ventana, Tuscon, Arizona, USA) and CD8+ (C8/144B, Dako, Glostrup, Denmark) and were visualized by Ultraview Universal DAB IHC Detection Kit (Ventana) in center 1 (Laboratory of Immunology, AP-HP, European Hospital Georges Pompidou, Paris, France). In center 2 (HalioDx, Marseille, France), sections were immunostained with antihuman CD3+ (clone HDx2, HalioDx) and antihuman CD8+ (clone HDx1, HalioDx) monoclonal antibodies revealed according to the CE-IVD Immunoscore Kit Instructions (HalioDx).
Digitization of immunostained sections and quantification of immune cells
In center 1, slides were digitized on the NanoZoomer HT scanner (Hamamatsu Photonics, Japan) with the ×20 magnification and 0.45 µm/pixel resolution. A customized IS module integrated into Developer XD digital pathology software (Definiens, Munich, Germany) was used to quantify CD3+ and CD8+ T cells in the CT and IM, divided in tiles (720 µm per side). In center 2, the NanoZoomer XR scanner (Hamamatsu Photonics) was used, with the identical setting. An upgraded version of the IS module (Immunoscore Analyzer, HalioDx) was used to quantify CD3+ and CD8+ cells. In both centers, the mean and distribution of the intensity of stained cells were used as internal quality controls of each immunostaining. Automatic tissue detection (tumor, healthy non-epithelial tissue and epithelium) and IM defined as a region of 720 µm width; 360 µm on each side of the border between malignant cells and peritumoral stroma were generated automatically. If required, automated detection of the CT region was manually corrected and validated by a pathologist.
Immunoscore determination
For each case, CD3+ and CD8+ cell densities in the CT and its IM were compared with those obtained in the training and internal validation sets of the international validation study cohort18 and converted into percentiles. The mean of the 4 percentiles obtained for CD3+ and CD8+, either in the CT or IM, was then calculated and converted into an IS. The IS was categorized into three groups, with a mean percentile of 0%–25% (IS0–1), >25%–70% (IS2) and >70%–100% (IS3–4). IS were further categorized into IS Low (IS0-1) and IS High (IS2-3-4) (figure 1G).
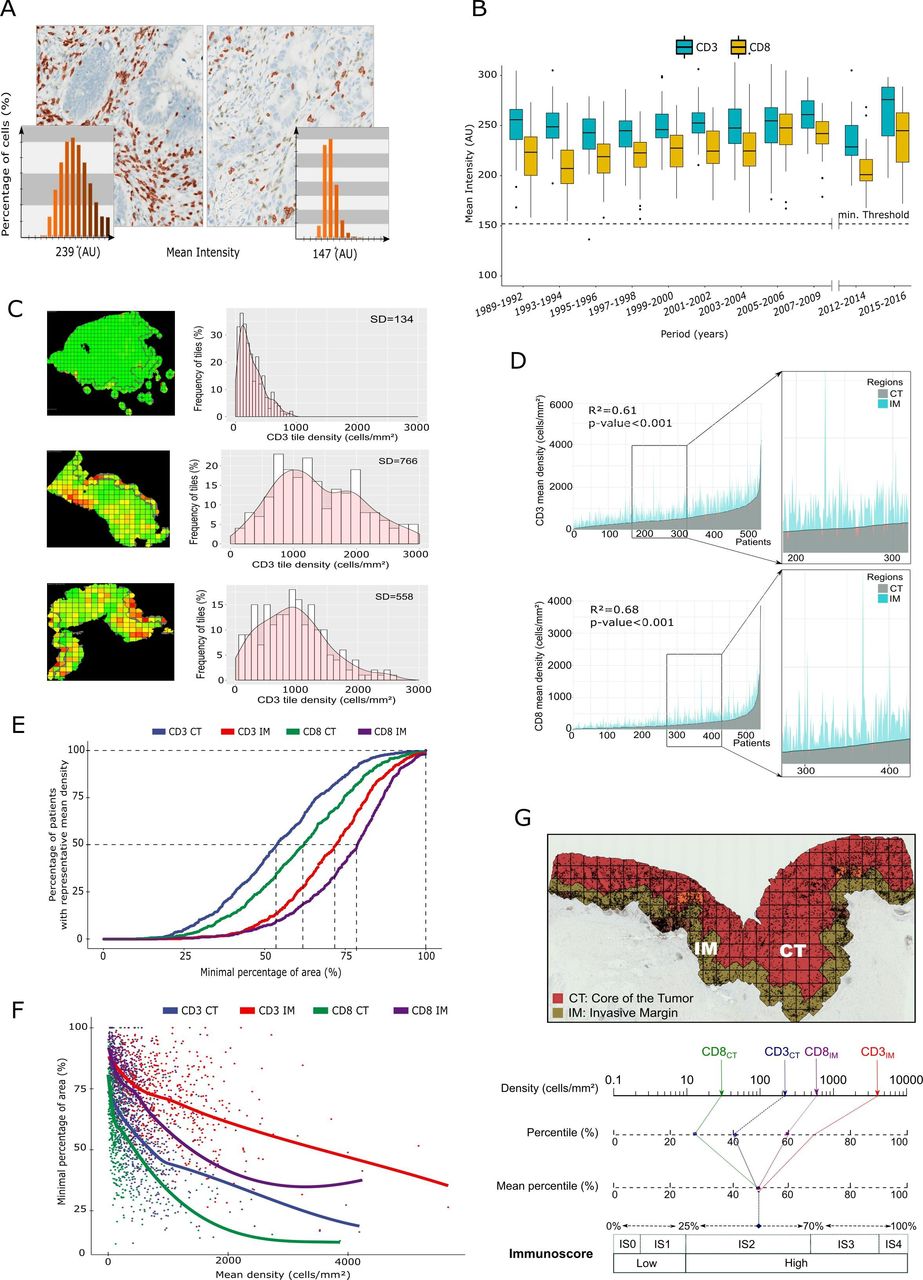
Immunoscore (IS) determination. (A) Representative digital pathology image of strong CD3+ T cells immunostaining (left). Histogram of CD3+ cells intensities detected by the software (mean intensity of 239 AU; bottom left). Example of weak CD3+ immunostaining, which leads to underestimation of cell counts by the software as shown by the absence of red outline around some immunostained cells (right). Histogram of the CD3+ cells intensities detected by the software (mean intensity of 147 AU; bottom right). (B) The effect of sample storage time on immunostaining performance. Box plots showing the IQR of the CD3+ and CD8+ staining intensities in colon cancer samples (n=595) according to the age of tumor blocks (between 1989 and 2016). The dashed line represents the 152 AU mean intensity threshold. (C) Heterogeneity of CD3+ T-cell infiltration in three colon cancer tumor samples. The tumor core (CT) and invasive margin (IM) regions are divided into tiles with the density of CD3+ T cells in each tile figured from green (lowest density) to red (highest density) (left). Unimodal distribution of CD3+ T cells with a weak and homogeneous immune infiltration (right, upper graph). Bimodal distribution with a heterogeneous immune T-cells infiltration (middle graph). Multimodal distribution with an intermediate and heterogeneous immune cell infiltration (lower graph). SDs of the immune cells densities in tiles are indicated. (D) Comparison of the CD3+ or CD8+ T cells mean densities in the CT (gray) and in IM (blue) for each patient of the cohort (n=538). Patients are ordered by an increasing immune cells density in the CT region. Spearman’s correlations with R² for CT vs IM are provided for each marker. (E) Minimum area (%) required for each marker (CD3+ and CD8+), in each region (CT and IM), which allows to estimate immune cells density equal to the whole region (±10%) in all patients (n=538). (F) Impact of immune cells density (CD3+ and CD8+) in each region of interest (CT and IM) on the minimum surface necessary to estimate immune cell density equal to the whole region (±10%). (G) Calculation of the clinical assay IS groupings. Chart illustrating the IS calculation method. Densities of CD3+ CT, CD3+ IM, CD8+ CT and CD8+ IM converted into percentile values, determined by the international validation study.18 The mean percentile of the four markers is calculated and translated into a five-category (IS0, IS1, IS2, IS3, IS4) or a two-category scoring system IS Low and IS High.
All analyses were performed in center 1 except experiments reported in figure 2B,E and supplementary tables,performed in center 2.
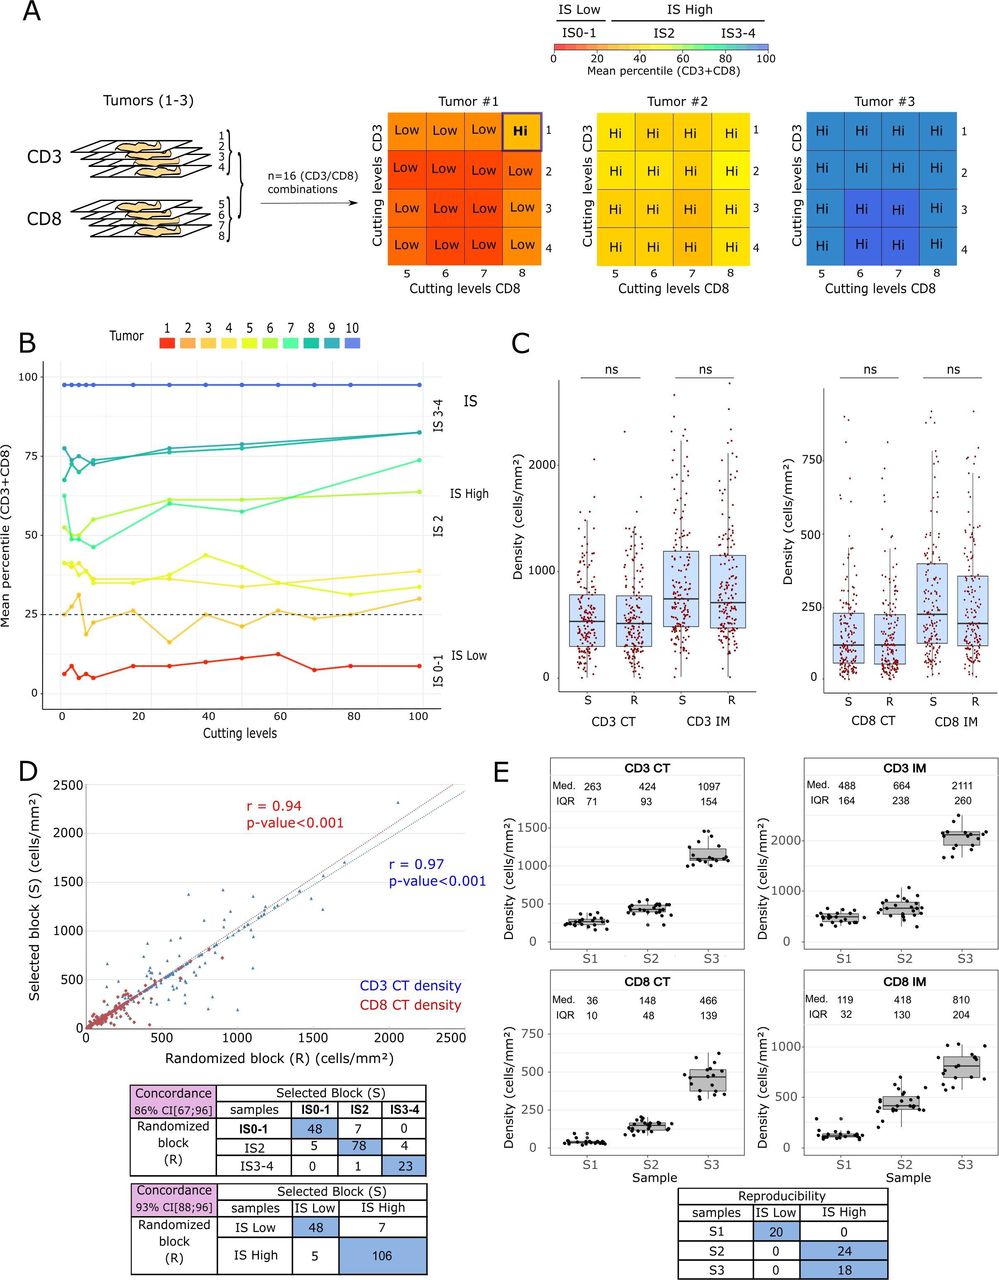
18Analytical performance of the Immunoscore (IS). (A) Sample repeatability: assay stability in serial tumor sections. Impact of the selected sections on IS on three colon cancer samples according to the cutting level of the tumor block. For each tumor, four adjacent sections were immunostained for CD3+ followed by four adjacent sections immunostained for CD8+. All CD3+/CD8+ combination slides were tested per tumor. The concordance matrix shows the mean percentile (from red to blue; 0–100) of each combination (CD3+/CD8+) and the associated IS category. (B) Mean percentile (CD3+ and CD8+) and the IS variations according to the cutting level of the tumor block from top to bottom. A total of 13 levels (1, 3, 5, 7, 9, 20, 30, 40, 50, 60, 70, 80, 99) of cutting from 100 adjacent cuts of each tumor block (n=10) were investigated for IS. (C) Intermediate precision: impact of tumor blocks selection on the IS. Box plots show the IQR of CD3+ and CD8+ immune densities from the tumor block selected by the pathologist (S) and from a random block (R) for each patient of the cohort (n=166). Paired t-tests were calculated to assess differences between groups. (D) Pearson’s correlation with r between densities in the randomized block and selected block for the CD3+ CT (blue) and CD8+ CT (red) (top). Contingency tables show the IS categories obtained for each case with the selected and random block (bottom). (E) IS assay precision and lot-to-lot reproducibility. Tumor cut from three colon cancers were assessed for CD3+ and CD8+ T cells densities using three different antibody lots, three DAB revelation kit lots, two Benchmark autostainers, three different runs and three operators. Contingency tables showing the IS classification concordance for each sample (bottom). CT, core of the tumor; IM, invasive margin.
Statistics
The hierarchical clustering method was used to explore the relation between clinical (age, perforation), pathological (T stage, N stage, vascular, lymphatic or perinervous tumor emboli, number of lymph nodes) and molecular characteristics (KRAS, APC, P53, PI3K, BRAF, microsatellite instability (MSI) status) of the tumors and the IS.22 An age threshold of 70 years and a lymph nodes threshold of 12 were used. Data of each patient were scaled to mean 0 and an SD of 1. Manhattan distance was used to compute the dissimilarity for hierarchical clustering.
Based on the Clinical and Laboratory Standards Institute EP05-A3 guidelines, the analytical precision statistics were compared using analysis of variance (ANOVA) for the repeatability and an ANOVA test (Variance Component Analysis model) for the assay intermediate precision were used to assess the percentage contribution of source of variation (for each component and measurement) to the total variability. Similarly, intrablock repeatability of IS on all 10 samples was assessed using a mixed model (REML mixed model from R VCA package) in order to assess the variation expected in results when considering intrablock as part of the model. A bandwidth of 1.96*error was then calculated.
The relative proportion of explained variance (Cox & Snell pseudo R²) in TTR, which was accounted by different categories of predictor covariates, was calculated. The full multivariate model was initiated and each time one predictor was removed from the model, the differences of pseudo R² were computed, then the proportion of each predictor covariate was obtained. Covariates were sequentially removed from the model by decreasing importance. For this analysis, molecular markers with missing values were excluded and the multivariate Cox model was built with eight parameters used to describe the severity of colon cancer. Figures and statistical analyses were performed using the R software (V.3.3.1). To assess the agreement between automatic and manual T-cells counts, intraclass correlation coefficient was calculated using the psych-package. The Bland-Altman plots were generated with their limits of agreement, defined as the mean of the differences±1.96 SD above and below the mean difference (known as the bias). Pearson’s and Spearman’s correlations were applied to calculate the r and R², respectively. The log-rank T-test and log-rank test for trend were applied to calculate p values. The p values lower than 0.05 were considered statistically significant. The ggplot2 package and survival package were used to model the hierarchical clustering and calculate the relative proportion of explained variance (Cox & Snell pseudo R²).
Kaplan-Meier method estimates of survival were used to illustrate the survival curves, and survival was measured in months from the resection to either recurrence or the last review.
Results
Analytical validation of the IS
To monitor the variability of the CD3+ and CD8+ T cells immunostaining intensity across samples, an internal control was established to ensure the validity of the counting by the software. Illustrations of an adequate staining intensity (mean intensity of 239 AU) for CD3+ T cells allowing a valid count of cells and a faint staining (mean intensity of 147 AU) leading to an underestimation of the number of stained cells are shown in figure 1A. A minimum value of 152 AU for the mean intensity of all stained cells detected by the software, ensured a detection of at least 70% of the stained cells,18 and was defined as acceptance criterion.
The influence of the tumor block age on the intensity of staining was tested on tissue samples from a retrospective monocentric cohort of 595 patients with colon cancer treated between 1989 and 2016. Fixation time, concentration of the formalin and storage environment remained constant throughout this period of time. Sample stability for CD3 and CD8 detection was maintained over a period of 30 years as shown by the intensity of stained cells above a given intensity threshold (figure 1B).
Accuracy of an automated method for counting stained CD3+ and CD8+ T cells
The accuracy of the automated IS workflow was established by counting CD3+ and CD8+ T cells manually or with a dedicated software program in 50 tiles randomly selected from immunostaining (online supplementary figure S1). Optical and automatic counts of stained cells for CD3+ or CD8+ in all the tiles (ranging between 50 and 2000 cells per tile) were strongly correlated (r=0.94, p<0.001 and r=0.92, p<0.001, respectively). This result was confirmed with intraclass correlation coefficient of 0.90 for CD3+ (95% CI 0.81 to 0.94) and of 0.91 for CD8+ (95% CI 0.85 to 0.95). The Bland-Altman plots showed a strong agreement between the two counting methods. Differences observed above 800 cells/tile of 720 µm side were probably due to the difficulty of optical estimation at very high cell densities (online supplementary figure S1).
Supplemental material
Evaluation of the stained cells quantification accuracy by the IS automated workflow vs. optical count (reference method). Bland–Altman plots of agreement between optical and automatic counts by the dedicated IS module implemented into the Developer XD software (Definiens, Germany) for 50 random tiles of colon cancer stained for CD3+ (left) and for CD8+ (right) are shown. Pearson correlation curves between counting methods are also presented.Assessment of the CD3+ and CD8+ T-cells distribution across tumors and definition of the IS
The distribution of CD3+ and CD8+ T cells in the CT and its IM was also assessed in tumor samples from the cohort of 538 patients with stage I–III colon cancer tumors. Unimodal, bimodal or multimodal distribution of immune cells densities were observed, as illustrated for the CD3+ densities (figure 1C). An average SD of 505 cells/mm² (from 7 cells/mm² to 1781 cells/mm²) for CD3+ T cells and 199 cells/mm² (7 cells/mm² to 1257 cells/mm²) for CD8+ T cells across the tiles defined in all tumor sections illustrated immune infiltrate heterogeneity (data not shown). In addition, for each marker, immune cells densities in the CT and its IM were only weakly correlated (figure 1D), where patients (n=538) were ordered by increasing cell density of CD3+ T cells in the CT (R² for CT vs IM of 0.61 for CD3+ and of 0.68 for CD8+, p<0.001).
Investigation of 55%–78% of the total area of each region was necessary to obtain a reliable estimation of CD3+ or CD8+ mean densities for 50% of the patient cohort (figure 1E). These percentages of total area presented a surface of 40.9 and 48.3 mm² in CT and 14.7 and 15.4 mm² in IM for CD3 and CD8 markers, respectively (online supplementary figure S2). The minimum area to be analyzed was larger when the immune infiltration for the marker of interest was low (figure 1F) and this effect was more pronounced in the CT than in the IM region.
Supplemental material
Minimum surface (mm²) required for each marker (CD3+ and CD8+). Boxplots showing minimum area (mm²) required for each marker (CD3+ and CD8+), in each region (CT and IM) to estimate immune cells density equal to the whole region (+/- 10%) for each patient (n=538).Based on these results, the CD3+ and CD8+ immune T-cells densities were calculated on the entire regions (CT, IM) in order to build the IS scoring system (figure 1G). Densities of CD3+ and CD8+ cells in the CT and IM regions were converted into percentiles values according to a reference cohort of 700 patients with colon cancer from 13 countries, provided by the Society for Immunotherapy of Cancer validation study.18 For each patient, the mean of the four percentiles (CD3+ CT, CD3+ IM, CD8+ CT, CD8+ IM) was translated into five categories, which were further collapsed into two groups as described in the ‘Materials and methods’ section.
Intratumor and intertumor tissue block precision of the IS
Repeatability of the IS was explored between adjacent slides from three tumor tissue blocks with low or high immune infiltration (figure 2A). For each block, adjacent sections were stained for CD3+ T cells (four slides) and CD8+ T cells (four slides), which allowed for 16 CD3+/CD8+ IS combinations. Variation of the mean percentile for the 16 combinations was low, with an SD of 5.4%, 4.3% and 0.91% per tumor tissue block (data not shown). Overall concordance of the IS testing between the tumor tissue blocks was 98%. A shift from one to another IS category was not observed for any of the CD3+/CD8+ combinations for the high IS blocks. Only a one level IS change among 16 combinations was observed for tumor #1 (IS Low), whose mean percentile was close to the 25% cut-off between low and High IS.
Since two adjacent sections of 4 µm represented <1% of the total thickness of a typical tumor block, it was therefore important to ensure that the IS testing was robust to tumor heterogeneity. We examined the interassay repeatability by testing distant sections from the same tissue blocks. The experiment was conducted on 10 different tumors covering the analytical range of the IS and was inclusive of tissues near the IS cut-off. The IS was evaluated on 13 levels distributed from cut 1 to cut 100 (adjacent slides from cut levels 1, 3, 5, 7, 9, 20, 30, 40, 50, 60, 70, 80, 99) from each tissue block (figure 2B). A low variability of the mean percentile (CD3+ and CD8+) was observed across the sections for all tumors. The global intrablock repeatability SD for the 10 samples studied on the set of 13 levels was of ±8 percentiles. Overall, precision remained high, with IS group concordance at 95%. Shifts from one to another IS category were observed for blocks with mean percentile very close to the cut point between two categories.
In clinical practice, there are sometimes multiple tumor blocks available for the same patient tumor(s). The differences in immune cells densities and IS between a block selected by a pathologist and a block randomly selected among all eligible blocks was determined for 166 patients with colon cancer included in the international validation cohort (figure 2C). No significant differences between tumor blocks (random vs selected) were observed neither immune marker nor tumor regions (CT; IM) as assessed by paired t-tests. The intertumor tissue block correlation based on Pearson’s correlation coefficient (r) was 0.94 for CD3+, and 0.97 for CD8+ T cells (p<0.001). The interassay repeatability between selected and randomized tumor tissue blocks was 93% (figure 2D).
Robustness of the IS
Further intermediate precision, lot-to-lot reproducibility and intra-assay repeatability were assessed in six immunostaining runs with two Benchmark XT autostainers, three CD3+ and three CD8+ antibody lots, three DAB revelation kit lots and three operators. The IQRs of CD3+ and CD8+ immune densities in the CT and IM are illustrated in figure 2E. The intra-assay repeatability was assessed for each sample from duplicates (two adjacent slides). For each duplicate, the difference of densities and mean percentile was calculated and is reported in online supplementary table S1. Overall, the SD of repeatability (Sr) was 90.66 cells/mm² for the densities and 3.92% for the mean percentile, thus highlighting the high level of intra-assay repeatability in the IS readout.
Supplemental material
Evaluation of the Immunoscore inter-assay repeatability. Adjacent sections from three samples (S1, S2, S3) were cut to assess the densities of CD3+ and CD8+ T-cells (N1=44; N2=48; N3=36, respectively) and mean percentile of the IS. Quantifications obtained on adjacent slides for each staining were considered as duplicates. The contribution of one component (antibodies lots, instrument, revelation DAB kit lots, runs, or operators) was assessed between each duplicate for each sample. Differences of T-cells density (cells/mm²) or mean percentile (%) between two adjacent slides (duplicate) were calculated. Mean, standard deviation (SD), relative standard deviation (RSD), median, minimum, maximum, and the repeatability standard deviation (Sr) were assessed.To resolve the total variability of the IS workflow into different components, the general and lot-to-lot reproducibility studies were performed and analyzed with a mixed effects ANOVA-Variance Component Analysis model on mean percentiles (online supplementary table S2). None of the individual components significantly contributed to IS variability. Furthermore, the categorical IS concordance was 100% among the three tested tumors (figure 2E).
Supplemental material
Evaluation of the Immunoscore reproducibility. Adjacent sections from 3 samples (S1, S2, S3) were cut to assess mean percentile of the IS (N1=20; N2=24; N3=18, respectively). Contributions of variability of five components were performed with the ANOVA-Variance Component Analysis model by estimating variations between CD3+ and CD8+ antibodies lots (AB lots), instruments (Instr.), revelation DAB kit lots (Rev.), runs, and operators (OP.). Standard deviation (SD) and relative standard deviation (RSD) of mean percentile were calculated.Impact of interlaboratory reproducibility on the IS
The assessment of IS reproducibility was performed in two laboratories; each laboratory had its own IS workflow including staining, scanning and analysis. Non-consecutive cutting levels from the same tumor block were used to assess the IS of 100 cases from Iaşi Hospital. The interlaboratory mean percentiles (CD3+ and CD8+) correlation was 0.94 (p<0.001) and the categorical IS concordance between the two centers was 93% (online supplementary figure S3).
Supplemental material
Inter-laboratory validation of the Immunoscore. Pearson correlation with r for mean percentiles (CD3+/CD8+) between two centers with the same number of cases (n=100) analyzed is shown. Inlay: contingency table showing the concordance of IS categories obtained for each case between two centers.Prognostic validation of the IS
The singularity of the IS with respect to the clinical and molecular parameters of severity commonly used in clinical practice was first tested on the cohort of 538 patients with stage I–III colon cancer (figure 3A). Hierarchical clustering of the covariate relationships (Manhattan distance) showed that MSI status and the number of tumor-invaded lymph nodes were clustered together. KRAS, APC and p53 were clustered together away from PI3K and BRAF genes. Interestingly, the IS was dissimilar to the other clusters in the hierarchical clustering. To examine the relative contribution of the IS to patient recurrence risk, ring charts were generated in order to illustrate the relative proportion of explained variance of the IS with the other risk parameter to recurrence (TTR predictor) in the cohort of 229 patients with stage II–III colon cancer (figure 3B). The IS outperformed other clinical parameters of severity such as T stage, N stage and MSI status. The relative proportion of variance for TTR explained by IS, T stage, N stage and MSI status was 53%, 20%, 10%, 8% and 7%, respectively for patients with stage II–III colon cancer (n=229). In patients with localized stages II colon cancer (n=141), this observation persisted. Significant difference of TTR among patient’s groups, stratified by IS were observed (online supplementary figure S4A,B). HR forest plots for TTR, DFS and OS according to the IS in patients with stage II (n=292) and stage II–III (n=448) colon cancer are provided in online supplementary figure S4C. In patients with stage II or stage II–III colon cancer, an IS High was associated with the lowest risk of relapse (TTR; all log-rank tests p<0.05). For example, 5 years TTR was 87.9%, 77.1% and 57.0% for IS3–4, IS2 and IS0–1, respectively in patients with stage II–III colon cancer.
Supplemental material
Evaluation of the Immunoscore as a prognostic biomarker. Kaplan Meier curves for time to recurrence (TTR) according to IS (IS 0-1, IS 2, and IS 3-4) in 448 patients with stage II-III colon cancer (A) and in 292 patients with stage II colon cancer (B). P-value was assessed by the log-rank test for trend. Hazard ratio forest plots for TTR, disease-free survival (DFS), and overall survival (OS) according to the IS in stage II-III and stage II colon cancer patients (C). The P-value was assessed with the t-test log-rank (P) or the log-rank test for trend (P*).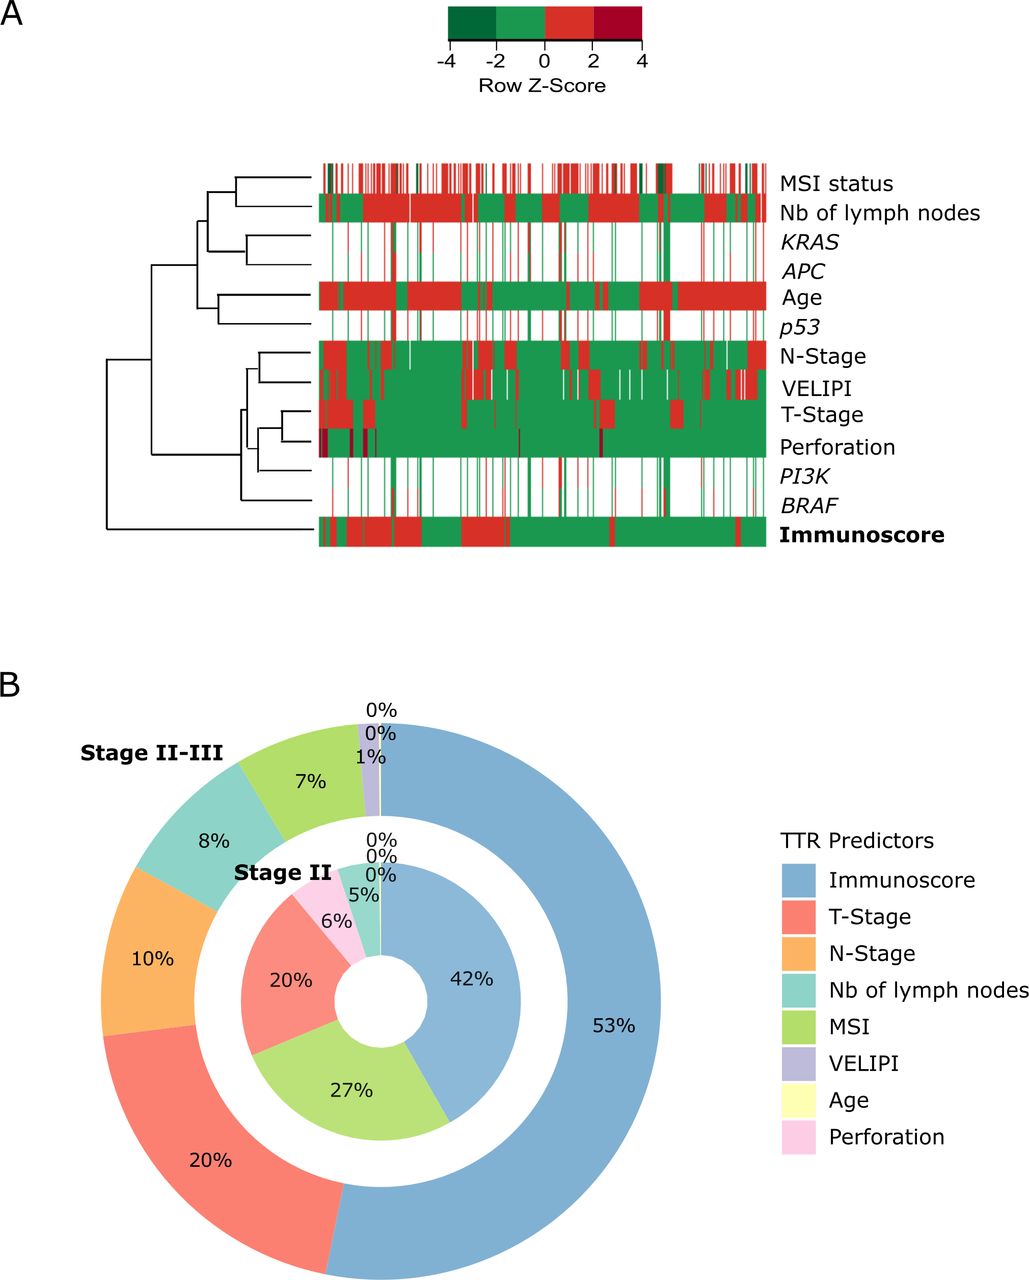
Relative prognostic contribution of clinicopathological and molecular factors. (A) Unsupervised hierarchical clustering testing the similarity between Immunoscore (IS) and clinical and biological parameters of severity (n=12) in patients with stage I–III colon cancer (n=538). Each parameter is in ordinal value and the normalized z-scores are shown in the heat map. Beneficial (green) and adverse (red) parameters are represented. Missing values are indicated (white). Manhattan distance was used to compute the similarity for the hierarchical clustering. (B) Ring charts illustrating the relative proportion of explained variance (Cox & Snell pseudo R²) of each risk parameter to recurrence risk in patients with stage II–III (n=229) and stage II colon cancer (n=141). TTR, time to recurrence.
Discussion
Polymorphic and variable immune infiltrates composed of almost all types of immune cells are observed between solid tumors. The different immune cell subsets are associated with variable prognostic significance, sometimes with opposite direction.12 The in situ immune ‘picture’ in the tumor is therefore complex. An integrative analysis of immune populations infiltrating colon cancer has recently shown the major influence of particular subsets, for example, Th1-oriented immune cells and cytotoxic T lymphocytes for long-term survival of patients.13 15 The positive impact of the tumor infiltrating lymphocytes on survival of patients with colorectal cancer, independent of criteria of tumor extension, was already observed in 1986 by Jass.23 Thirty years after, a comprehensive immune assessment has not yet been integrated into our clinical practice probably due to the interobserver variability between pathologists and a lack of standardization in methodology.17 24
We have recently implemented the consensus IS as a test to predict clinical outcome in patients with stage I–III colon cancer.18 The procedures and strategies of quantification of the IS (ie, CD3+ and CD8+ quantification in the CT and its IM) were defined by an international consortium.18 CD3+ and CD8+ markers were selected based on their associated staining quality, and respective non-redundant prognostic contributions.13 15 25 It was previously shown that the combined analysis of tumor regions (CT plus IM) improves the accuracy of prediction of survival for the different patient groups compared with single-region analysis.15 We have refined those observations here by demonstrating that the cell densities must be assessed on whole regions (CT and its IM) to more accurately measure the mean density of the total region of interest, as well as ensure reproducibility between laboratories. Therefore, the IS test is performed on whole regions (CT and IM). Several the FFPE tumor tissue blocks are often eligible for evaluation of the IS and a wide range of cutting levels can also be achieved within the same block. This raises the question whether the IS is impacted by tumor heterogeneity and FFPE block bias. Here, we showed that the CD3+ and CD8+ cell densities and the average percentiles remain remarkably constant across a wide range of cutting levels within the same block or between blocks. Moreover, the IS categorization into two classes further increases the concordance between multiple measurements. Overall, the IS intra-assay and interassay agreement was 95% and 90%, respectively. In patients close to the cut point, results can be provided as IS category and also as mean percentile. A graphic showing for each mean percentile (ie, IS as a continuous variable) the survival prediction at 3 and 5 years could ultimately help clinician to have the most accurate prognostic evaluation to guide therapeutic decision.
None of the technical components of the IS assay, including antibodies, revelation DAB kit lots, instruments and operators significantly contributed to variability in CD3 and CD8 immunostaining nor IS classification, consistent with previous analyses. We had already observed a very good homogeneity of the IS categorization assessed by different observers evaluating the same CD3+ and CD8+ immunostainings.18 IS reproducibility was determined by comparison of 36 images of colon cancer sections stained for CD3+ and CD8+, which were re-analyzed by eight pathologists from different centers, and this procedure demonstrated a small variation (2.1%) in the mean percentile of CD3+ and CD8+ T-cell densities between observers.18 Comparison of the IS categorization on non-consecutive cutting levels in terms of homogeneity in our study showed again very high agreement (93%) between two centers performing the staining, scanning and analysis with their own instrument workflows. In a separate validation analysis, the IS emerged as an independent prognostic parameter in our study. As such, it can provide new information on the host’s defense against the tumor, which is the essential puzzle piece into immunotherapy success. This observation is in line with the recent results of the international validation study of the IS in 3539 patients with stage I–III colon cancer.18
Conclusion
This study details the analytical performance characteristics of the IS, measuring the immune response to cancer and improving the estimation of risk of recurrence for patients with colon cancer. The analyses showed that the IS scoring system is a robust, reproducible, quantitative and standardized immune assay, with a high prognostic performance, independent of the prognostic markers currently used in clinical practice. This paves the way for the use of the IS test in clinical practice in colonic tumors and probably in the near future in other solid tumors.
Supplemental material
Acknowledgments
The authors would like to thank Magdalena Benetkiewicz (PhD) for reviewing/editing assistance.
References
Footnotes
Contributors FP, JG, JF had full access to the study data and take responsibility for the integrity of the data and accuracy of the data analysis. Study concept and design: FP, JG, FH, JF. Statistical analysis: AK, XC, LB, TS. Acquisition, analysis or interpretation of data: all authors. Critical revision of the manuscript for important intellectual content: all authors. Obtained funding: FP, JG. Administrative, technical or material support: FM, NH-A, MVdE, M-GA, A-MM, VS, CL-P. Drafting of the manuscript: FM, FP, JF.
Funding The work was supported by grants from National Institute of Health and Medical Research (INSERM), LabEx Immuno-oncology, Transcan ERAnet European project, Association pour la Recherche contre le Cancer, CARPEM, AP-HP (IMMUCOL1 and IMMUCOL2), INCA translationnel, and Paris Descartes University.
Competing interests JG and FP have patents associated with the immune prognostic biomarkers. JG and FH are HalioDx co-founders and shareholders. All other authors declare no competing interests. The IS is a registered trademark owned by the National Institute of Health and Medical Research.
Patient consent for publication Not required.
Ethics approval The study was conducted in accordance with the protocol, good clinical practice standards and the Declaration of Helsinki and was approved by the local ethics committee (2009- A00707-50, 2015/13915, 2012/02NICB, 2014/50NICB).
Provenance and peer review Not commissioned; externally peer reviewed.
Data availability statement The datasets used and/or analyzed during the current study are available from the corresponding author on reasonable request