Article Text

Abstract
Background Cancer immunotherapy research is expanding to include a more robust understanding of the mechanisms of treatment response and resistance. Identification of drivers of pro-tumor and anti-tumor immunity during treatment offers new strategies for effective alternative or combination immunotherapies. Currently, tissue or blood samples are collected and analyzed, then dichotomized based on clinical end points that may occur months or years after tissue is collected. While overall survival is ultimately the desired clinical outcome, this dichotomization fails to incorporate the nuances that may occur during an anti-tumor response. By failing to directly measure immune activation at the time of sampling, tumors may be misclassified and potentially obscure important biological information. Non-invasive techniques, such as positron emission tomography (PET), allow for global and quantitative measurements of cancer specific processes and are widely used clinically to help manage disease.
Methods We have previously developed a novel PET agent that can non-invasively quantify granzyme B release in tumors and have demonstrated its ability to predict response to checkpoint inhibitor therapy in multiple murine models of cancer. Here, we used the quantitative measurement of granzyme B release as a direct and time-matched marker of immune cell activation in order to determine immune cell types and cytokines that correlate with effective checkpoint inhibitor therapy in both tumors and tumor-draining lymph nodes.
Results Through PET imaging, we were able to successfully distinguish distinct microenvironments, based on tumor type, which influenced immune cell subpopulations and cytokine release. Although each tumor was marked by functionally distinct pathways of immune cell activation and inflammation, they also shared commonalities that ultimately resulted in granzyme B release and tumor killing.
Conclusions These results suggest that discrete tumor immune microenvironments can be identified in both responsive and non-responsive tumors and offers strategic targets for intervention to overcome checkpoint inhibitor resistance.
- PET, functional imaging
- PET
- PET, ligand studies
This is an open access article distributed in accordance with the Creative Commons Attribution Non Commercial (CC BY-NC 4.0) license, which permits others to distribute, remix, adapt, build upon this work non-commercially, and license their derivative works on different terms, provided the original work is properly cited, appropriate credit is given, any changes made indicated, and the use is non-commercial. See http://creativecommons.org/licenses/by-nc/4.0/.
Statistics from Altmetric.com
Background
The widespread utilization of programmed cell death protein-1 (PD-1), programmed death ligand-1 (PD-L1) and cytotoxic T-lymphocyte antigen-4 (CTLA-4) therapeutic monoclonal antibodies in a variety of solid cancers has accelerated the need to understand the drivers of response and resistance to these therapies. Checkpoint blockade, unlike many targeted therapies and chemotherapy, presents challenges in assessing early tumor response by standard clinical techniques.1 While some tumors may shrink or progress rapidly in accordance with response, a large number of tumors will have an atypical benefit and remain relatively stable in size for extended periods of time.2 Additionally, a small number of tumors will progress in size before ultimately responding to immunotherapy, undergoing pseudo progression.3 Advanced strategies examining spatial organization, tumor and immune cell transcriptomes and cell populations have identified potential mechanisms of therapeutic efficacy; however, they are limited by their inability to accurately quantify functional response at the time of tissue sampling.4–6 Thus, the real-time status of the active anti-tumor immune response remains unknown. Since immune activation is not known at the time of biopsy, tissue-based sampling is currently dichotomized into responders and non-responders based on long-term measures that may not accurately reflect the status of the tumor microenvironment at the time of sampling. Such dichotomous division into response and non-response discards important variables, including the magnitude and timing of the immune response.7–9 Taken together, the loss of this functional information is likely to obscure many important immunological aspects necessary for effective therapy.
Rather than classifying tumors based on long-term outcomes alone, measuring real-time immune activation would provide a more accurate representation of response for advanced tissue sampling techniques. We previously developed a positron emission tomography (PET) imaging agent (GZP) that can non-invasively detect and quantify granzyme B, a protease released by activated immune cells that is involved in target cell killing.10 We demonstrated its utility in predicting response to PD-1 and CTLA-4 blockade in multiple tumor models and have shown that granzyme B release is higher in responding human melanoma tumors.7 Based on the efficacy of GZP PET to predict response to immunotherapy, it was hypothesized that combining it with tissue-based analyses such as flow cytometry and cytokine quantification, would be able to elucidate factors correlated with response that would not be identified based on dichotomous stratification. Two well-characterized murine colon carcinoma cell lines, MC38 and CT26, were used to investigate the correlation between functional PET measurements of immunotherapy response and tissue-based immunological characterization.11 Tumors were imaged at multiple time points and GZP PET signal was compared with effector and regulatory T-cell (Tregs) phenotypes, along with antigen-presenting cells (APCs). Furthermore, important cytokines and chemokines were also measured to provide a more complete picture of immune signaling correlated with granzyme B release. These results identified distinct tumor microenvironments associated with immune cell activation for each of the tumor types, and more importantly, identified targets with the potential to overcome resistance to immunotherapy that would not have been identified by dichotomizing based on treatment.
Methods
Cell culture
CT26 cells, generated from BALB/c undifferentiated colon carcinoma, were purchased from ATCC and cultured in RPMI supplemented with 10% fetal bovine serum (FBS) and 1 mM L-glutamine. MC38 cells derived from C57BL6 murine colon adenocarcinoma cells were purchased from Kerafast and maintained in Dulbecco's Modified Eagle Medium with 10% FBS and 1 mM L-glutamine. Cells were tested for mycoplasma by PCR method and were used within 6 months of purchase to ensure minimal DNA mutations. Prior to tumor implantation cells were washed with phosphate buffered saline (PBS), dissociated by incubation with trypsin (Sigma-Aldrich), washed and diluted to 10 million cells/mL in PBS and mixed at a 1:1 (v:v) ratio with Matrigel (Corning). Tumor cells (1 million cells in 100 µL) were implanted in the upper right flank of mice.
Animal studies
All mice were housed and maintained by the Center for Comparative Medicine, which was approved by the Massachusetts General Hospital Institutional Animal Care and Use Committee. BALB/c mice implanted with CT26 tumors and C57BL6 mice implanted with MC38 tumors were treated with 200 µg of anti-PD-1 (clone RMP1-14) and 100 µg of anti-CTLA-4 (clone 9H10) on days 3, 6 and 9 following tumor inoculation.
On the day of imaging, 68Ga-NOTA-GZP was prepared by eluting an Eckert and Ziegler preclinical generator with 6 mL of 0.1 M HCl, discarding the first 1 mL of eluent and adjusting the remaining 5 mL to pH 4.5 with approximately 200 µL of 2 M HEPES buffer. NOTA-GZP was diluted to 1 mg/mL in metal-free water, and 30 µL added to the pH-adjusted generator eluent and allowed to incubate for 10 min prior to purification by a C18 reverse-phase SepPak cartridge (Waters). After washing away free gallium with PBS, bound peptide was eluted with 70% (v:v) ethanol and diluted to 111 megabecquerel/mL in sterile PBS. Mice were injected intravenously with 100 µL of radio-labeled peptide and subjected to PET/CT scan after 1 hour. All scans were completed on a rodent Triumph PET/CT (GE Healthcare) and PET images were obtained for 15 min, which was followed by CT imaging. All images were reconstructed using 3D-MLEM (4 iterations with 20 subsets). The mean regions of interest were drawn around the tumor and heart using anatomic guidance using VivoQuant software (InviCRO) and standard uptake value was calculated for each tumor and heart to generate target-to-background (TBR) ratios. Mice were sacrificed after imaging for tissue processing.
Ex vivo tissue characterization
Tumors and tumor-draining lymph nodes (TDLN) were excised and minced in sterile petri dishes. Tumor samples were then incubated in a collagenase solution (1 mg/mL in RPMI-1640) for approximately 45 min at 37°C. Tumors were processed into a single cell suspension using a 70 µm cell strainer. This solution was centrifuged, and the supernatant was saved for cytokine analysis. Cell viability was assessed by trypan blue staining. Depending on the size and viability of tumors and lymph nodes, 0.1–1×10⁶ viable cells were stained for flow cytometry analysis. Cells were washed with PBS and stained with a 1:1000 solution of ZOMBIE Brilliant Violet (from ZOMBIE Violet Fixable Viability Kit, Biolegend) and incubated on ice for 15 min. After washing twice with cell staining buffer (Biolegend), extracellular antibodies were added according to online supplementary figure S1 at 100 µL total volume diluted with cell staining buffer and incubated for 20 min on ice in the dark. Cells were then washed twice with cell staining buffer, fixed with True-Nuclear stain (Biolegend) and incubated at room temperature in the dark for 45–60 min. After incubation, cells were pelleted, and the supernatant discarded. True-Nuclear Perm Buffer was then added to each well for cell permeabilization. Fluorochrome conjugated intracellular antibodies diluted in True-Nuclear Perm Buffer were then added to the pelleted cells and incubated in the dark at room temperature for 30 min. After intracellular staining, cells were resuspended in cell staining buffer, and the samples were analyzed on a BD LSRFortessa X20 flow cytometer (BD Biosciences).
Supplemental material
Data were gated using FlowJo software (FlowJo LLC). Doublets and cell clumps were excluded by gating along the 1:1 line for forward scatter height versus forward scatter area (FSC-A). Cellular debris and dead cells were excluded by side scatter area versus FSC-A and viability stain, and immune cells were then selected based on CD45 expression. Gating for individual markers was determined by fluorescent minus one control panels and unstained controls. Gates were then confirmed using backgating.
Cytokine analysis was performed on the tumor and TDLN of treated and vehicle mice following tumor inoculation and PET imaging. Supernatant from the same tumors used to generate flow cytometry single cell suspensions was analyzed using a T helper (Th)1/Th2/Th17 murine-specific ProcartaPlex Multiplex Immunoassay (ThermoFisher) for detection and quantitation of targets. Tumor sample, antigen standard or control was added to diluted 50× magnetic beads for analyte capture in 96-well plates. The plate was then sealed and incubated at 25°C shaking (500 rpm) for 120 min. To detect captured analytes, 25 μL of Detection Antibody Mix was added to the plate and incubated at 25°C shaking for 30 min, followed by a 30 min incubation of streptavidin-phycoerythrin. Magnetic beads were resuspended in 120 μL of reading buffer, mixed with samples and read on a Luminex 100/200 instrument. The concentration of each sample was calculated by plotting the expected concentration of each standard against the mean fluorescent intensity generated by each standard. A four-parameter logistic regression algorithm was then used to generate the best curve fit and sample values were interpolated accordingly.
All statistical analysis was performed using GraphPad Prism V.8 software. For correlations between imaging and tissue-based analyzes, parametric regression was performed using granzyme B PET TBR as the independent variable and phenotype as the dependent variable. Correlations were considered significant if the p value for rejecting the null hypothesis of a zero slope between GZP PET TBR and phenotype was <0.05. As this was a proof-of-principle study, p values were not corrected for multiple comparisons, however the list of corrected p values corrected using false discovery rate algorithm can be found in online supplementary tables T1–T4. For volcano plots, absolute phenotypic values were normalized to the highest and lowest values to account for differences in the abundance of both cell types and cytokine concentrations. The reported slopes therefore represent a value normalized to the relative physiological concentration in order to allow for a more direct comparison between phenotypes. Non-biological outliers were removed using a non-linear regression method from Motulsky and Brown, with a Q coefficient of 0.1.12
Supplemental material
Results
Granzyme B PET imaging reveals tumor-dependent immune activation kinetics
68Ga-NOTA-GZP PET imaging (GZP PET) was performed in both CT26 and MC38 vehicle-treated and combination-treated tumors on days 6, 9 and 12 post-tumor inoculation in order to capture both early and late response to immunotherapy based on previous imaging studies.7 10 Specific tumor uptake was measured as a function of tumorous PET signal normalized to residual blood signal and reported as a TBR. On day 6, CT26 vehicle tumors demonstrated minimal GZP PET accumulation (TBR=0.73±0.40), whereas treated tumors on average had a higher TBR of 1.48±0.68 (figure 1A,B). It is important to note that not all treated tumors will respond to immunotherapy, and it is therefore common for larger SD to occur in the treated group, diminishing the significance of group comparisons between vehicle and treated mice. At day 9, both the vehicle and treated groups had measurable increases in immune cell activation, with an average TBR of 1.62±0.56 measured for vehicle and 1.90±0.64 for treated tumors. This result indicated an increase in the overall immunogenicity of the CT26 tumor microenvironment as the tumor progressed even in the absence of therapy, although at a diminished level compared with treated tumors. By day 12, however, the natural immune response to CT26 tumors in the vehicle group had stabilized and no increase was seen in the GZP PET TBR (1.62±0.68), whereas the immune cell activation in CT26-treated tumors again increased significantly above vehicle tumors, with a measured TBR of 2.82±0.65 (p=0.04). Tumors were excised after imaging and stained for granzyme B and intracellular levels were compared with the GZP PET signal, which only measures the extracellular active granzyme B (figure 1C). Although the slope of the linear correlation was significantly non-zero (p=0.02), the coefficient of correlation was low (R2=0.21). This is most likely indicative of factors such as inactivation and exhaustion also creating a disconnect between intracellular granzyme B, as measured by flow cytometry, and released granzyme B, as measured by PET. MC38 tumors, which have a higher number of mutations and are mismatch repair-deficient, were then compared with previously described CT26 tumors, which are KRAS-mutated and have a moderate number of tumor neoantigens.11 MC38 GZP PET signal was measured similar to CT26 GZP PET at day 6 for vehicle (TBR=0.94±0.20) and treated (TBR=1.26±0.49) tumors (figure 1D,E). However, progressing from day 6 to day 9 significantly increased the immune cell activation in both vehicle and treated tumors. MC38 tumors reached the maximum immune activation at day 9 with a measured GZP PET TBR=2.76±0.37, which was higher than vehicle tumor activation (TBR=1.96±0.70). Immune cell activity in treated MC38 tumors decreased from day 9 to day 12 (day 12 TBR=2.04±0.52) and was statistically indistinguishable from vehicle-treated mice, which had a minimal increase in GZP PET TBR (2.19±0.34). The decrease of GZP PET signal in the treated group was also correlated with a decrease in the number of granzyme B-positive cells and an increase in the number of PD-1+EOMES+ exhausted T cells between the day 9 and day 12 tumors (online supplementary figure 2). In a similar manner to CT26 tumors, intracellular granzyme B was compared with extracellular granzyme B (figure 1F). Again, the slope was significantly non-zero (p<0.001); however, the coefficient of correlation between intracellular and extracellular granzyme B was much higher (R2=0.45), suggesting that fewer discontinuities between granzyme B expression and release occur in this model.

(A) Maximal intensity projections of anti-programmed cell death protein-1 plus anti-cytotoxic T-lymphocyte antigen-4 treated or vehicle CT26 tumor-bearing mice demonstrating tumor uptake and clearance of the GZP positron emission tomography (PET) imaging agent. (B) Average target-to-background (TBR) (n=4) of treated and vehicle CT26 tumor-bearing mice on days 6, 9 and 12 post-tumor inoculation, where error bars denote SE measurements (SEM). (C) Parametric linear correlation of released granzyme as denoted by GZP PET TBR compared with intracellular granzyme B detected by flow cytometry. The same analyzes were performed in MC38 tumors (D–F). *P<0.05.
The ability to measure active granzyme B release by PET imaging allowed for mapping of the kinetics and magnitude of immune activation across the entire tumor. These metrics identified a more rapid and robust activation in the mismatch repair-deficient MC38 tumors, consistent with previous characterizations of the tumor as immunoresponsive.13 This was evident even in a comparison of vehicle-treated controls, with MC38 tumors having significantly higher levels of GZP PET signal at both day 9 and 12. The higher immunogenicity of MC38 tumors also lead to an earlier maximum release of granzyme B in comparison to CT26 tumors, which are microsatellite stable. In order to examine the potential causes of these differences between the two tumor microenvironments, in addition to exploring drivers of granzyme B release and anti-tumor immune response, the PET-imaged tumors were simultaneously analyzed using flow cytometry and ELISA.
Moderately immunogenic CT26 tumors are driven by tumor-draining lymph node-dependent immune cell activation
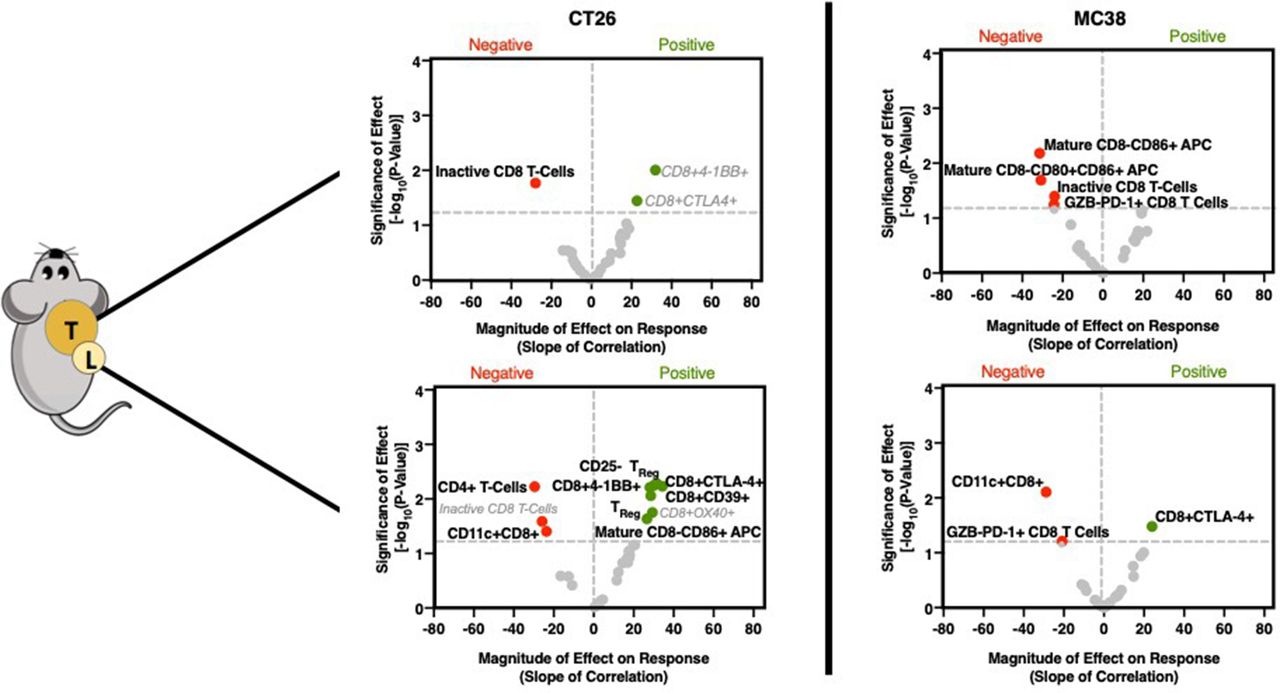
Following GZP PET imaging, mice were sacrificed, and both tumors and TDLN were excised for flow cytometry. Cellular phenotypes were identified that correlate with GZP PET uptake and hence immune cell activation by performing parametric linear regression, and the magnitude of these effects could be determined by analyzing the value of the slope. Additionally, phenotypes that correlated with time on treatment, and phenotypes that showed statistically significant differences between treated and vehicle groups were also determined (online supplementary figure 3). Phenotypes correlating with time or treatment that were also found in the GZP PET correlations are shown in gray, as it was likely that they did not contribute to response and would obfuscate analysis. Surprisingly, in CT26 tumors, few immune cell phenotypes were found to correlate with GZP PET (figure 2, online supplementary tables T5–T11). Of the three cellular biomarkers with significant correlations, all three were CD8+ T-cell subsets. CD8+4-1BB+ T cells, which have been previously proposed as a biomarker of response to combined anti-PD-1 and CTLA-4 therapy,14 were correlated strongly with GZP PET (p<0.01, slope=10.1), but were also found to correlate with time post-inoculation. This indicates that CD8+4-1BB+ T cells increase in a treatment-independent and response-independent manner during tumor progression and offer diminished insight as a differentiating factor of effective therapy-induced immune cell activation. CD8+CTLA-4+ T cells were also found to significantly correlate with GZP TBR (p<0.05, slope=9.4), but were also identified to increase in abundance following administration of immunotherapy, regardless of treatment outcome. Only CD8+GZB−PD-1− cells (inactive T cells) were shown to negatively correlate with GZP PET TBR (p=0.05, slope=−28.0). This correlation was not treatment-dependent or time-dependent, and thus considered to be an important factor negatively predictive of immune activation.

Volcano plots of the −log10 of the p value of the linear correlation between GZP positron emission tomography (PET) signal and individual cellular phenotypes quantified by flow cytometry vs the normalized slope (GZP PET) of the same correlation. P values were determined by the probability of a non-zero slope for the linear correlation. Correlations found in the tumor are shown on the top, and those from the tumor-draining lymph node are on the bottom, with a comparison of moderately immunogenic CT26 tumors (left) and highly immunogenic MC38 (right) tumors shown side-by-side. Points with a p value <0.05 are labeled, red dots correspond to negative GZP PET correlations, and green dots correspond to positive GZP PET correlations. Bolded labels indicate those that are unique to a specific correlation, gray and italicized labels indicate those that are found in multiple correlations.
Despite the lack of correlations in CT26 tumors, many immune cell types in the TDLN were significantly correlated with GZP PET signal measured in the tumor (figure 2, online supplementary tables T12–T19). The cell subtypes included several previously correlated markers of antigen-specific activated T cells, including CD8+4-1BB+ (p=0.005, slope=31.45), CD8+CTLA-4+ (p=0.006, slope=34.4) and CD8+CD39+ (p=0.009, slope=28.5). Additionally, CD8− mature APCs (CD40+CD86+, p=0.02, slope=26.6) and CD25+FoxP3+ (p=0.02, slope=29.3) and CD25−FoxP3+ Tregs (p=0.006, slope=30.2) were also correlated. The factors found to negatively affect GZP PET included CD4+ T cells (p=0.006, slope=−29.5), although not Tregs, and CD11c+CD8+CD40− cells (p=0.04, slope=−23.7), which have been shown to have a regulatory phenotype.15
Highly immunogenic MC38 tumor response is diminished in the presence of CD8-negative mature APCs and granzyme B-negative T cells
In MC38 tumors, there were no selected cell types that positively correlated to the GZP PET TBR in the tumor (figure 2, online supplementary figures S4,S5). The only correlations observed with GZP PET were negative correlations with inactive CD8+ T cells (p=0.004, slope=−20.9) and mature CD8− APCs (p=0.01, slope=−16.4). In mice, CD8− APCs do not cross-present antigens, suggesting antigen cross-presentation and major histocompatibility complex (MHC) II expression are important factors for an effective anti-MC38 tumor response and potentially highly inflammatory tumors in general. This has been demonstrated clinically as well, as tumorous downregulation of MHC II or mutations in beta-2-microglobulin drive adaptive resistance to PD-1 and CTLA-4 therapy.4 5
There were fewer correlations with tumorous GZP TBR in the TDLN of MC38 tumor-bearing mice compared with CT26 tumor mice, although PD-1+GZB− CD8 T cells were negatively correlated with response in both the tumor and TDLN. Additionally, as in CT26 tumor mice, CD11c+CD8+ (p=0.008, slope=−28.8) cells also negatively correlated with immune activation, and CD8+CTLA-4+ T cells (p=0.03, slope=24.0) were positively correlated with response. These results indicated that the cellular populations measured were not the major drivers of granzyme B release and warranted exploration of cytokine signaling.
GZP PET correlation with tumorous cytokine expression reveals significant role in recruiting and initiating Th1 response
In a similar manner to immune cell phenotypes, cytokine levels from the supernatant of recovered tumors and TDLN were also assayed. In contrast to cellular data, large and robust correlations were determined between GZP PET signal and specific cytokines (figure 3, online supplementary figures S6–S9). The cytokines could generally be grouped into two classes, namely those that recruit pro-inflammatory Th1 cells and those that guide and amplify Th1 responses. In CT26 tumors, the chemokines macrophage inflammatory protein (MIP)-1α (CCL3) (p=0.0338, slope=16.44), MIP-1β (CCL4) (p=0.0021, slope=21.47) and CXCL10 (p=0.006, slope=20.1) were significantly correlated with anti-tumor response, but not time or treatment, indicating correlation with response to therapy (online supplementary figure S4). All of these cytokines have been demonstrated to attract CD8+ T cells, dendritic cells and other pro-inflammatory cell types to sites of inflammation. Granulocyte-macrophage colony-stimulating factor (GM-CSF) (p=0.0012, slope=20.5), which initiates dendritic cell maturation was also positively correlated with GZP PET signal. Additionally, interleukin (IL)-1β (p=0.0002, slope=23.45), a potent pyrogen involved in the initiation and amplification of Th1 responses, IL-27 (p=0.0034, slope=20.92) and IL-28 (p=0.0057, slope=23.42) which have also been implicated in augmented Th1 responses, were correlated with granzyme B release. Interestingly, eotaxin (p<0.0001, slope=26.81), a chemokine that recruits eosinophils was also highly correlated with granzyme B release. While eosinophils do not exert their effector function through granzyme B, they have been demonstrated to be predictive of immunotherapy response. The levels of eotaxin might be a by-product of exposure of endothelial cells to Th1 cytokines, and could help to amplify the effects of CD8-mediated cell killing.16
There were several cytokines that were found to significantly correlate in both CT26 and MC38 tumors (figure 3). MC38 granzyme B PET signal was also highly correlated with IL-1β (p<0.0001, slope=34.13), MIP-1α (p=0.0463, slope=17.66), GM-CSF (p=0.0378, slope=17.77), CXCL10 (p=0.0027, slope=23.81) and eotaxin (0.0028, 27.87) in the same manner as CT26 tumors. In contrast, MC38 immune cell activation was separately correlated with the monocyte-recruiting chemokine monocyte chemotactic protein-3 (CCL7) (0.0077, 30.12), tumor necrosis factor (TNF)-α (0.0021, 26.99), which actively suppresses Tregs, the Th1 response-inducing cytokine IL-18 (0.0038, 26.81) and IL-3 (0.0217, 24.07), which induces tumor angiogenesis and may contribute to T-cell trafficking (online supplementary figure S5). Some of the differences appeared to be mechanisms of Th1-response induction, such as IL-27 in CT26 tumors versus IL-18 in MC38 tumors, but others implicated completely distinct pathways. For instance, granzyme B release was highly correlated with TNF-α, which can reduce Treg functionality and may indicate a need for the reduction of Treg activity in highly inflammatory tumors. The strong correlation in MC38 tumor granzyme B release to IL-3, a major driver of angiogenesis, supports the hypothesis that increased vascular delivery to highly immunogenic tumors may drive higher levels of checkpoint inhibitor response.17
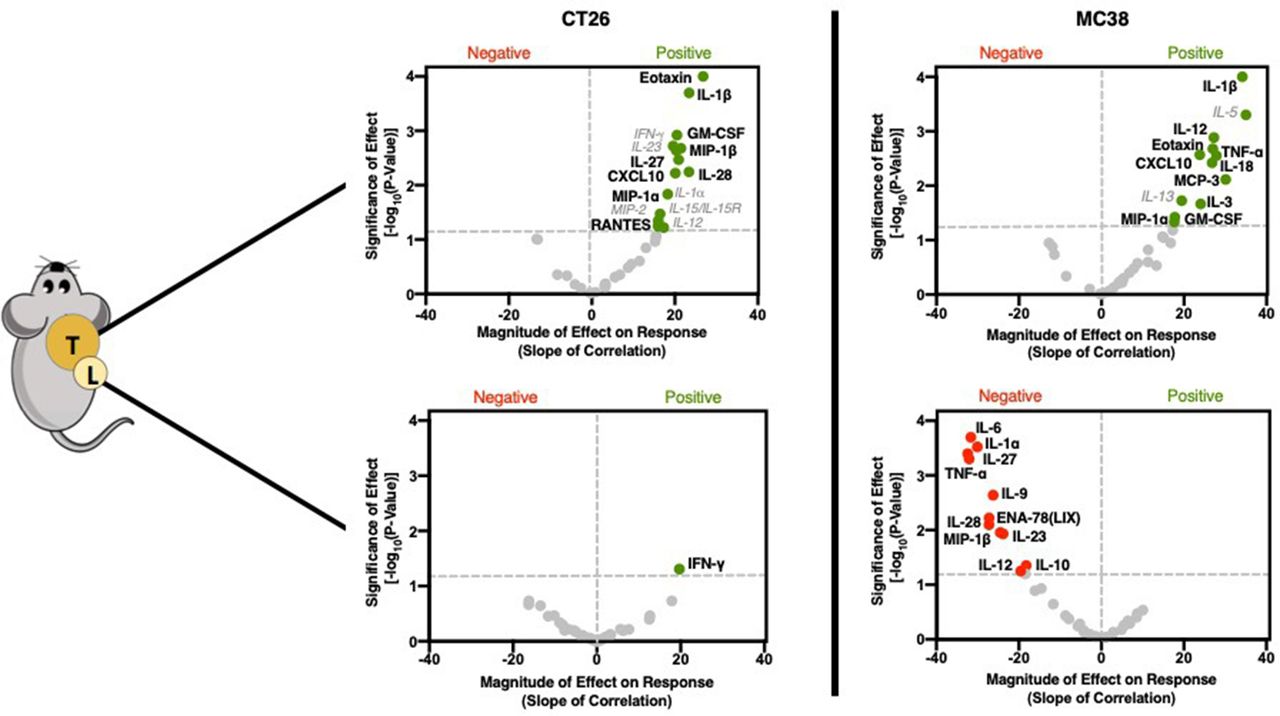
Cytokine and chemokine correlations for CT26 (left) and MC38 (right) tumors (top) and lymph nodes (bottom). Volcano plots were generated using the same methodology and labeled using the same schema as described in figure 2.
Low GZP PET tumors have Th2-polarizing and Treg-polarizing tumor-draining lymph node cytokine combinations
In addition to the tumors, TDLN cytokines were measured. CT26 TDLNs had only one correlation, with higher levels of interferon (IFN)-γ (p=0.049, slope=19.69) being positively correlated with response. In contrast, MC38 TDLN appeared to be strongly associated with therapeutic resistance, with 11 cytokines demonstrated to significantly impair immune response. Several cytokines, including IL-6 (p=0.0002, slope=−31.67), IL-9 (p=0.002, slope=−26.22) and IL-10 (p=0.044, slope=−18.22) drive anti-inflammatory Th2 responses and could be expected to be important mediators of resistance. IL-23 (p=0.01, slope=−23.79) when combined with IL-6 and IL-10, has been demonstrated to differentiate Th17 cells into a regulatory subtype, which would also be expected to decrease granzyme B release. Others, including TNF-α (p=0.005, slope=−32.04), IL-27 (p=0.0004, slope=−32.39), IL-28 (p=0.008, slope=−27.26) and MIP-1β (p=0.01, slope=−24.52) were found to positively correlate with response when found in either MC38 or CT26 tumors, but negatively correspond to response in the lymph nodes. This emphasizes the role tissue compartmentalization plays in response and provides guidance for localized versus systemic application of endogenous cytokines. For example, simultaneously high levels of IL-6 and TNF-α can neutralize the activity of TNF-α, and the concurrent presence of IL-27 for the priming of inactive T cells can convert proliferating T lymphocytes into a regulatory phenotype. It is through the context of other cytokines that each cytokine functions, and GZP PET can define this context.
Conclusion
Herein, we describe a novel method for using GZP PET to reveal critical cellular and cytokine measures of response based on a continuous and real-time metric of immune cell activation in combination with tissue-based analysis. We demonstrate that while both CT26 and MC38 tumors respond to PD-1 plus CTLA-4 blockade, the kinetics of immune cell activation are distinct, and correlate with highly divergent immune cell phenotypes and cytokine expression in both tumors and TDLN. By measuring functional granzyme B release, we demonstrate that the timing of sampling during the immune response is important, as the time to reach maximum immune activation can be varied, even among responding genetically identical tumors. As such, a direct functional measurement like GZP PET allows for insights into response determinants that are otherwise highly difficult to assess.
Using GZP PET-based parametric analysis, we were able to identify distinct microenvironments correlated with response for KRAS mutant, moderately immunogenic CT26 colon tumors and mismatch repair deficient highly immunogenic MC38 tumors that could not be detected by standard comparison of treated and vehicle groups (figure 4). For example, CT26 tumor granzyme B levels were strongly positively correlated to the presence of activated T cells and APCs in the TDLN, whereas fewer correlations were made between antigen-specific activation and response in MC38 tumors. The diminished correlation between response and lymph node cell phenotypes in MC38 tumors indicates that the role of the TDLN may be of a varying degree of importance, and factors such as baseline inflammation and mutational burden may influence what role the TDLN plays in immune response. Instead, for MC38 tumors, response to dual therapy was strongly negatively correlated to activated non-cross-presenting APCs in the tumors, with minimal correlation to cell phenotypes in the TDLN. The spatially and phenotypically distinct correlations between CT26 and MC38 tumors to the same functional measurement, tumorous granzyme B release, offer insight into the drivers of response for each model. In CT26 tumors, it appears that lymph node involvement is necessary to drive response, whereas in MC38 tumors, anti-tumor immunity may actually be the default response to therapy, and only in the presence of non-cross-presenting tumorous APCs is this action diminished. The failure to cross-present antigens could abrogate response through several mechanisms, and these data indicate that this type of treatment-resistant tumor may not benefit as strongly from tumor vaccines or APC agonists, and instead may derive benefit from targeted ablation of dendritic cells that drive the polarization of immunosuppressive cells. The value of GZP PET characterization can be further demonstrated by analyzing MC38 tumors solely on the basis of treatment, without accounting for response. CD8+ activated APCs would be highly enriched in the treatment group, leading to the opposite conclusion as measured by GZP PET correlation. This apparent paradox highlights the value of identifying changes that occur in the tumor microenvironment following treatment that might correspond to or indicate response to therapy. It is important to note, however, that the observed phenotypes may not be the only mechanisms of resistance, and that a limitation of GZP PET imaging is that it is only accurate above tumor volume thresholds of approximately 40 mm3. Thus, mechanisms of resistance that occur before this volume would not be captured by GZP PET analysis.

Schematic of proposed mechanism for stratifying patients using GZP PET imaging, along with potential therapeutic approaches dictated by GZP positron emission tomography (PET)-based tissue analysis.
Although checkpoint blockade efficacy was assessed by measuring GZP PET signal in the tumor, multiple significant correlations between tumorous granzyme B, cell phenotypes and cytokine concentrations were found in the TDLN. The correlation of T cells expressing markers that have been associated with antigen-specific activation including CTLA-4, CD39 and 4-1BB are evidence that efficient trafficking of these cells from the tumor to the lymph node is important. This is in accordance with previous studies demonstrating that the presence of activated T cells in TDLNs correlates with response, and prevention of trafficking between the TDLN and tumor abrogates response.18 Egressing T cells have been shown to express high levels of IFN-γ and the degranulation marker CD107a, which suggests that anti-tumor response may precede the trafficking of antigen-specific, activated T cells through the lymphatic system and to sites of distant metastasis.19 These findings may have clinical relevance for tumors with moderate levels of tumor neoantigens but relatively low baseline inflammation, which is modeled by the CT26 tumor cell line. In those patients, if combination PD-1 and CTLA-4 blockade is ineffective, the introduction of tumor-specific vaccines to boost APCs or therapeutic strategies that either inhibit T-cell sequestration or boost T-cell trafficking may be beneficial.
While the presence of tumor-specific T cells is necessary for response, crosstalk between immune cells, tumor cells and cells in the tumor microenvironment is of equal importance. Because of this, we also analyzed cytokine levels in the supernatants of both tumors and TDLNs of CT26 and MC38 tumor-bearing mice. Although differences were observed between the two tumor types, in general, responders in both tumor types were positively correlated with tumorous T-cell chemokines such as CCL3 and CXCL10.20 21 CXCL10, specifically, has been previously demonstrated to recruit granzyme B+ CD8 T cells, and so its correlation with high levels of granzyme B could be expected.22 Additionally, correlation with tumorous IL-1β, a potent cytokine involved in the initiation and activation of Th1 responses, was also observed in both tumor types.23 The presence of conserved cytokines like CXCL10 and IL-1β that correlated with granzyme B release across both tumors, despite very little similarity in immune cell composition, offers promise as a universal mechanism of tumor response. Delivery of these cytokines, through direct tumor injection or tumor-directing vectors such as antibody-cytokine conjugates, may allow for the induction of immune responses in otherwise immunologically cold tumors.24 One other overlapping tumorous cytokine of note, eotaxin, may be of interest in combating loss of tumor antigens, as it attracts eosinophils which do not rely on antigen recognition for activation.25 26 Although it is most likely that eotaxin release is indirectly related to granzyme-mediated killing, it is clear that high levels of eotaxin do not interfere with, and may even contribute to, granzyme B release. Others have reported effective anti-tumor eosinophil-based immunotherapy, and our work supports this approach as an alternative mechanism to checkpoint blockade, perhaps through specific delivery of eotaxin to tumors.27
In addition to tumorous cytokines, several cytokines found in the TDLN also correlated with immune activation. Interestingly, the largest number of correlations were found in the TDLN of MC38 tumors, and only negative correlations were observed. Some such as IL-6, IL-9 and IL-23 work in concert to drive Th2 regulatory responses.28–30 Others such as IL-10 and IL-27 can bias inactive T cells toward regulatory functions, decrease antigen presentation capabilities or increase sequestration of T cells in the lymph node.31 32 Several correlated TDLN cytokines were mechanistically interconnected. For instance, IL-1α can induce TNF-α, and the combination of both has been demonstrated to induce CXCL5.33 Given the robust number of cytokines that are correlated with resistance to checkpoint therapy, identification of impactful individual cytokines that allow for synergistic increases in efficacy are warranted. From those determined by GZP PET imaging, IL-6 seems to be of the most interest. It has been demonstrated to exert multiple pro-tumor functions, including blocking the functions of pro-inflammatory TNF-α and IL-1α, inducing expression of anti-inflammatory cytokines IL-9 and IL-10, and driving Th17 cells toward a regulatory phenotype in combination with IL-23.34 Inhibition of IL-6, therefore, could enhance anti-tumor immunity in a multifaceted manner.35 In support of this hypothesis, clinical trials examining inhibition of IL-6 in tumor immunotherapy are under way.
The long-term clinical applications of this technique show significant promise on several fronts. The power of examining immune cell activation parametrically is much greater than dichotomous interpretations and allows for determination of significance, and a quantification of how changes in phenotype drive granzyme B release. Novel targets and entire pathways of anti-tumor response can be identified that might otherwise be missed due to the lack of time-matched functional information at the time of sample collection. Our data represent a proof of concept that the mechanisms of tumor response can be differentiated using GZP PET between moderately and highly immunogenic tumor microenvironments. However, as this study was designed as a proof of concept, it is limited by the number of time points, models and mice sampled. Future studies are needed that are correctly powered to address more specific hypotheses surrounding the importance of any individual time point or phenotype. This work and future studies should support development of tumor microenvironment-specific adaptive therapeutic approaches to combat treatment failure and offers the capability of identifying new pathways of resistance.
A GZP PET-based, functional approach to response stratification represents a novel clinical path that can be combined with flow cytometry or RNA sequencing methods to identify mechanisms of anti-tumor immunity or tolerance. GZP PET is clinically translatable, and we have previously demonstrated human-specific granzyme B binding and its correlation with treatment response in melanoma.10 Expansion into clinical assessment of this same concept, even expansion to include more robust tissue analysis techniques including single-cell mRNA sequencing and advanced flow cytometry and histology approaches offers exciting new pathways toward improved cancer immunotherapy.
References
Footnotes
BL and UM are joint senior authors.
TL and EEA are joint first authors.
Twitter @BenLarimer
Contributors TLS, EW-K and BL conceived and designed the work. TLS, EEA, GR and SN acquired and analyzed the data. TLS, EEA, GR, EW-K, SN, BL and UM interpreted the data, drafted and substantively revised the manuscript. All authors have approved the submitted version and are accountable for their own contributions.
Funding This study was funded by R00CA215604 to BL, Melanoma Research Alliance to UM, R01CA214744 to UM.
Competing interests BL, EWK and UM are consultants and shareholders of Cytosite Biopharma.
Patient consent for publication Not required.
Provenance and peer review Not commissioned; externally peer reviewed.
Data availability statement Data are available on reasonable request. Most raw data are published as supplemental files, imaging raw data are available on request.