Article Text

Abstract
Background Analysis of vector integration sites in gene-modified cells can provide critical information on clonality and potential biological impact on nearby genes. Current short-read next-generation sequencing methods require specialized instruments and large batch runs.
Methods We used nanopore sequencing to analyze the vector integration sites of T cells transduced by the gammaretroviral vector, SFG.iCasp9.2A.ΔCD19. DNA from oligoclonal cell lines and polyclonal clinical samples were restriction enzyme digested with two 6-cutters, NcoI and BspHI; and the flanking genomic DNA amplified by inverse PCR or cassette ligation PCR. Following nested PCR and barcoding, the amplicons were sequenced on the Oxford Nanopore platform. Reads were filtered for quality, trimmed, and aligned. Custom tool was developed to cluster reads and merge overlapping clusters.
Results Both inverse PCR and cassette ligation PCR could successfully amplify flanking genomic DNA, with cassette ligation PCR showing less bias. The 4.8 million raw reads were grouped into 12,186 clusters and 6410 clones. The 3′long terminal repeat (LTR)-genome junction could be resolved within a 5-nucleotide span for a majority of clusters and within one nucleotide span for clusters with ≥5 reads. The chromosomal distributions of the insertional sites and their predilection for regions proximate to transcription start sites were consistent with previous reports for gammaretroviral vector integrants as analyzed by short-read next-generation sequencing.
Conclusion Our study shows that it is feasible to use nanopore sequencing to map polyclonal vector integration sites. The assay is scalable and requires minimum capital, which together enable cost-effective and timely analysis. Further refinement is required to reduce amplification bias and improve single nucleotide resolution.
- genetics
- oncology
- immunology
- cell engineering
- immunotherapy, adoptive
This is an open access article distributed in accordance with the Creative Commons Attribution Non Commercial (CC BY-NC 4.0) license, which permits others to distribute, remix, adapt, build upon this work non-commercially, and license their derivative works on different terms, provided the original work is properly cited, appropriate credit is given, any changes made indicated, and the use is non-commercial. See http://creativecommons.org/licenses/by-nc/4.0/.
Statistics from Altmetric.com
Introduction
Gene modification can be highly efficient and effective in conferring specific biological traits to a cellular therapeutic. In a majority of cases, gene modification involves the integration of one or more copies of a transgene into the host cell genome, which is passed down to all its progenies. Although targeted transgene integration using CRISPR/cas9 and other genome editing techniques hold great promise and may well be the path of the future,1 2 the vast majority of current gene-modified cellular therapeutics use gammaretroviral, lentiviral, or non-viral vectors that are non-targeted and can integrate at multiple sites, with some predilection for open chromatin and transcriptionally active regions.3–6 Analysis of vector integration sites can provide critical information on the clonality of gene-modified cells and potential biological impacts of specific transgene insertion sites, including the potential for insertional mutagenesis through the inactivation of tumor suppressor genes or activation of proto-oncogenes, such as LMO2 7 8 and EVI1;9 or alternatively, enhanced therapeutic efficacy, such as enhanced chimeric antigen receptor (CAR) T cell function through transgene disruption of TET2.10
In general, the analysis of transgene integration sites involves PCR amplification of the flanking genomic sequences, followed by sequencing of the PCR amplicons. This can be achieved by a number of methods, with one of the most commonly used being linear-amplification mediated PCR (LAM-PCR) or similar methodology followed by short-read high-throughput sequencing on Illumina or similar platforms.3 11 12 These next-generation sequencing platforms can generate a very large number of high-quality reads per flow cell, and thus provide economy of scale. However, the flow cells are expensive, the cost per run is high, and it is therefore necessary to pool a large number of samples to be cost efficient. In addition, short-read lengths can result in inefficient genome alignment. Oxford Nanopore sequencing is a relatively new sequencing platform which directly sequences a strand of DNA as it passes through a nanopore,13 14 and is capable of ultralong reads, as long as two Mb. Additionally, the sequencing flow cells from Oxford Nanopore Technologies are relatively inexpensive and sequencing can be performed in any laboratory without the need for dedicated sequencing equipment. Hence, it may be a cost-efficient platform for integration site analysis for smaller cell therapy centers where there are low sample volumes and potentially limited access to high-cost sequencing instruments.
We recently conducted a phase I clinical trial using T cells that were transduced with a gammaretroviral vector that carried the inducible caspase 9 (iCasp9) safety switch.15 In order to understand the in vivo clonal dynamics of the infused T cells, we developed a method to analyze the vector integration sites in patient samples using inverse PCR followed by nanopore sequencing.15 16 In the current paper, we describe in detail the inverse PCR methodology and an improved methodology using cassette ligation PCR, which has less bias, both followed by nanopore sequencing. We show that nanopore sequencing can be a readily accessible platform for vector integration site analysis. It has some limitations in regard to read quality and single nucleotide resolution, both of which are partially offset by the longer read lengths and are likely to improve with newer generations of nanopore sequencers and refinement in methodology.
Materials and methods
Retroviral vector and gene-modified cells
The gammaretroviral vector, SFG.iCasp9.2A.ΔCD19, has been previously described.17 It encodes a safety switch, inducible caspase 9 (iCasp9), and truncated CD19 (ΔCD19), which enables the detection of transduced cells by flow cytometry. The vector was pseudotyped with Gibbon ape leukemia virus envelope.17 Patient samples and generation of transduced Jurkat cell clones are described in the online supplementary information.
Supplemental material
DNA extraction and restriction enzyme digestion
Genomic DNA was extracted using Purelink genomic DNA mini kit (Invitrogen, Waltham, MA) according to the manufacturer’s instructions. Genomic DNA was digested with two 6-cutter restriction enzymes which generate compatible cohesive ends (underlined): NcoI, which cuts at C/CATGG and BspHI, which cuts at T/CATGA (both from New England BioLabs, Ipswich, MA). NcoI has three cut sites and BspHI has one cut site within the transgene, with the most distal cut site generated by NcoI at 1185 base pair (bp) from the junction between the vector insert and the flanking genomic DNA (figure 1A). Note that these restriction enzymes do not have any cut sites within the 5′ and 3′ long terminal repeats (LTR), which flank the transgene and are identical in sequence and orientation. This assay design avoids restriction enzyme digestion within the 5′LTR, which can result in the downstream amplification of the internal transgene sequence, producing non-informative reads. The resulting DNA fragments were circularized for inverse PCR or ligated to linker cassettes for downstream PCR amplification.

Schematic for PCR amplification of flanking genomic sequences. (A) Genomic DNA is digested with two 6-cutter restriction enzymes, NcoI and BspHI, which together are anticipated to cut at approximately 2 kb intervals. There are four restriction sites within the transgene sequence, the most distal of which is 1185 bp from the 3′LTR / genomic junction. NcoI and BspHI generate identical 4-nucleotide 5′ overhangs: 5′-CATG-3′, which can be circularized for inverse PCR or ligated to linker cassettes. (B) Inverse PCR begins with circularization with T4 DNA ligase, followed by PCR amplification of the unknown flanking genomic sequences using primers targeting the 3′LTR and the 3′LTR/distal transgene junction, indicated by continuous arrows. This is followed by nested PCR, indicated by dotted arrows, which incorporates tailing sequences for subsequent barcoding. The combined lengths of the dotted lines in the inner circle indicate the minimum theoretical length prior to the addition of tailing sequences and barcodes. (C) The ligation cassette comprises two partially complementary strands: a 27-nucleotide strand and a 14-nucleotide strand, the latter with a mismatched A at the 3′ end and a 5′overhang (5′-ATG-3′). Before cassette ligation, the genomic DNA fragments are filled with a single ddCTP to prevent elongation or ligation at the recessed 3′ end. Cassette ligation results in a nick on this strand, indicated by ‘X’. During the first cycle of PCR, fragments containing flanking genomic DNA are amplified by a primer spanning the transgene/3′LTR. The longer cassette strand does not prime because its complementary shorter strand has not ligated; whereas the shorter cassette strand does not prime because only 10 nucleotides are complementary to the longer cassette strand, resulting in a low annealing temperature. This cassette design limits the amplification of non-flanking genomic DNA and reduces PCR blocking by the shorter cassette strand. Subsequent cycles are primed by both the transgene/3′LTR primer and the longer cassette strand.
Inverse PCR
Inverse PCR was performed as previously described.15 16 In brief, DNA fragments were circularized in a dilute mixture of 1 ng/µL DNA in T4 DNA ligase buffer with one cohesive end unit/μL T4 DNA ligase (New England Biolabs) for 16 hours at 16°C. The ligation product was purified by ethanol precipitation. The first PCR reaction was 35 cycles, using a forward primer that was complementary to the distal 3′LTR and directed towards the flanking genomic DNA; and a reverse primer complementary to the junction between the distal transgene and 3′LTR (figure 1B). The PCR mixture was as follows: 50–400 ng circularized DNA template, forward and reverse primers (100 nM each), dNTP (250 nM), 1.25 Unit HotStart Taq DNA polymerase (Qiagen, Hilden, Germany), 1X PCR buffer, and 1X Q-Solution (Qiagen), in a final reaction volume of 50 µL. A 0.5 µL aliquot of the first PCR product was amplified in a nested PCR reaction for 35 cycles, and tailing sequences were added for barcoding and nanopore sequencing. All PCR reactions were performed on a Bio-Rad T100 thermal cycler (Bio-Rad Laboratories, Hercules, CA). Primer sequences and thermocycling conditions are listed in online supplementary table S1.
Cassette ligation PCR
Cassette ligation PCR was performed according to the schema in figure 1C. The restriction enzymes generated 5′ overhangs. A single dideoxy-CTP (ddCTP) was filled in to prevent elongation of the recessed 3′ ends using the following reaction mixture: NcoI/BspHI digested DNA 16.7 ng/µL, ddCTP 33 µM (GE Healthcare, Chicago, IL), DNA polymerase I, large (Klenow) fragment 0.167 U/µL (New England BioLabs) in CutSmart buffer (New England BioLabs) in a final reaction volume of 15 µL. The mixture was incubated at 25°C for 30 min, heat inactivated at 75°C for 20 min, and purified by ethanol precipitation.
Linker cassettes were made by annealing two single-stranded DNAs: 5′-ATGTCCCATGGTCA-3′ and 5′-CATAGTTGTTCCACTCCGACCATGGGA-3′ (both at 20 µM) in Tris-HCl (50 mM) with MgCl2 (5 mM). The mixture was heated to 95°C for 5 min, then gradually cooled to room temperature by turning off the heating block. The linker cassettes were aliquoted, stored at –20°C, and used without repeated freeze/thaw. The ddCTP-filled in DNA fragments were ligated to the linker cassettes using the following reaction mixture: DNA 5 ng/µL, linker cassette 500 nM, and T7 DNA ligase 30 U/µL in T7 ligase buffer (New England BioLabs). The mixture was incubated at 25°C for 30 min, heat inactivated at 65°C for 10 min, and purified by ethanol precipitation. Because the 3′ recessed end of the DNA fragments had a ddCTP, this reaction resulted in ligation of the longer linker cassette strand and a nick in the shorter linker cassette strand. The first PCR reaction was 30 cycles in 50 µL: the forward primer was complementary to the junction between the transgene and the 3′LTR to minimize non-informative reads from 5′LTR priming; and the reverse primer was identical to the longer linker cassette strand. The unligated linker cassette strand was short (14 nucleotides) relative to the ligated cassette strand (27 nucleotides), which reduced unwanted PCR priming of non-flanking genomic fragments. A 0.5 µL aliquot of the first PCR product was amplified 30 cycles in a nested PCR reaction (50 µL) which included tailing sequences for barcoding and nanopore sequencing.
Fragment size estimation by agarose gel electrophoresis
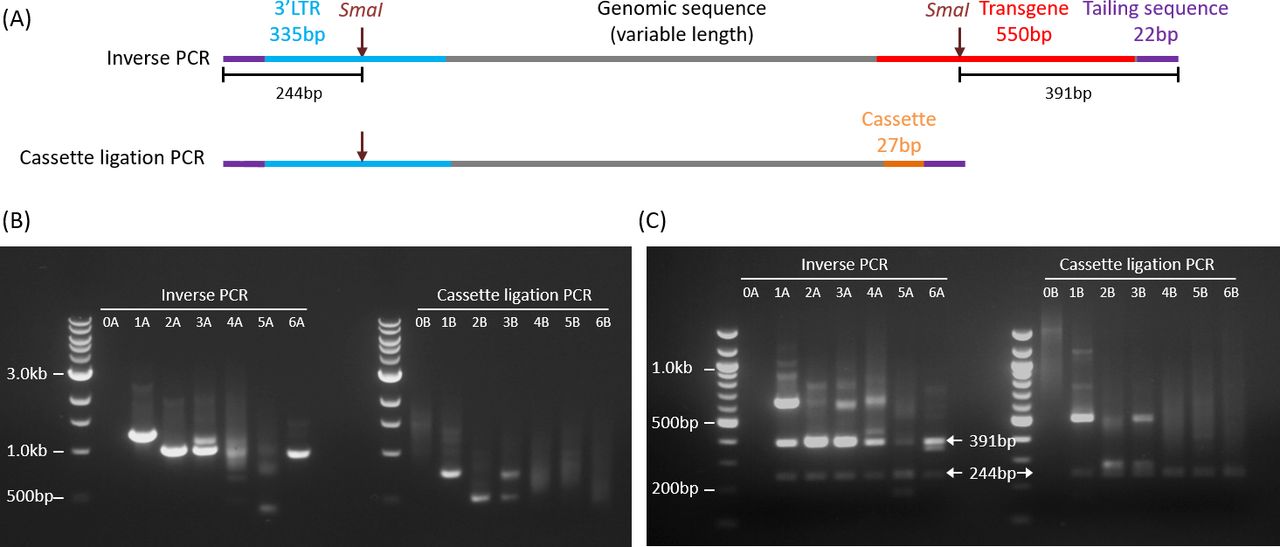
Fragment size estimation was performed by agarose gel electrophoresis and imaged on Vilber Lourmat Ebox CX5 (Vilber Lourmat). The nested PCR products (8 µL) were run on 1% agarose gel. To check for specificity of the amplicons, the PCR products were digested with SmaI, which has cut sites within the 3′LTR and distal transgene, generating DNA fragments of 244 bp and 391 bp from inverse PCR amplicons and fragments of 244 bp from cassette ligation PCR amplicons (figure 2).

Schematic and agarose gel electrophoresis of PCR amplification products. (A) Schematic representations of PCR amplicons from inverse PCR (upper) and cassette ligation PCR (lower). The theoretical minimum lengths including the tailing sequences (22 bp x 2) are 929 bp and 406 bp, respectively. (B) 1% agarose gel electrophoresis of inverse PCR (left) and cassette ligation PCR (right) products. Lane 0: non-transduced genomic DNA (negative control). A small proportion of bands (especially sample 5A) were smaller than the theoretical minimum lengths. (C) 2% agarose gel electrophoresis of PCR products after SmaI digestion. Arrows point to the expected specific bands.
Nanopore sequencing
Sequencing libraries were prepared according to 1D PCR barcoding amplicons protocol from Oxford Nanopore Technologies (ONT, Oxford UK). First, PCR amplicons from inverse PCR and cassette ligation PCR were barcoded using PCR barcodes provided by the supplier. Barcoding PCR mixture was as follows: 24 µL of nested PCR product (0.5 nM), 25 µL of LongAmp Taq master mix (New England Biolabs), and 1 µL of PCR barcode (ONT). Reactions were amplified in a thermal cycler with the following conditions: 95°C for 3 min, 15 cycles of amplification at 95°C for 15 s, 62°C for 15 s, and 65°C for 4 min, followed by final extension of 65°C for 1 min. Barcoded PCR products were purified using 0.8 X Agencourt AMPure XP beads (Beckman Coulter, Brea, CA). Concentrations of purified PCR products were measured using Qubit High Sensitivity Kit (Thermo Fisher, Waltham MA). Based on the concentrations, PCR products were pooled using 10 times more polyclonal clinical samples as compared with oligoclonal samples to increase sequencing coverage. Sequencing libraries were prepared from pooled barcoded PCR products according to manufacturer’s instruction. Briefly, end repair was performed in the following mixture: 48 µL of pooled PCR product, 3.5 µL of NEBNext FFPE DNA repair buffer, 2 µL of NEBNext FFPE DNA repair mix, 3.5 µL of Ultra II End-prep reaction buffer, and 3 µL of Ultra II End-prep enzyme mix (all from New England Biolabs); the mixture was incubated at 20°C for 15 min and 65°C for 15 min. End repaired products were purified with 1X Ampure XP beads (Agencourt) and eluted in 60 µL of nuclease-free water. Purified end-repaired products were ligated with 25 µL Ligation Buffer (ONT), 10 µL NEBNext Quick T4 DNA Ligase (New England Biolabs), and 5 µL Adapter Mix (ONT) and incubated at room temperature for 30 min. Ligated products were purified with 0.4X Ampure XP beads (Agencourt) and Short Fragment Buffer (ONT) and final sequencing library was eluted in Elution Buffer (ONT). Sequencing library was loaded into a single ONT PromethION flowcell and sequenced for 40 hours.
Sequence data analysis
A flow diagram for sequence data analysis is outlined in figure 3. Analysis parameters and custom scripts are provided in online supplementary information. Sequencing reads were base-called and demultiplexed using Guppy basecaller V.2.3.7 (ONT). Reads were classified based on the read quality score as pass (≥7) or fail (<7) by the basecaller. Adapters and sample barcodes were trimmed using Porechop V.0.2.4 (https://github.com/rrwick/Porechop). Reads that were shorter than the combined lengths of the predicted flanking sequences of the amplicons (885 bp for inverse PCR and 362 bp for cassette ligation PCR) were excluded from analysis. For inverse PCR, filtered reads were aligned to hg38 genome and both flanking sequences (ie, 3′LTR and distal transgene sequence), with masking of the distal transgene sequence using BWA mem (V.0.7.15).18 For cassette ligation PCR, the flanking cassette sequence was short and difficult to align; hence, this was first trimmed with Porechop and the trimmed reads were then aligned to hg38 genome and flanking 3′LTR with BWA mem (V.0.7.15).18 Note that as a result of cassette trimming, the final reads for cassette ligation PCR were 27 bp shorter than the original filtered reads. To determine which of the two ends represented the 3′LTR-genome junction, we developed a tool called FlankDetect (https://github.com/mdcao/japsa) (V.1.9-10b) (online supplementary information), which identifies reads which contain the flanking sequences and reports the integration site that flanks the junctional 3′LTR sequence. This tool also assigns clonality by clustering reads based on the flanking integration sites. Reads which have integration sites within 10 bp of each other are clustered together. During clustering, alignments that were not primary alignment and less than mapping quality of 20 were excluded from further analysis. To eliminate false clusters, Bedtools (V.2.26.0) merge option was used to merge any overlapping clusters which contain reads that align to the same region. The integration site that is most frequently observed within all the reads that are merged together is retained as the integration site of the clone.
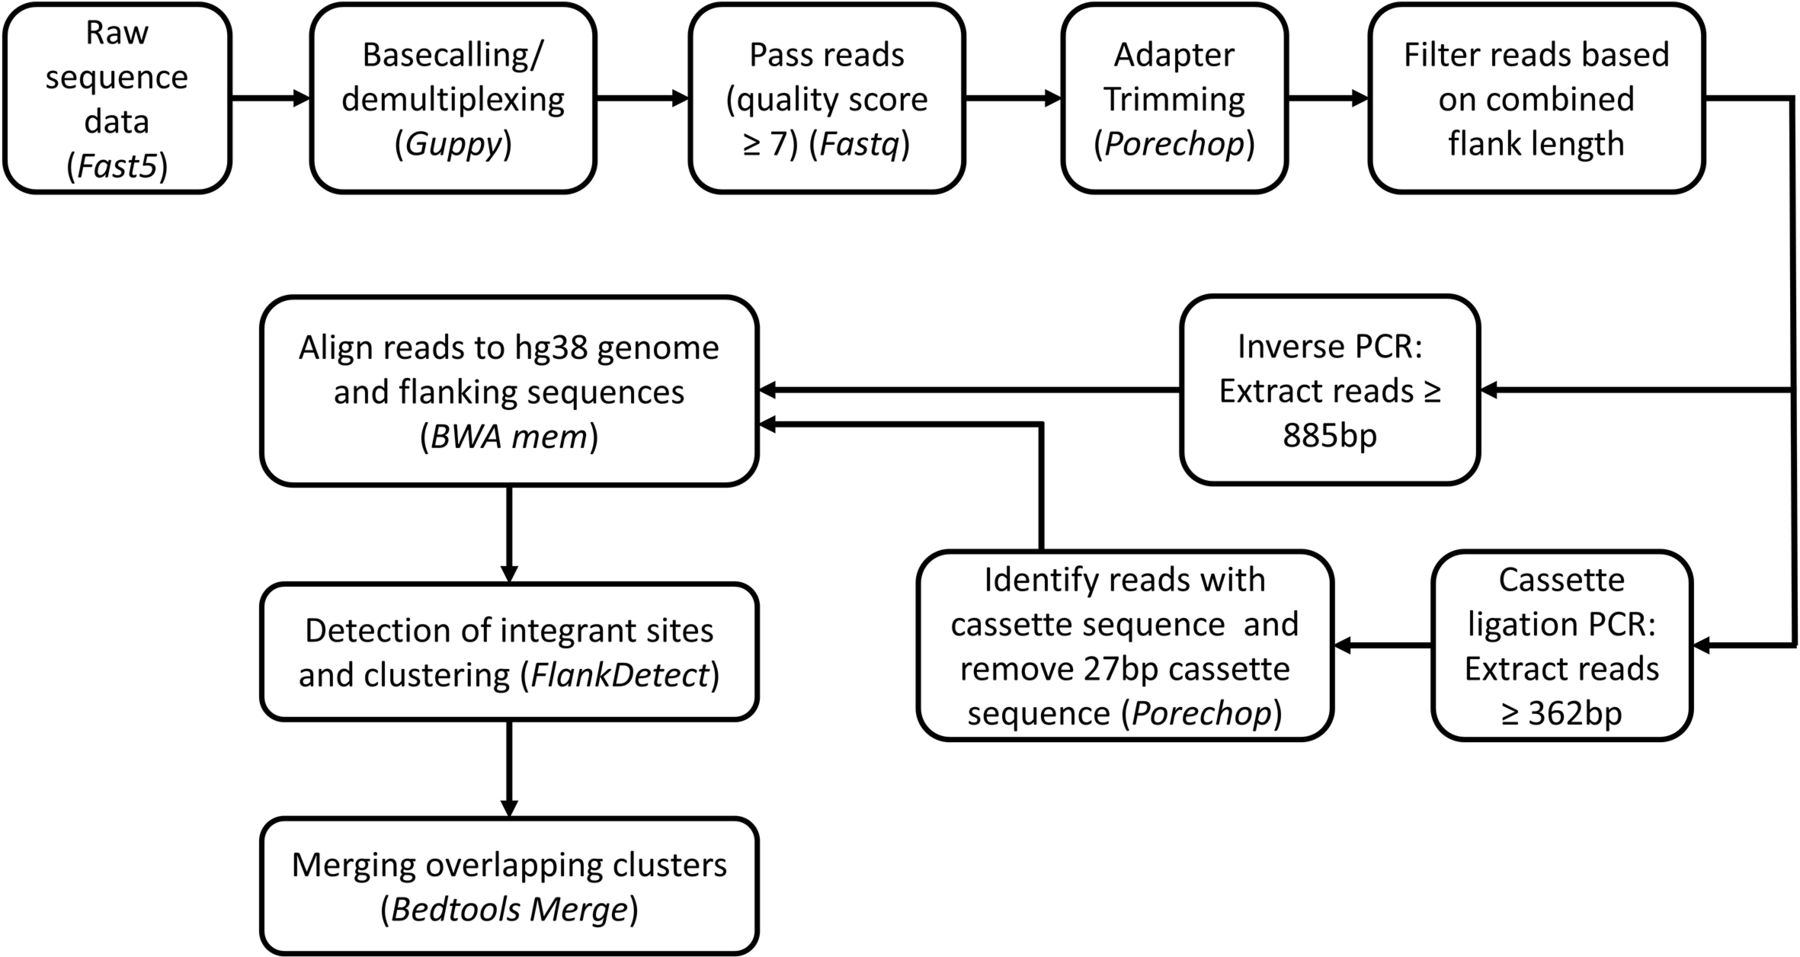
Flowchart for nanopore sequencing analysis. Tools used for analysis are italicized.
Annotation of integration sites
Genomic locations of transcription start site (TSS), exonic regions, intronic regions, and intergenic regions were extracted from GENCODE V.28 gene annotation file using custom scripts (online supplementary information). Genomic annotation of integration site was performed using Bedtools (V.2.26.0) intersect option. Genomic distance of the integration site from TSS was calculated using custom scripts (online supplementary information).
Results
Amplification of flanking DNA by inverse PCR and cassette ligation PCR
The amplicons from inverse PCR and cassette ligation PCR were predicted to have a sandwich structure: the flanking genomic sequence in the middle, which would be contiguous with the 3′LTR on one end, and the sticky-end ligated distal transgene sequence or linker cassette sequence on the other end (figure 2A). The theoretical minimum lengths of productive amplicons, including the tailing sequences, were 929 bp for inverse PCR and 406 bp for cassette ligation PCR. We performed flanking sequence amplification on non-transduced peripheral blood mononuclear cells (PBMC), and SFG.iCasp9.2A.ΔCD19-transduced Jurkat cell clones and polyclonal clinical samples from our previously published phase I clinical trial.15 There was no significant amplification of negative control non-transduced PBMC by inverse PCR (figure 2A., lane 0A) but there was some amplification by cassette ligation PCR (figure 2A, lane 0B). As expected, inverse PCR and cassette ligation PCR on transgenic Jurkat cell clones (clones 1 and 2) resulted in single PCR fragments (figure 2B: lanes 1A, 1B, 2A, 2B); and a 1:1 mixture of the two Jurkat cell clones resulted in a combination of the two bands (lanes 3A and 3B). Amplification of a polyclonal SFG.iCasp9.2A.ΔCD19-transduced clinical cell product yielded a polyclonal smear (lanes 4A and 4B), as did amplification of patient PBMC collected at Day 369 after T cell infusion (lanes 5A and 5B). However, amplification of patient PBMC from Day 1332 after T cell infusion showed a dominant band with inverse PCR and a polyclonal smear with cassette ligation PCR (lanes 6A and 6B), suggesting a possibility of bias in DNA fragment circularization or PCR amplification with the former. The inverse PCR amplicons in lanes 4A and 5A also contained bands that were shorter than the minimum theoretical length of 929 bp. These were later shown on nanopore sequencing to contain 3′LTR and transgene sequences without any intervening genomic DNA, which was consistent with the circularization of degraded DNA fragments near the 3′LTR.
Specificity of PCR amplification
A combination of two 6-cutters (NcoI and BspHI) is expected to cut at approximately every 2048 bp (ie, 46/2), generating an estimated 1.5×10⁶ DNA fragments per diploid human cell, which has a genome of approximately 3×10⁹ bp. Given that a majority of transgenic T cells carry only a small number of transgene inserts per cell, this would mean that only a tiny fraction (<0.005%) of the DNA fragments would include a transgene flanking sequence. Non-specific amplification of non-flanking sequences is therefore a challenge. As shown in figure 2A, specific PCR amplicons following both inverse PCR and cassette ligation PCR should contain a SmaI restriction site within the 3′LTR flanking sequence, with inverse PCR amplicons having an additional SmaI restriction site at the transgene end. Thus, SmaI restriction enzyme digestion of specific PCR amplicons is anticipated to yield a 244 bp DNA fragment from the 3′LTR end and, in the case of inverse PCR, an additional 391 bp DNA fragment from the transgene end, along with flanking genomic DNA fragments of variable lengths. We digested the PCR products with SmaI and confirmed that the amplicons from SFG.iCasp9.2A.ΔCD19-transduced samples were specific, with the generation of 244 bp and 391 bp fragments from inverse PCR and a 244 bp fragment from cassette ligation PCR (figure 2C). In contrast, SmaI digestion of PCR products from negative control non-transduced genomic DNA did not result in any specific 244 bp or 391 bp fragments (figure 2C, lanes 0A and 0B).
Nanopore output and read filtering
All 12 paired PCR products from the six samples were pooled into one nanopore sequencing run. In order to ensure adequate read-depth, the amount of input DNA was limited to the equivalent of less than 10,000 transduced cells per sample (see online supplementary table S2). Because the Jurkat samples were clonal and hence required fewer total reads, they were pooled with the polyclonal patient samples at a ratio of 1:10. The sequencing run produced 23.4 million reads in total and 59% of reads were classified as passing quality score (read quality ≥7). Approximately 6% of the pass reads could not be demultiplexed and were excluded. In most of the samples, >90% of the resulting reads were longer than the minimum theoretical length of 885 bp for inverse PCR and 362 bp for cassette ligation PCR after adapter trimming. A vast majority of the length-filtered reads were specific, with 95% (range 89%–98%) having both expected flanking sequences: the junctional 3′LTR flank on one end and the cassette or transgene sequence on the other end. Table 1 summarizes the number of reads retained after each data analysis step.
Number and proportion of reads after filtering and alignment
Sequence alignment and clustering
Greater than 94% of reads containing the expected flanking sequences from the transduced Jurkat cell lines (samples 1, 2, and 3) could be uniquely aligned to the genome (table 1). The genome alignment rate was lower for the polyclonal clinical samples, with 47%–74% (median 69%) of reads with the expected flanking sequences being successfully aligned. A majority of reads that could not be aligned to genomic DNA were only marginally longer than the minimum theoretical lengths of the PCR amplicons and were therefore too short to be uniquely aligned (figure 4A). Long unaligned reads generally lacked the anticipated flanking 3′LTR/transgene or cassette sequences and therefore represented non-specific amplicons. A significant proportion of inverse PCR amplicons in samples 4 and 5 were below the minimum theoretical lengths. Alignment of three dominant clones (560 bp, 388 bp, and 318 bp) showed that these consisted of the terminal regions of the flanking 3′LTR and transgene sequences, without any intervening genomic DNA (figure 4B), in an orientation that was consistent with the circularization and PCR amplification of degraded DNA fragments within the transgene/3′LTR region (figure 4C).

Read alignment and clustering. (A) Read-length distribution for the polyclonal clinical samples by inverse PCR (top row) and cassette ligation PCR (bottom row) relative to their respective minimum theoretical lengths of 885 and 335 bp (after cassette trimming). Shown are reads that were below the minimum theoretical length (black), reads that were above the minimum theoretical length but did not have the expected flanking sequences (orange), and reads with the expected flanking sequences that were aligned (green) or unaligned (blue) to genomic DNA. (B) Schematic representation of the dominant short inverse PCR amplicons in samples 4A (i and ii) and 5A (iii). Note that the junctions between the 3′LTR and transgene were formed by circularization of DNA fragments and were not the native junction. (C) Schematic representation of the formation of short amplicons from DNA fragments. (D) Distribution of number of reads per cluster. Shown are data for all 12 samples. (E) Span of 3′LTR-genome junction for clusters that contained two to four reads. ‘0’ indicates identical 3′LTR-genome junction for all reads within the cluster. (F) Span of 3′LTR-genome junction that includes 80% of reads in clusters that include five or more reads. (G) Number of clusters per clone after merging clusters with overlapping read alignment.
Aligned reads with 3′LTR-genome junctions that were within 10 bp of each other were clustered together using our customized tool, FlankDetect. The 4,895,820 reads were grouped into 12,186 clusters. Each cluster consisted of 1 to >106 reads: 59% of clusters had single reads, 24% of clusters had 2–10 reads, 7% of clusters had 11–100 reads, and the remaining 10% of clusters had >100 reads (figure 4D). For clusters with two to four reads, the 3′LTR -genome junction was identical in 24% of the clusters. The junction varied by one nucleotide in 28% of clusters, and by two to three nucleotides in 18% of clusters (figure 4E). Overall, for clusters with two to four reads, the spread of 3′LTR -genome junctions was within five nucleotides in 88% of the clusters, but a few clusters had a spread of 10 to 15 nucleotides. For clusters with ≥5 reads, we defined R80 as the span of 3′LTR -genome junction that contained at least 80% of reads within the cluster: 15% of clusters had R80 of 0 nucleotides, meaning 80% of the reads had identical 3′LTR-genome junction; and 80% of clusters had R80 of 1 nucleotide (figure 4F). Overall, for clusters with five or more reads, 97% had an R80 of ≤5 nucleotide, meaning 80% of reads within the clusters were within a span of five nucleotides, although there were isolated clusters with a spread of up to 40 nucleotides.
We observed that a proportion of the clusters were very proximate to each other. In some cases, the read alignments were very closely matched but the clusters were considered separate because the 3′LTR-genome junction was assigned to opposite ends of the read, which would suggest an underlying alignment error. In order to avoid splitting clonal integration sites into multiple artificial clones, clusters with overlapping read alignments were merged and considered as belonging to the same clone. Using this merging algorithm, we identified 6410 unique vector integration clones: 4440 clones (69%) consisted of only one cluster, 697 clones (11%) consisted of two clusters, 383 clones (6%) consisted of four clusters, and the remaining 890 clones (14%) consisted of four to 18 clusters (figure 4G).
Clonal composition by inverse PCR and cassette ligation PCR
Samples 1 and 2 each contained a unique vector integration site, which were detected by both inverse PCR and cassette ligation PCR. Note that both samples had a degree of subclonal contamination, which was more prominent on cassette ligation PCR than inverse PCR. Sample 3 consisted of an equal mixture of samples 1 and 2 but there was a dominance of the integration site from sample 2, with the bias being more pronounced by inverse PCR (figure 5A). The clinical samples were polyclonal: the cell product (sample 4) was anticipated to be the most clonally diverse, with some degree of clonal dominance emerging in the postinfusion patient samples (samples 5 and 6).15 The number of unique vector integration sites identified in samples 4, 5, and 6 were 979, 196, and 602 by inverse PCR and 2258, 1251, and 669 by cassette ligation PCR, with the starting materials containing approximately 7500, 4700, and 2500 iCasp9-transduced cells. In all three samples, clonal skewing was more pronounced with inverse PCR than cassette ligation PCR: the top 10 integration sites in samples 4, 5, and 6 accounted for 49%, 93%, and >99%, respectively, of the total aligned reads by inverse PCR; as compared with 7%, 58%, and 76% of the total aligned reads by cassette ligation PCR (figure 5B). A proportion of the integration sites were detected by both techniques but their percentage representation within the sample differed between the two techniques, and a majority of integration sites were mapped by only one of the techniques (figure 5C). The very large clone representing 97% of reads in sample 6 by inverse PCR, represented only 0.1% of the reads by cassette ligation PCR. This clone also had higher clonal representation by inverse PCR relative to cassette ligation PCR in samples 4 and 5 (0.08% vs 0.02%; and 0.44% vs 0.15%), suggesting amplification bias.

Clonal composition of vector integration sites. (A) Distribution of vector integration sites as a proportion of total aligned reads in iCasp9-transduced Jurkat cell clones. Shown are paired analysis by inverse PCR (top row) and cassette ligation PCR (bottom row). Samples 1 and 2 were two separate Jurkat cell clones, and sample 3 was a 1:1 mix of samples 1 and 2. Green and blue indicate different clones. Light green and light blue indicate subclones. (B) Distribution of vector integration sites as a proportion of total aligned reads in polyclonal clinical samples. Shown are paired analysis by inverse PCR (top row) and cassette ligation PCR (bottom row). Sample 4 was iCasp9-transduced cell product; and samples 5 and 6 were PBMC obtained at day +369 and +1332 after cell infusion, respectively. The top 10 clones for each sample are shown in color; with the remainder represented in white. The color representation is random and does not correspond to the same clones across different pie charts. (C) Overlap of unique vector integration sites identified by inverse PCR and cassette ligation PCR in the polyclonal clinical samples.figure 5C was plotted with R V.3.5.3 (venneuler package).
Location of integration sites within the genome
Vector integration sites were identified within all chromosomes, with higher representations within the larger chromosomes, as these represented a larger component of the total genome (figure 6A). A majority (61%–68%) of integration sites were intragenic, with 55%–58% within the introns, and 6%–12% within the exons; with the remaining 32%–39% of integration sites being intergenic (figure 6B). There was a predilection for vector integration near TSS (figure 6C), which was consistent with other reports.3 5 6 There was no predilection for vector integration near LTR73 and LTR76, which are human endogenous retrovirus sequences with some sequence similarity to the SFG vector LTR (online supplementary figure S1).

Distribution of unique vector integration sites within the genome as detected by inverse PCR (top) and cassette ligation PCR (bottom). Integration sites are annotated by (A) chromosomes, (B) gene coding regions (exons, introns, and intergenic), and (C) distance to transcription start sites (TSS). Median values were presented.
Discussion
Analysis of vector integration sites is currently restricted to highly specialized academic institutions where it is used largely as a research tool. However, gene-modified cellular therapeutics, especially CAR T cells, are rapidly entering routine clinical practice and vector integration site analysis would be required from time-to-time to monitor for the emergence of dominant clones. Many smaller clinical centers do not have access to expensive sequencing instrument and, furthermore, while short-read next-generation sequencing is cost effective for large batches, the cost per batch is very high. As a result, centers with low sample volumes will need to either run smaller batches at significantly higher cost per sample, or accumulate samples over a very long period of time for cost-effective batching, which reduces the timeliness of the analysis. In this paper, we showed that nanopore sequencing platform could be successfully utilized to map polyclonal vector integration sites.
Nanopore sequencing has been used by others to identify the transgene integration site in transgenic animals.19 In this setting, the transgene integrates within a single locus in the host cell genome but the changes are complex because microinjection of linearized DNA fragments into the pronucleus of zygotes typically results in multiple copies of the transgene inserted in tandem, often with complex internal structure, including transgene inversions, and contamination by Escherichia Coli genomic DNA, together with large deletions and other structural changes in the flanking host cell genome.19 20 Long-read whole genome sequencing by nanopore or other platforms can simultaneously identify the integration site and define these large, complex and tandem changes which are very difficult to resolve by short-read sequencing.19 In contrast, retrovirus-mediated transgene integration in clinical cell therapy is cleaner: each transgene integration site contains a single copy rather than tandem copies of the vector insert, without any large structural changes to the flanking genome. However, retrovirus-mediated somatic gene modification involves hundreds of thousands of parental cells, each with one or more distinct integration event, which results in a very large number of unique integration sites. These vector integration sites cannot be studied by whole genome sequencing; instead, some form of amplification or capture of the vector integrant together with the flanking genomic DNA is essential.
We used two different methods to amplify flanking genomic DNA: inverse PCR and cassette ligation PCR. Both methods used the same nested PCR primers at the 3′LTR flank (online supplementary table S1). The SFG backbone in SFG.iCasp9.2A.ΔCD19 was derived from Moloney Murine Leukemia Virus,21 22 which did not in evolution infect human and has minimum sequence similarity with human endogenous retroviruses (http://dfam.org).23 Thus, although elements from endogenous retroviruses constitute up to 8% of the human genome,24 the 3′LTR flank and the primers used in this analysis are specific to the vector. There are two human endogenous retrovirus sequences, LTR73 and LTR76, which have a degree of sequence similarity to the vector LTR; however, any non-specific amplicons that may arise from mispriming of these LTRs will be excluded from analysis because their degree of similarity to the vector LTR is <50%, which is below the 80% threshold set by our FlankDetect script.
Inverse PCR was slightly less demanding technically but has a higher potential for bias because efficient circularization is limited to DNA fragments of 300 bp to 3 kb, and secondary structure formation can further limit circularization efficiency. There is also competition between intramolecular circularization and intermolecular ligation, although this can be partially minimized using a dilute DNA ligation mix. In order to reduce bias, we adapted a previously described cassette ligation PCR method25 to amplify the flanking genomic sequences with high efficiency and specificity. This method had significantly less bias compared with the inverse PCR method but it was not completely bias-free as an equal mix of the two Jurkat clones did not produce equal representations of reads from each clone, although was less skewed than inverse PCR.
Our analysis considered clusters with any degree of overlap in read alignments as belonging to the same vector integration site. It is possible that this could erroneously merge proximate but distinct vector integration sites, resulting in an underestimation of clonal diversity. We have developed our clustering protocol to err on the side of over-clustering because a key function of vector integration site analysis is to detect clonal dominance, which can sometimes indicate autonomous growth or insertional mutagenesis, and it is therefore important to avoid splitting single integration sites into multiple artificial clones. The number of unique integration sites mapped in our study was consistent with those using LAM-PCR followed by next-generation short-read sequencing, which typically detects around 200 to 8000 unique integration sites from 103 to 106 transduced T cells.3 5 6 However, in our analysis of polyclonal clinical samples using inverse PCR and cassette ligation PCR in parallel, only 7% of unique vector integration sites could be detected by both methods. This low level of overlap was likely a result of both PCR amplification bias and sampling artifact. Gene-modified T cells, including iCasp9-transduced T cells, have been shown to be highly polyclonal by T cell receptor15 26 and vector integration site analysis.3 15 We and others have detected 103 to 104 unique clonotypes within aliquots of infused cell products and postinfusion patient samples in T cell therapy trials using gammaretroviral vectors.3 6 15 The actual clonal richness is likely much higher if a very large number of cells can be sampled and sequenced at depth without bias. The likelihood of a particular clone being randomly sampled twice is a function of its clonal frequency and the sample size. In this study, the amount of input DNA in the polyclonal clinical samples represented <0.001% of the total pool of transduced cells; hence, our observation that only a small proportion of clones could be detected by both inverse PCR and cassette ligation PCR was consistent with the anticipated low likelihood of a particular clone being randomly sampled into both reaction mixtures. Nonetheless, the large differences in the clonal size of the identified overlapping clones would suggest that there was also significant contribution from amplification or sequencing bias.
In studies using gene-modified T cells, clonality can also be assessed by T cell receptor clonotype analysis. Although this remains an expensive assay, it is somewhat more accessible and can be outsourced to commercial entities. T cell receptor clonotype can provide a good indication of the clonal diversity of the transduced cells because clones bearing the same vector integration sites will bear the same T cell receptor clonotype. In our previous publication, clonal diversity as determined by vector integration site analysis using inverse PCR followed by nanopore sequencing closely correlated with clonal diversity by T cell receptor analysis.15 However, T cell receptor analysis does not provide any information on the nature of the vector integration sites and cells with the same T cell receptor clonotype can sometimes carry different vector integration sites through separate transduction events.15 27
The amount of data that can be generated and the feasibility to scale as required make nanopore sequencing an attractive option for analysis of vector integration sites. In this report, we reused an ONT PromethION flow cell and obtained 15 Gb of sequencing data, which was sufficient to analyze six polyclonal and six oligoclonal samples, with >5500 unique integration sites identified. Based on this estimate, the smaller ONT MinION flow cell, which costs around US$500–900 and capable of generating 20–30 Gb of sequencing data, could be used to sequence 12 polyclonal samples; whereas the larger ONT PromethION flow cell, which costs around US$1600–2000 and capable of generating around 80–100 Gb of sequencing data, would be suitable for larger batches. There is also now a very small ONT Flongle that is capable of 1.8 Gb of sequencing data at a cost of US$90 each, which may be suitable for single sample analysis. The sequencing cost for short-read next-generation sequencing is highly dependent on scale: larger, higher throughput instruments are much more cost efficient per unit of sequencing data but the cost per run is much higher. For example, short-read Illumina sequencing instruments come in a range of sizes, each with a choice of kits with different levels of output and cycle lengths. The cost for 150-cycle or 300-cycle kits that are typically used for this application ranges from US$1050–1200 for 3.5–5 Gb of sequencing data on an Illumina MiSeq instrument; to US$1250–5300 for 20–120 Gb of sequencing data on the larger Illumina NextSeq instrument; and US$6500–12,000 for 375–750 Gb of sequencing data on the even larger Illumina HiSeq instrument. Instrument access charges typically add 30–100% to the sequencing cost.
The data obtained from the different sequencing platforms cannot be directly compared: short-read next-generation sequencing provides better read quality than nanopore sequencing but their short-read lengths can limit their capacity to be uniquely aligned, especially when part of the read has been taken up by the flanking vector sequence. This caveat aside, the sequencing cost for 12 samples, yielding 20 Gb of sequencing data, is estimated at US$1650–2540 on an Illumina NextSeq, which consists of US$1250 for a mid-output 150-cycle kit plus 30–100% in facility charges; as compared with US$500–900 on a Nanopore MinIon, which has negligible capital cost and no access charges. The reagent cost for library preparation is around US$60–80 per sample for both nanopore and short-read next-generation sequencing.
A distinct advantage of nanopore sequencing is its low cost of entry as it does not require any dedicated sequencing instrument, making it highly feasible for smaller centers. These features are of immense relevance in the context of current developments in the CAR T cell field, which have seen their emergence from large dedicated academic research centers into routine implementation in smaller clinical centers where the ability to perform vector integration site analysis in a timely manner, with flexibility of scale, can be clinically important. The total assay time is under 4 days: one-and-a-half days to complete ligation and nested PCR, and 2 days for library preparation, sequencing, and data analysis.
The main drawback of nanopore sequencing is its high error rate. This limits its ability to confidently map the 3′LTR-genome junction at single nucleotide resolution. Nonetheless, a majority of clusters could be resolved within a 5-nucleotide span and 94% of clusters with five or more reads could be resolved within one nucleotide span. The resolution will likely improve with evolution in the technology platform and refinement in the assay design and data analysis. At present, the higher error rate also meant that relatively long stretches of flanking DNA sequence are required for successful alignment. The length of the flanking DNA sequence is predetermined by the position of the restriction site and hence integration sites that are very close to the restriction sites will always be very difficult to align. However, it may be possible to perform parallel analysis using different sets of restriction enzymes or tagmentation without restriction enzymes to increase the proportion of aligned reads.5 6
In summary, we have developed a readily accessible, highly scalable, low cost, and low capital method to analyze vector integration sites within a polyclonal sample using nanopore sequencing. This platform has the potential to become a practical alternative to short-read next-generation sequencing, especially for smaller clinical centers with low volume throughput where flexibility of scale and timeliness of results are important.
Acknowledgments
The authors acknowledge the advice from Dr Edmund Chang, previously at the Center for Cell and Gene Therapy, Baylor College of Medicine, Houston, Texas, USA, who suggested using nanopore sequencing for this purpose. The authors are grateful to the patients and their families for their participation in the associated phase I clinical trial.
References
Footnotes
PZ and DG are joint first authors.
LJC and S-KT are joint senior authors.
Contributors LJC and S-KT designed the study. PZ, DG, and RA performed experiments. DG, SHN, and LJC performed analysis of sequencing data; and PZ and S-KT analyzed the annotated data. PZ, DG, LJC, and S-KT wrote the manuscript.
Funding This work was supported by a Project Grant (APP1053135) from the National Health and Medical Research Council (NHMRC, Australia) and Royal Brisbane and Women's Hospital Foundation. S-KT was supported by an NHMRC Early Career Fellowship (APP1054786) and Metro North Hospital and Health Service Clinician Research Fellowship. LJC was supported by an NHMRC Career Development Fellowship (APP1130084).
Competing interests None declared.
Patient consent for publication Written informed consent was obtained from all subjects.
Ethics approval The associated clinical trial and use of study samples were prospectively approved by the Human Research Ethics Committee (Institutional Review Board) of Royal Brisbane and Women's Hospital. The clinical trial was conducted in accordance with the Declaration of Helsinki and the Australian National Statement on Ethical Conduct in Human Research.
Provenance and peer review Not commissioned; externally peer reviewed.
Data availability statement Data are available upon reasonable request