Article Text

Abstract
Background The immune response to cancer is often conceptualized with the cancer immunity cycle. An essential step in this interpretation is that antigens released by dying tumors are presented by dendritic cells to naive or memory T cells in the tumor-draining lymph nodes. Whether tumor cell death resulting from cytotoxicity, as mediated by T cells or natural killer (NK) lymphocytes, is actually immunogenic currently remains unknown.
Methods In this study, tumor cells were killed by antigen-specific T-cell receptor (TCR) transgenic CD8 T cells or activated NK cells. Immunogenic cell death was studied analyzing the membrane exposure of calreticulin and the release of high mobility group box 1 (HMGB1) by the dying tumor cells. Furthermore, the potential immunogenicity of the tumor cell debris was evaluated in immunocompetent mice challenged with an unrelated tumor sharing only one tumor-associated antigen and by class I major histocompatibility complex (MHC)-multimer stainings. Mice deficient in Batf3, Ifnar1 and Sting1 were used to study mechanistic requirements.
Results We observe in cocultures of tumor cells and effector cytotoxic cells, the presence of markers of immunogenic cell death such as calreticulin exposure and soluble HMGB1 protein. Ovalbumin (OVA)-transfected MC38 colon cancer cells, exogenously pulsed to present the gp100 epitope are killed in culture by mouse gp100-specific TCR transgenic CD8 T cells. Immunization of mice with the resulting destroyed cells induces epitope spreading as observed by detection of OVA-specific T cells by MHC multimer staining and rejection of OVA+ EG7 lymphoma cells. Similar results were observed in mice immunized with cell debris generated by NK-cell mediated cytotoxicity. Mice deficient in Batf3-dependent dendritic cells (conventional dendritic cells type 1, cDC1) fail to develop an anti-OVA response when immunized with tumor cells killed by cytotoxic lymphocytes. In line with this, cultured cDC1 dendritic cells uptake and can readily cross-present antigen from cytotoxicity-killed tumor cells to cognate CD8+ T lymphocytes.
Conclusion These results support that an ongoing cytotoxic antitumor immune response can lead to immunogenic tumor cell death.
- immunology
- oncology
This is an open access article distributed in accordance with the Creative Commons Attribution Non Commercial (CC BY-NC 4.0) license, which permits others to distribute, remix, adapt, build upon this work non-commercially, and license their derivative works on different terms, provided the original work is properly cited, appropriate credit is given, any changes made indicated, and the use is non-commercial. See http://creativecommons.org/licenses/by-nc/4.0/.
Statistics from Altmetric.com
Background
Antitumor immunity largely relies on effector cytotoxic T or natural killer (NK) cells.1 Tumor cells may succumb on contact with activated cytotoxic lymphocytes as a result of pores formed by polyperforin that permit the entrance of granzyme B to activate caspase-dependent apoptosis.1 2 Furthermore, activated cytotoxic cells exhibit tumor necrosis factor-family proapoptotic ligands such as Fas ligand (FASL)3 and TNF-related apoptosis inducing ligand (TRAIL)4 that may elicit processes of apoptosis in the tumor cells.1 Following contact with cytotoxic effector cells, target-cells undergo loss of viability and progressive disruption of their structures and organelles. These cellular remains are referred to as dead cells and target-cell debris.
Under normal circumstances, apoptosis is considered a form of immunologically silent programmed cell death. In tumor immunotherapy, it becomes important to know if cytotoxicity would be tolerogenic or, on the contrary, immunogenic to sustain and diversify the immune response. In fact, immunogenicity of tumor cell death coupled to release of intracellular tumor antigens has been postulated in the so-called cancer immunity cycle.5 6
Immunogenic versus non-immunogenic death of tumor cells has been extensively investigated by the groups of Kroemer et al.7 8 Following incisive experiments in mice9 which correlated with clinical findings, immunogenic cell death was categorized as being able to enhance T-cell recognition of tumor antigens thereby delaying tumor growth in immunocompetent but not in immunodeficient mice.10 Mechanistic and correlative experiments linked immunogenic cell death to the endoplasmic reticulum stress response, and to the release or exposure of eat-me signals and alarmins that act on dendritic cells to induce functional maturation into cells efficiently presenting tumor antigens.11 Calreticulin exposure on the plasma membrane,12 adenosine triphosphate (ATP) release,13 14 high mobility group box 1 (HMGB1) release,15 extracellular mitochondrial formyl peptides16 are considered hallmarks of immunogenic cell death.10 These findings are reminiscent of the danger model as postulated by Matzinger, which predicts that factors released on tissue damage or cell stress are responsible for immunogenicity.17 18 These are termed damage-associated molecular patterns (DAMPs).19
The main inherent mechanism to turn on and sustain CD8 T-cell immunity is tumor-antigen cross-priming as mediated by basic leucine zipper ATF-like transcription factor 3 (BATF3)-dependent conventional dendritic cells type 1 (cDC1) dendritic cells.20 21 These cells are able to capture antigens from cell-death-associated debris and present such exogenous antigens via the major histocompatibility complex (MHC) class I in the context of both costimulation and interleukin-12 (IL-12) production.20 21 Of note, these cDC1 cells closely cooperate with NK cells in the tumor microenvironment to elicit antitumor immunity.22 23
Our quest in this study was to ascertain if cytotoxicity as mediated by CD8 T cells or NK cells is a form of immunogenic cell death or not. Multiple lines of experimental evidence laid before us in mouse models unequivocally show that cytotoxicity is indeed a form of immunogenic cell death, since the remains of killed cells efficaciously induce antitumor immunity.
Methods
Mice and cell lines
Experiments involving mice were approved by the Ethics Committee of the University of Navarra. C57BL/6 mice (5–8 weeks old, female) were obtained from Envigo (Huntingdon, Cambridgeshire, UK) and maintained in the animal facility of Cima Universidad de Navarra. C57BL/6 Batf3tm1Kmm/J (Batf3KO), Tmem173gt/J (STINGKO), interferon-α (IFNα)/bRo/o (IFNARKO), C.129S7(B6)Tag1tm1Mom/J (RAG1), B6.Cg-Thy1a/CyTg(TcraTcrb)8Rest/J (Pmel-1),24 C57BL/6-Tg(TcraTcrb)1100Mjb/J (OT-I), C57Bl/6 Tg14(act/EGFP)Osby (OT-I-enhanced green fluorescent protein (EGFP)) mice were bred at Cima Universidad de Navarra in specific pathogen-free conditions. Batf3 KO,25 Sting1 KO26 and Ifnar1 KO27 mice were kindly provided, respectively, by Kenneth M Murphy (Washington University, St. Louis, MO), by Gloria González Aseguinolaza (Cima Universidad de Navarra, Pamplona, Spain) and by Matthew Albert (Institut Pasteur, Paris, France). The MC38hEGFR cell line was kindly provided by Pablo Umaña (Roche). This cell line was stably transfected with Lipofectamine 2000 (Thermo Fisher Scientific, San Jose, California, USA) with pCI-neo plasmid expressing membrane-bound ovalbumin (OVA) (#25099, Addgene, Cambridge, Massachusetts, USA). MC38hEGFROVA clones were established by limiting dilution. MC38hEGFROVA was chosen because of suitability for ADCC experiments and convenience for detection but control replicate experiments to those shown in figure 1 with MC38OVA without EGFR were performed rendering comparable results. OVA expression was confirmed by intracellular OVA staining (ab85584, Abcam, Cambridge, UK) and real-time PCR. The MC38hEGFROVA, EG7, MC38, B16OVA, CHO FLT3-L FLAG cell lines were maintained at 37°C in 5% CO2 and were grown in Roswell Park Memorial Institute medium (RPMI) Medium 1640+Glutamax (Gibco Invitrogen, Carlsbad, California, USA) containing 10% heat-inactivated fetal bovine serum (FBS) (Gibco), 100 IU/mL penicillin and 100 µg/mL streptomycin (Gibco) and 50 µM 2-Mercaptoethanol (Gibco). The MC38hEGFROVA cell line was grown with 6 µg/mL of Puromycin (Gibco) and 400 µg/mL of Geneticin (Gibco). To avoid loss of transgene expression, B16OVA and EG7 were maintained with 400 µg/mL of Geneticin.

Cellular cytotoxicity induces the release of danger-associated molecular patterns by dying cancer cells in culture. (A) MC38hEGFROVA cells were incubated for 48 hours with IFNγ (15 UI/mL) and gp100 peptide (100 ng/mL). Subsequently, in vitro preactivated Pmel-1-derived splenocytes were added at a ratio of 10:1. calreticulin surface expression on dying tumor cells (CD45- 7-AAD-) was analyzed after 24 hours by flow cytometry. Representative experiments are presented in dot plots and histograms indicating MFI. (B) Supernatants from the cocultures were analyzed for the concentration of HMGB1 by ELISA. As controls, tumor cells, or T cells with or without pulsed peptide were used. Data are mean±SEM n=4 for coculture with peptide and n=5 for other groups (C) MC38hEGFROVA cells were incubated with in vivo activated NK cells at a ratio of 3.5:1 for 24 hours. Subsequently, calreticulin surface expression on dying tumor cells (CD45- 7-AAD-) was analyzed by flow cytometry. Representative experiments are presented in dot plots and histograms indicating MFI. (D) HMGB1 concentrations in the supernatant were determined by ELISA. As controls, tumor cells or NK cells alone were used. Data are mean±SEM n=5 for all groups. One-way ANOVA test with Tukey’s multiple comparisons tests, ***p<0.001. Results are representative of at least two experiments performed. ANOVA, analysis of variance; HMGB1, high mobility group box 1; IFNγ, interferon-γ; MFI, mean fluorescence intensity; NK, natural killer; CTLs. cytotoxic T lymphocytes; AF647, Alexa Fluor 647.
The HT29 cell line was cultured as other cells but without 2-mercaptoethanol supplementation in the culture medium.
X-63 granulocyte macrophage-colony stimulating factor (GM-CSF) was grown in Iscove’s modified Dulbecco medium (Sigma-Aldrich, St. Louis, Missouri, USA) supplemented with 1 mg/mL of Geneticin with 5% FCS, 100 IU/mL penicillin and 100 µg/mL streptomycin.
Murine lymphocyte activation
Spleens from euthanized Pmel-1 mice were excised and splenocytes isolated mechanically and cultured at a concentration of 1.5×10⁶/mL for 48 hours with 100 ng/mL of human gp10025-33 (KVPRNQDWL, RP20344, GenScript, Piscataway, New Jersey, USA). After 48 hours, we added fresh media and 30 IU/mL of IL-2 (Proleukin, Novartis) and kept the culture for 48 hours.
To generate murine activated NK cells, we injected at a high hydrostatic pressure into the tail vein of RAG1 mice 10 µg of Apo-Sushi-IL-15 expressing plasmid28 in 2 mL of physiological saline solution. We harvested spleens after 3 days and isolated murine NK cells by negative selection following the manufacturer’s instructions (NK Cell Isolation Kit II mouse, Miltenyi Biotec, Bergisch Gladbach, Germany).
In vitro killing
To obtain T cell-derived tumor debris, MC38hEGFROVA cells were incubated for 48 hours with 15 IU/mL of murine IFNγ (Miltenyi Biotec) to increase expression of MHC-I and 100 ng/mL of human gp100 peptide (KVPRNQDWL). Of important note, freeze and thaw as well as doxorubicin-killed cells were also preincubated with IFNγ. Following activation during 48 hours, Pmel-1 splenocytes were mixed with MC38hEGFROVA at a ratio of 10:1 in the presence of 30 IU/mL of IL-2 and 100 ng/mL of human gp100 and cultured for 3 days.
To obtain NK cell-derived tumor debris, in vivo activated NK cells (following the protocol described above) were cocultured with MC38hEGFROVA cells at a ratio of 3.5:1 with 200 IU/mL of IL-2 for 3 days.
Cell debris was washed twice in ice-cold phosphate buffered saline (PBS) and pellets resuspended in ice-cold PBS to be used in the immunization experiments.
To remove cytotoxic effector cells from the immunizing debris in the indicated experiments, debris was treated for 60 min in 5 mL of distilled H2O and washed with PBS buffer following centrifugation at 4000 rpm for 10 min at 4°C.
Cytotoxic NK and cytotoxic T lymphocytes (CTLs) were studied by FACS using the following fluorochrome-tagged antibodies: anti mouse CD3 phycoerythrin (PE)-Cy7 (17A2, 1:200, Biolegend, San Diego, CA), CD8 BV510 (53–6.7, 1:200, Biolegend), PD1 FITC (29F.1A12, 1:200, Biolegend), Tim3 PerCP-Cy5.5 (RMT3-23, 1:200, Biolegend), CD137 APC (17B5, 1:200, Biolegend), NK.1.1 PerCP-Cy5.5 (PK136, 1: 200, Biolegend), NKp46 APC (29A1.4, 1:200, Biolegend), KLRG1 BV421 (2F1/KLRG1, 1:200, Biolegend), NKG2D biotinylated (MI-6, 1: 200, eBiosciences, San Diego, California, USA), Streptavidin Alexa Fluor 488 (1:100, Biolegend), DX5 PE (DX5, 1:200, BD Biosciences, San Jose, CA). Dead cells were excluded with Zombie Nir (Biolegend) staining.
Immunogenic cell death markers
We set up cocultures of tumor cells and murine T cells or murine NK cells as described above, and 24 hours later, supernatants were collected for HMGB1 detection by ELISA (IBL International, Hamburg, Germany) or stored at −80°C until use. Tumor cells were analyzed for calreticulin expression. Cells were washed with Staining Buffer (0.5% FBS, 0.5% ethylenediaminetetraacetic acid (EDTA) 0.5 M, 1% penicillin/streptomycin) and stained for 30 min on ice with a mix containing: anti-mouse CD16/32 (S17011E, 1:100, Biolegend), CD45BV510 (30-F11, 1: 200, Biolegend) and Calreticulin Alexa Fluor 647 (1:100, Abcam). Cells were then washed and stained with a mix of AnnexinV FITC (1:200, Biolegend) and 7-aminoactinomycin D (7-AAD) (1:75, Biolegend) in Annexin Binding Buffer (Biolegend) for 15 min at RT.
Human peripheral blood mononuclear cells were isolated by density gradient separation (Ficoll-Paque Plus, GE Healthcare, Chicago, Illinois, USA) from healthy donor whole blood. T and NK cells were separated using magnetic beads (human CD8+ T cell isolation kit or human NK Cell Isolation Kit, Miltenyi Biotec).
5×10⁴ human T cells were cocultured with HT29 (1:1) in 96 U bottom plate in 200 µL of complete medium with or without 1 µg/mL epithelial cell adhesion molecule (EpCAM)-CD3 bi-antibody (Creative Biolabs, Shirley, New York, USA) for 48 hours.29
Human NK cells immunomagnetically selected as CD3-CD56+ were preactivated 48 hours with 100 IU/mL IL-2 and 10 ng/mL of IL-15 (Peprotech, Rocky Hill, New Jersey, USA) in NK MACS medium (Miltenyi). Forty-eight hours later, 8.5×10⁴ NKs were incubated with HT29 (1:1) for 48 hours in 1 mL of complete medium in 12-well plates.
Supernatants were collected for HMGB1 detection by ELISA (IBL International), and tumor cells were analyzed for surface calreticulin expression as described above (Human IgG, 1:100 CD45, 2D1, FITC, Biolegend, 1:500—Calreticulin Alexa Fluor 647, Abcam, 1:100 - Annexin V PE, Biolegend, 1:100—7AAD, Biolegend, 1:75).
Immunization experiments
A total of 1.2×10⁶ tumor cells killed in different ways (10:1 for T cells, 3.5:1 for NK cells, doxorubicin (Sigma Aldrich) or FT were resuspended in 200 µL of PBS (Gibco) and injected subcutaneously above the tail. After 7 days, we subcutaneously challenged mice with 5×10⁵ EG7 in the right flank.
Positive control with doxorubicin was performed treating cells with 2.5 µM of Doxorubicin for 24 hours.9 For T cell-derived debris immunization experiments, doxorubicin-treated cells were also pulsed with 100 ng/mL of human gp100 synthetic peptide.
Control FT was generated by killing cells by three cycles of dry-ice and immersion in a 37°C bath. To prepare debris for immunization, all 4×10⁵ cells were incubated with 300 ng of human gp100 peptide for 1 hour at 37°C before being killed by freeze/thawing.
Tumor growth was monitored twice a week with an electronic caliper. Mice were sacrificed when the tumor reached 18 mm.
Detection of antigen-specific T cells
At day seven postimmunization, whole blood was drawn from mice, and 100 µL of peripheral blood were stained with H-2Kb OVA PE (iTag MHC Tetramer, 1:200, MBL International, Woburn, Massachusetts, USA), anti-mouse CD16/32 (S17011E, 1:100) for 15 min at 4°C. Without washing, we added 5 µL of a mix of CD8 Alexa Fluor 647 (53–6.7, 1:200, Biolegend) and incubated samples for 15 min at 4°C. Erythrocytes were eliminated by adding 1 mL of FACS Lysing Solution (BD) per sample for 5 min at RT.30 31 Samples were acquired at BD FACS Canto II system and analyzed with Flow Jo 10 software (Treestar, San Carlos, California, USA).
Subcutaneous in vivo killing
Splenocytes from OT-I mice were plated at 1.5×10⁶/mL and activated for 48 hours with SIINFEKL peptide (OVA257-264, Invivogen, San Diego, California, USA). Two days later, we added fresh new medium and 30 IU/mL of IL2. After 48 hours, 5×10⁵ MC38hEGFROVA were injected with 107 activated OT-I splenocytes (20:1) into the right flank of C57BL/6 mice. After 7 days, we challenged mice by injecting 5×10⁵ MC38 cells into the left flank. Tumor growth was monitored twice a week with an electronic caliper. Mice were sacrificed when the tumor reached 18 mm.
Subcutaneous in vivo killing imaging
In vivo killing control was performed injecting subcutaneously into the ear of C57BL/6 mice, preactivated splenocytes from OT-I EGFP mice, and DRAQ 5 (Thermo Scientific) stained MC38hEGFROVA cells (20:1).
Mice were anesthetized with ketamin/xylazine and subsequently, ears were depilated with Veet cream. After extensive rinsing, mice were placed on a custom made microscopy stage with the ears placed on top of a cover glass. Images were taken in an LSM880 inverted microscope (Zeiss, Oberkochen, Germany) equipped with a 25x Objective LD LCI Plan APO N/A 0.8. DRAQ 5 was excited with and HeNE 633 laser, and OT-I EGFP cells were excited with a 488 Argon laser. Images were then acquired and analyzed with the Zen software (Zeiss). Linear gamma correction was applied to both the DRAQ 5 and EGFP channel to eliminate skin background in all images.
Bone marrow-derived CD103+cDC1
Bone marrow cells were harvested from femurs and tibiae of C57BL/6 mice and 15×106 cells were cultured in a sterile Petri dish (Sarstedt, Nümbrecht, Germany) in 10 mL of medium (RPMI Medium 1640+Glutamax + containing 10% heat-inactivated FBS +100 IU/mL penicillin and 100 µg/mL streptomycin +50 µM 2-Mercaptoethanol) containing 45% and 1.25% of FLT3-L32 and GM-CSF33 enriched supernatants, respectively, produced by the CHO FLT3-L FLAG and X-63 GM-CSF cell lines. At day 5, complete medium without enriched supernatants was added. At day 9, non-adherent cells were harvested, and 3×10⁶ cells were replated in 10 mL of complete medium with enriched supernatants as at day 0.34
Confocal microscopy assessment of cytotoxicity debris uptake
T cell-derived and NK cell-derived debris was obtained as described before using in this case MC38 mCherry+ cells as targets. After 16 hours we added to cocultures bone marrow-derived dendritic cells (DCs:Tumor cells=1:2) prestained with fluorochrome-labeled antibodies (CD11b FITC, 1:200, XCR1 APC 1:100). We incubated lysates and DCs for 2.5 hours. Engulfment of cells debris by DCs has been analyzed at LSM800 with Airyscan (Zeiss) equipped with a Plan-Apochromat 63x/1.40 Oil DIC M27 Objective and quantification has been performed using ImageJ software.
In vitro cross-presentation
T cell-derived and NK cell-derived debris was obtained as described before. After 16 hours, we added 4×10⁵ BM-derived CD103+ cDC1. After 3 hours, we stained (CD11c APC, N418, 1:200, Biolegend—CD103 PerCP-Cy5.5, 2E7, Biolegend, 1:100—SYTOX green Nucleic Acid Stain, Thermo Fisher, 1:200000) the samples for flow cytometry-based sorting (FACSAria III, BD) and isolated alive CD11c+CD103+ DCs. DCs were incubated at a ratio of 1:5 with OT-I mice-derived splenocytes previously labeled with Violet Cell Proliferation Dye 450 (BD) according to the kit protocol for assessing to antigen-specific proliferation. After 72 hours, we checked CD8+ cell proliferation by flow cytometry.30 31 Samples were acquired using a BD FACSCanto system and analyzed with Flow Jo 10 software.
Statistical analysis
GraphPad Prism V.6.01 software (GraphPad Software, San Diego, California, USA) was used for statistical analysis. We used the log-rank test to determine the significance of differences in tumor development curves. Mean differences were compared with t-tests for two group comparisons or one-way analysis of variance, followed by Dunnet multiple comparison tests for three or more group comparisons. P<0.05 were considered to be statistically significant.
Results
Cytotoxic T lymphocytes and NK cells induce features of immunogenic cell death on tumor cells
Immunogenic cell death is characterized by the release or exposure on the cell surface of different DAMPs that help prime an antitumor immune response. We focused our characterization of immunogenic cell death on two of its most prominent hallmarks.10 First, we analyzed the exposure on the cell membrane of calreticulin, which is localized in the endoplasmic reticulum in the steady-state but becomes relocated to the cell surface as a result of reticulum stress responses. Furthermore, we studied the release from the nucleus of HMGB1 to the supernatant. To achieve a complete cytotoxic killing of the MC38hEGFROVA cell line, tumor cells were pretreated with IFNγ to upregulate surface MHC I expression and loaded with the immunodominant human gp100 peptide. Under these conditions, in vitro preactivated T-cell receptor (TCR)-transgenic Pmel-1-derived CD8+ splenocytes were able to induce over 95% tumor cell death (online supplementary figure 1). The mean fluorescence intensity of calreticulin surface exposure on dying tumor cells defined as CD45- 7AAD- was 10-fold higher than the calreticulin found on dying tumor cells from cell cultures in the absence of cytotoxic lymphocytes (figure 1A). Moreover, the supernatants of cocultures of gp100 preloaded tumor cells with preactivated Pmel-1-derived CD8+ splenocytes contained large amounts of HMGB1, a finding not observed in any of the control conditions (figure 1B).
Supplemental material
Thus, T lymphocyte-mediated cytotoxicity induces features considered hallmarks of immunogenic cell death.10 We next addressed whether other cytotoxic immune cells, such as NK cells, induced the exposure of calreticulin and the release of HMGB1. In these experiments, the MC38hEGFROVA tumor cells were not preconditioned, but NK cells were activated and expanded in vivo by hydrodynamic gene transfer to the liver of a plasmid encoding a fusion protein of IL-15.28 35 The in vivo preactivated NK cells were able to extensively lyse tumor cells (online supplementary figure 2). The tumor-cell debris obtained after NK-cell lysis showed enhanced mean fluorescence intensity for calreticulin shining on the plasma membrane. The content of HMGB1 released into the supernatant was markedly increased as had been observed with cytotoxic T lymphocytes (figure 1C,D).
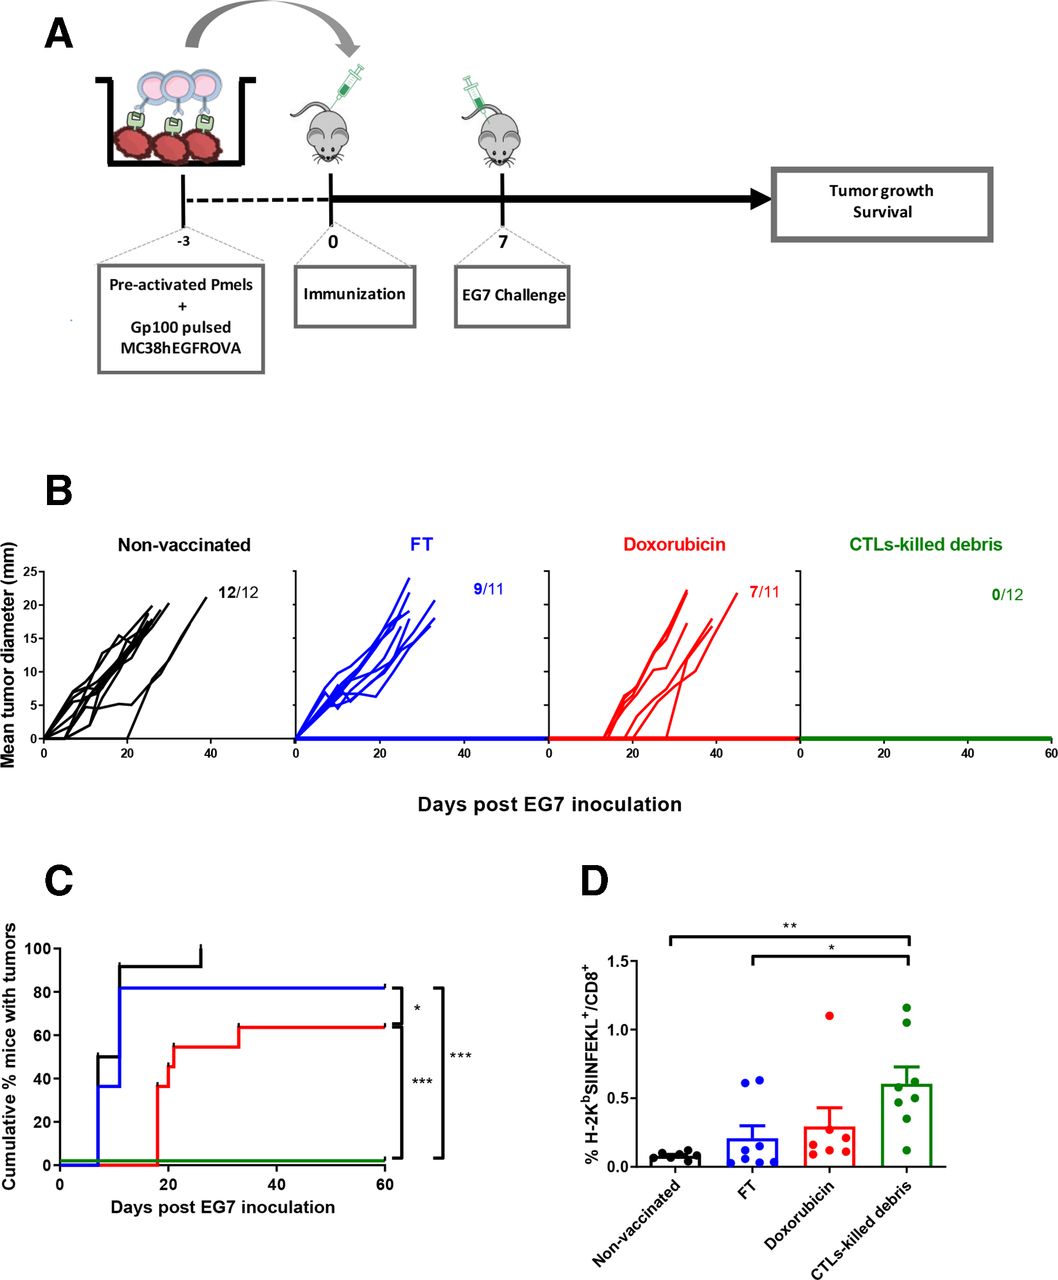
Tumor cells killed by cytotoxic T cells are immunogenic. (A) MC38hEGFROVA cells were incubated 48 hours with IFNγ (15 UI/mL) and gp100 peptide (100 ng/mL). At day −3, tumor cells and activated Pme1-1 CTLs were cocultured. At day 0, the result of the coculture was injected subcutaneously into wild-type C57BL/6 mice. Seven days later, mice were challenged with injection of 5×10⁵ EG7 cells into the right flank, and tumor growth and survival were monitored. (B) Individual EG7 tumor growth. Non-vaccinated group was mock immunized with saline. FT group was immunized with the tumor cell debris obtained from three freeze/thaw cycles. The doxorubicin positive control group was immunized with tumor cells killed in culture with 2.5 µM doxorubicin for 24 hours. (C) Curves showing the percentage of tumor-free mice at different time points. Log-rank test, *p<0.05, **p<0.01 and ***p<0.001. (D) At day 7, peripheral blood was collected, and OVA-specific CD8+ T cells were assessed by MHC multimer staining. One-way ANOVA test with Tukey’s multiple comparisons tests, *p<0.05 and ***p<0.001. Data are pooled from three independent experiments. ANOVA, analysis of variance; IFNγ, interferon-γ; MHC, major histocompatibility complex; OVC, ovalbumin; CTLs. cytotoxic T lymphocytes; FT, freeze/thaw.
Induction of immunogenic cell death hallmarks by cytotoxicity is not exclusive to murine cells since it is also observed when human CD8+ T lymphocytes kill human HT29 colon cancer cells as a result of incubation with a bispecific antibody engaging EpCAM and CD3ε (EpCAM-TCB) (online supplementary figure 3). Cytotoxicity induced in a similar setting with human NK cells showed similar features on the HT29 cancer cells (online supplementary figure 3).
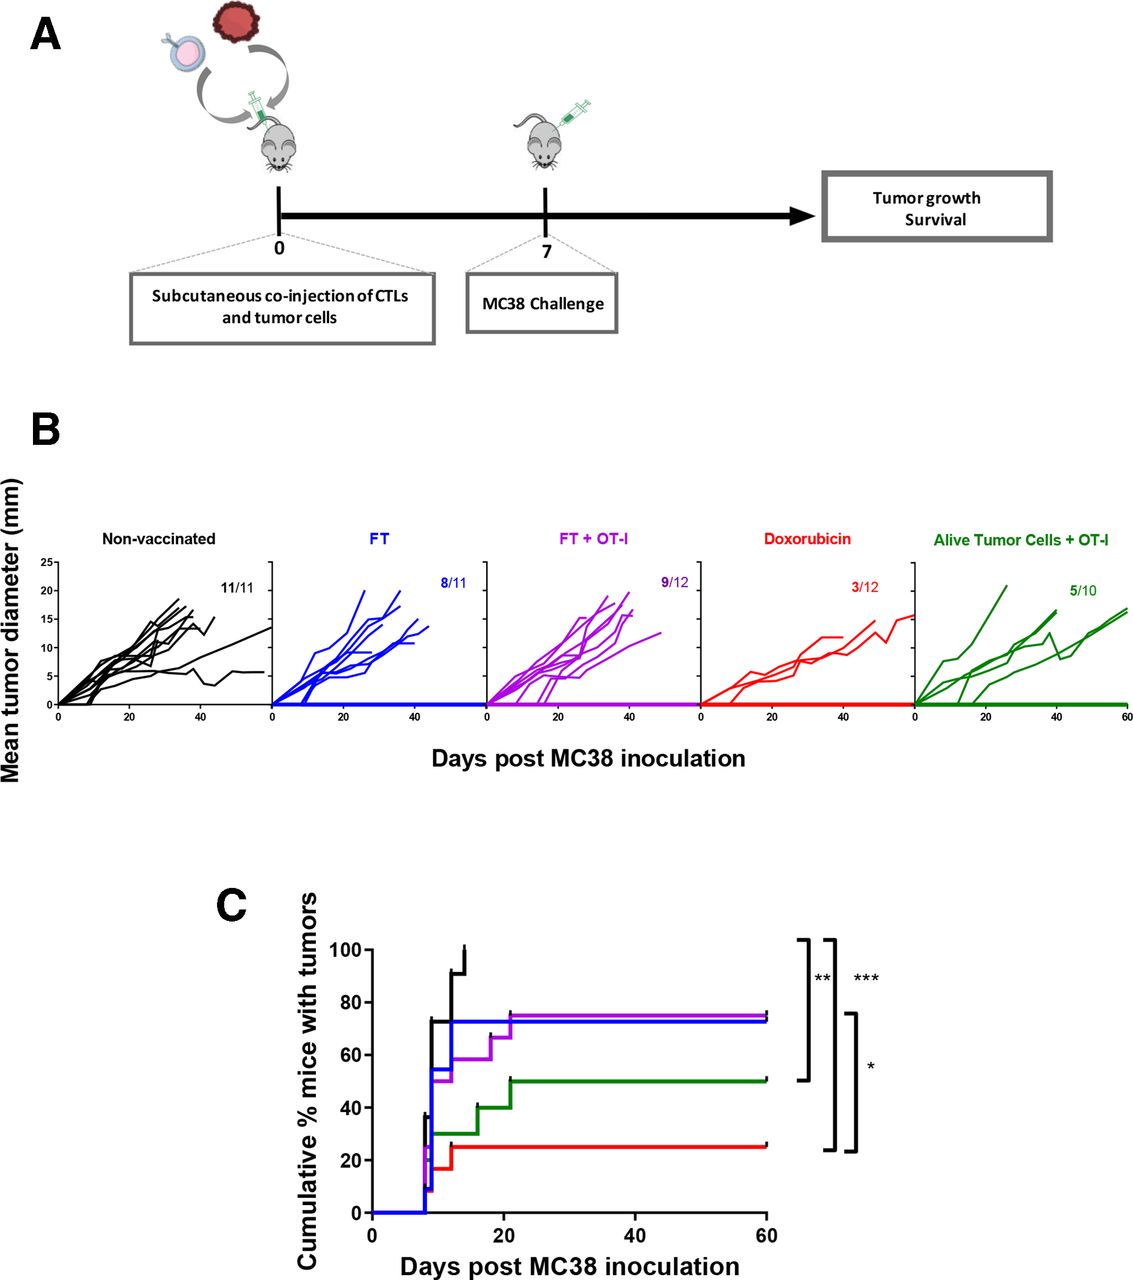
In vivo tumor cell killing by cytotoxic T cells induces epitope spreading. (A) at day −4, OT-I-derived splenocytes were incubated for 48 hours with SIINFEKL peptide (1 ng/mL). At day 0, 107 activated OTI splenocytes with MC38hEGFROVA cells at a ratio 20:1 were subcutaneously coinjected into the right flank. At day 7, mice were challenged with 5×10⁵ MC38 cells in the contralateral flank and tumor growth and survival were monitored. (B) Individual MC38 tumor growth. Non-vaccinated group was mock immunized with saline. FT group was immunized with the tumor cell debris obtained after three freeze/thaw cycles. FT+OT I group, received the frozen/thaw tumor cell debris with OT-I splenocytes. The doxorubicin positive control group was immunized with tumor cells killed with 2.5 µM doxorubicin for 24 hours in culture. The fraction of mice with detectable tumor growth is shown in each graph. (C) Curves showing the percentage of tumor-free mice at different time points. Log-rank test, *p<0.05, **p<0.01, and ***p<0.001. Data are pooled from two independent experiments. FT, freeze/thaw.
Tumor cell debris resulting from killing by cytotoxic T lymphocytes is immunogenic
To determine whether the dead tumor cells killed by immune cytotoxicity trigger a protective immune response in mice was the next step in our research. Vaccination consisted of cell debris of gp100-loaded MC38hEGFROVA killed by CD8+ Pmel-1-lymphocytes. Of note, cultures of tumor cells were pretreated in every case including controls with 15 IU/mL of IFNγ and gp100 peptide to enhance MHC-I expression and antigen presentation. The tumor challenge was performed 7 days later with the EG7 lymphoma cell line, which does not express the gp100 antigen but only shares the OVA protein with the colon cancer cells used for vaccination (figure 2A). In this setting, the administration of MC38hEGFROVA cell debris obtained after three freeze and thaw cycles did not elicit any protective immune response, and therefore EG7 tumor grew as in the non-vaccinated control group. We also introduced a positive control group with MC38hEGFROVA tumor cells killed by doxorubicin, a chemotherapeutic drug that is known to induce immunogenic cell death.9
Interestingly, the CTL-associated debris protected all mice from a subsequent challenge with EG7, while only 37% of mice were protected by immunization with doxorubicin-derived tumor-cell debris (figure 2B). The tumor-free animals over time (figure 2C) correlated well with the circulating levels of OVA-specific CD8+ T lymphocytes recognized by the corresponding H-2Kb tetramers (figure 2D). In fact, the maximum levels of specific CD8+ T cells were observed in mice immunized with the CTL-killed tumor cells.
To demonstrate that CTL-mediated immunogenic cell death can also take place in vivo, we subcutaneously coinjected MC38hEGFROVA tumor cells with preactivated OT-I lymphocytes (figure 3A). These TCR-transgenic T lymphocytes were able to kill the MC38hEGFROVA tumor cells when coinjected in the dermis (online supplementary figure 4). In these experiments, we challenged immunized mice with MC38 in the contralateral flank since these cells are not recognized by OT-I T lymphocytes. In this setting, 50% of the mice which received MC38hEGFROVA tumor cells+OT I T lymphocytes remained tumor-free at the end of the experiment, while only 25% of the mice which received tumor cell debris as generated by three cycles of freeze and thaw with or without OT-I cells rejected the MC38 challenge. Doxorubicin-killed cells as a positive control for immunogenic cell death protected 75% of mice in a similar experimental setting (figure 3B,C).
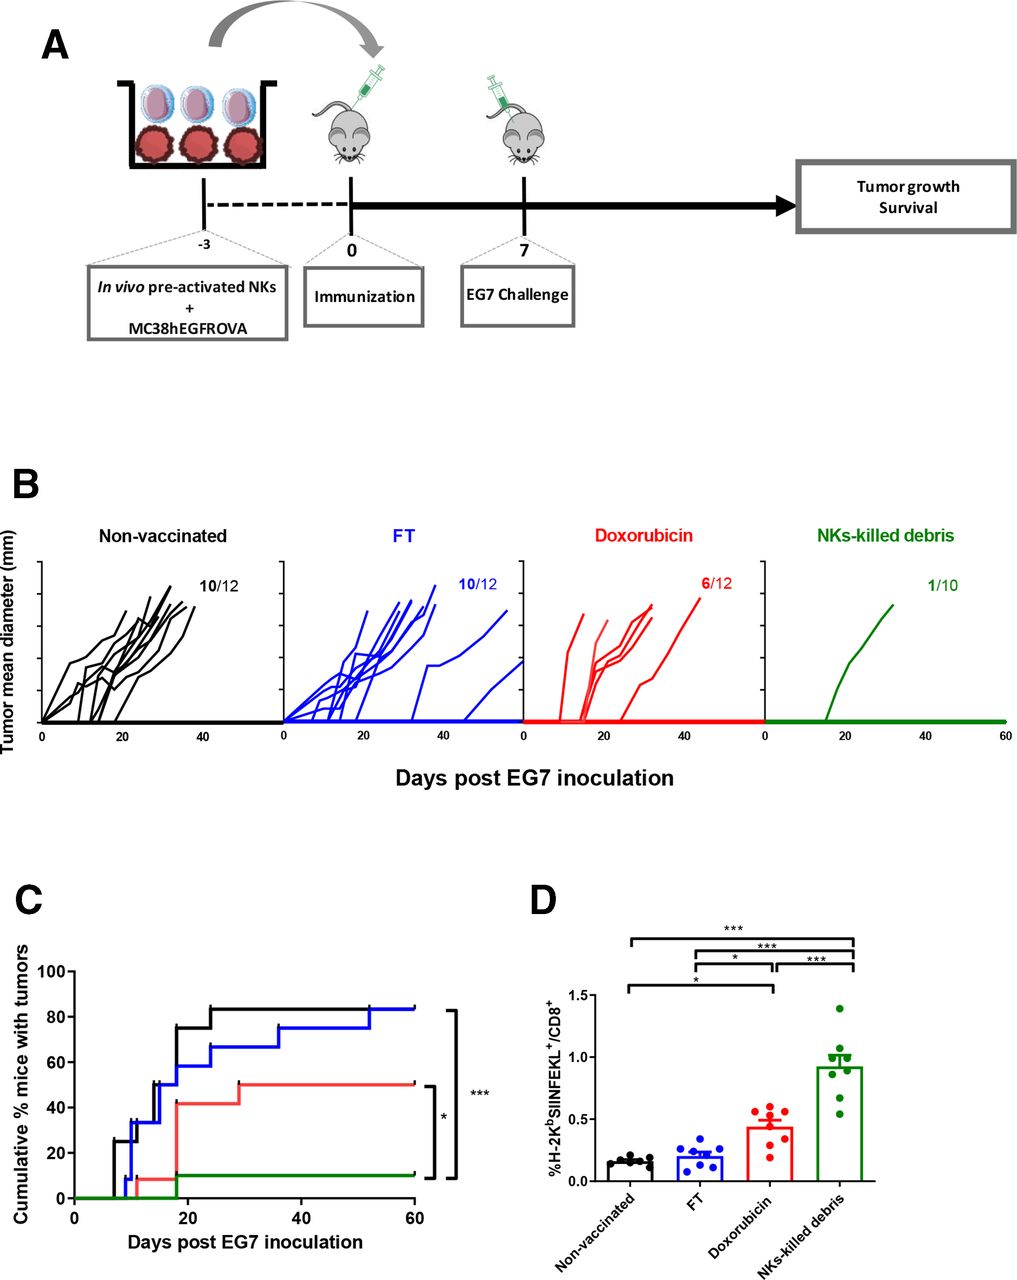
Tumor cells killed by NK cells are immunogenic. (A) RAG1 mice were hydrodynamically injected with a plasmid coding for IL-15. After 3 days, spleens were harvested and NK isolated by immunomagnetic negative selection. MC38hEGFROVA cells were incubated with in vivo activated NK cells for 72 hours. The result of the coculture was then injected subcutaneously into wild-type C57BL/6 mice. After 7 days, mice were challenged subcutaneously with 5×10⁵ EG7 cells. (B) Individual EG7 tumor growth. The non-vaccinated group was mock immunized with saline. The FT group was immunized with the tumor cell debris obtained after three freeze/thaw cycles. The doxorubicin positive control group was immunized with tumor cells killed with 2.5 µM doxorubicin for 24 hours in culture. (C) Curves showing the percentage of tumor-free mice at different time points. (D) At day 7, peripheral blood was collected, and OVA-specific CD8+ T cells were assessed by MHC multimer staining studied by FACS. One-way ANOVA test with Tukey’s multiple comparisons tests, *p<0.05 and ***p<0.001. Data are pooled from two independent experiments. ANOVA, analysis of variance; IL-15, interleukin-15; MHC, major histocompatibility complex; NK, natural killer; OVA, ovalbumin.
Tumor cell debris generated by natural-killer cell killing is immunogenic
Once having demonstrated that cytotoxicity mediated by T lymphocytes triggers an immunogenic form of tumor cell death both in vitro and in vivo, we next aimed at extending this observation to the cytotoxicity mediated by NK cells. Large numbers of activated mouse NK cells were obtained using hydrodynamic injections of a plasmid encoding a fusion protein of IL-15, encompassing the sushi domain of the IL-15Rα and apolipoprotein A-I as a stabilizing moiety.28 35 In vitro coculture of MC38hEGFROVA tumor cells with activated NK cells for 72 hours leads to extensive tumor cell lysis (figure 4A). On subcutaneous injection of the tumor cell debris, an effective antitumor immunity was developed in immunized mice that prevented tumor development when the animals were subsequently challenged with EG7 tumor cells in the right flank away from the site of immunization (figure 4B,C). The onset of antitumor immunity was also reflected by the increase in tumor-specific T cells in circulation 7 days after immunization (figure 4D). All the parameters analyzed to detect the CD8 antitumor immune responses were more intense in the group immunized with the NK cell-killed dead tumor cells than in any of the groups treated with dead tumor cells generated either by freeze/thaw or doxorubicin (figure 4B,C). Of important note, removal of effector cytotoxic cells, either NK or CTL (online supplementary figure 5), from the lysates by pretreatment with distilled water did not impair immunization (online supplementary figure 6A–C).

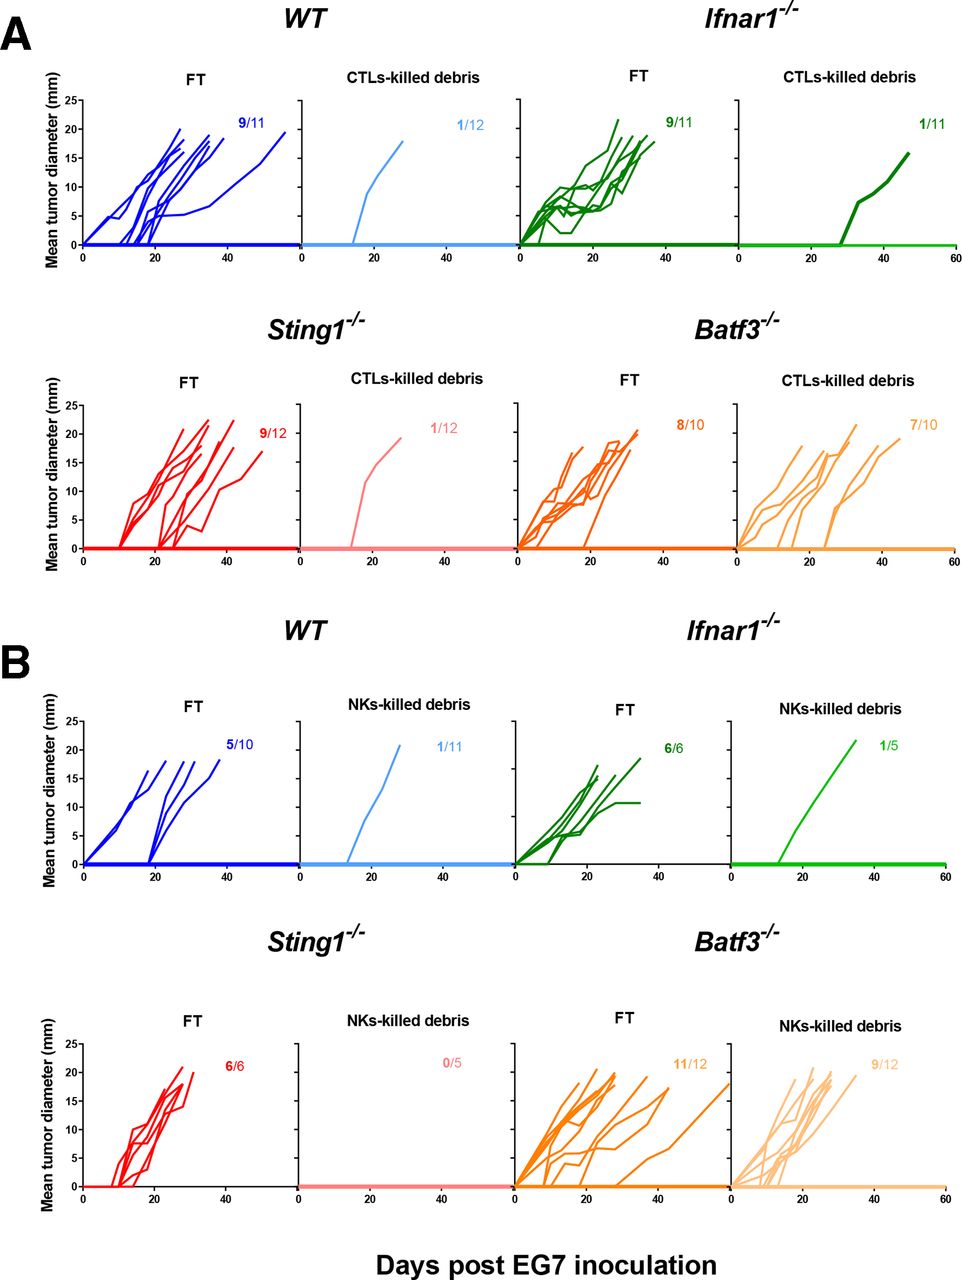
cDC1 absolute requirement for effective vaccination with CTL-derived and NK-derived tumor cell debris. (A) wild-type, Ifnar1 -/-, Sting1 -/- and Batf3 -/- mice were immunized with MC38hEGFROVA tumor cell debris obtained after three cycles of freeze/thaw or after Pmel-1 CTL-mediated killing in culture. After 7 days, mice were challenged with 5×10⁵ EG7 cells subcutaneously injected into the right flank, and tumor growth was monitored. (B) Experiments as in a but using MC38hEGFROVA tumor cell debris obtained after NK cell killing. Immunized with cytotoxic debris Batf3 -/- mice were statistically different from all the other groups with p<0.05 by Log-Rank tests for EG7 engraftment. Data are pooled from three (A) and two (B) independent experiments. cDC1, conventional dendritic cells type 1; NK, natural killer.

CTL-killed and NK-killed tumor cells are selectively uptaken by cDC1 dendritic cells. (A) Schematic representation of experiments in which fluorescent debris from MC38 mCherry cells killed by freeze and thaw, Pmel-1 CTLs or NK cells were feeded to antibody-prelabelled cDC1 and cDC2 cells from sFlt3L/GM-CSF bone marrow cultures to be studied by confocal microscopy to assess intracellular fluorescence signal per cell. (B) Quantification of the data analyzing cDC1 (n=65 for FT, n=37 for CTLs-derived debris, n=46 for NK-derived debris), and cDC2 (n=32 for FT, n=56 for CTLs-derived debris and n=66 for NKs-derived debris). (C) Representative confocal images of cDC1 and cDC2 as indicated. data are mean±SD One-way ANOVA test with Tukey’s multiple comparisons tests, **p<0.01 and ***p<0.001. ANOVA, analysis of variance; cDC1, conventional dendritic cells type 1; NK, natural killer; ns, non-significant; CTLs. cytotoxic T lymphocytes; FT, freeze/thaw; XCR1, X-C motif chemokine receptor 1; GM-CSF, granulocyte macrophage-colony stimulating factor.
Immunogenicity of CTL-killed or NK-killed tumor cells depends on Batf3-dependent DCs but not on Sting1 or Ifnar1
We next sought to determine the host requirements to develop the antitumor immune response by dead tumor cells generated by cytotoxicity as performed by immune effector cells. We took advantage of mice genetically deficient in different key molecules for immunosurveillance. Type I interferons are critical cytokines for the activation of effector T lymphocytes and NK cells in the priming phase of the immune response. To address the role of type I interferons, we used knock-out mice for the Ifnar1 receptor as well as Sting1 knock-out mice. The STING pathway is essential for the detection of intracellular dsDNA and the release of type I interferon on detection of dsDNA released by dying tumor cells. We also used Batf3 knock-out mice. This transcription factor is critically involved in the ontogeny of cDC1, DCs that exert an essential activity to cross-present exogenous antigens via the MHC I pathway and in the production of the pro-inflammatory cytokine IL-12.36 We immunized both wild type and knockout mice with tumor cell debris generated by CTLs or by NK cells. As shown in figure 5A, CTL-derived debris protected wild type and Ifnar1 or Sting1 deficient mice, whereas the protective effect was completely lost in mice deficient in cross-presenting specialized cDC1 DCs. The same pattern was obtained when the experiments were performed immunizing mice with NK cell-killed tumor cells (figure 5B). Furthermore, using gp100-pulsed MC38 expressing mCherry as the target cells for Pmel-1 T cells or the same MC38 mCherry cells without peptide as targets for activated NK cells, we generated fluorescent debris as that obtained by freeze and thaw cycles (figure 6A). These cell debris preparations generated by freeze/thaw or CTL/NK mediated cytotoxicity were added to cultures enriched in DCs following bone-marrow cultures in the presence of sFlt3L and GM-CSF for 14 days.34 DC subsets were premarked by fluorochrome-tagged antibodies anti-CD11b (for cDC2) and anti-XCR1 (for cDC1). As can be seen in figure 6B, fluorescent cytotoxicity or freeze/thaw debris were not uptaken by cDC2 under these conditions, while cDC1 readily uptook fluorescence from CTL or NK-killed tumor cells but not from freeze and thaw killing. Of note, the target cell debris generated by NK cytotoxicity is in our hands uptaken with more efficiency by cDC1 cells than that generated by CTLs (figure 6B). Representative confocal microscopy images are shown in figure 6C.
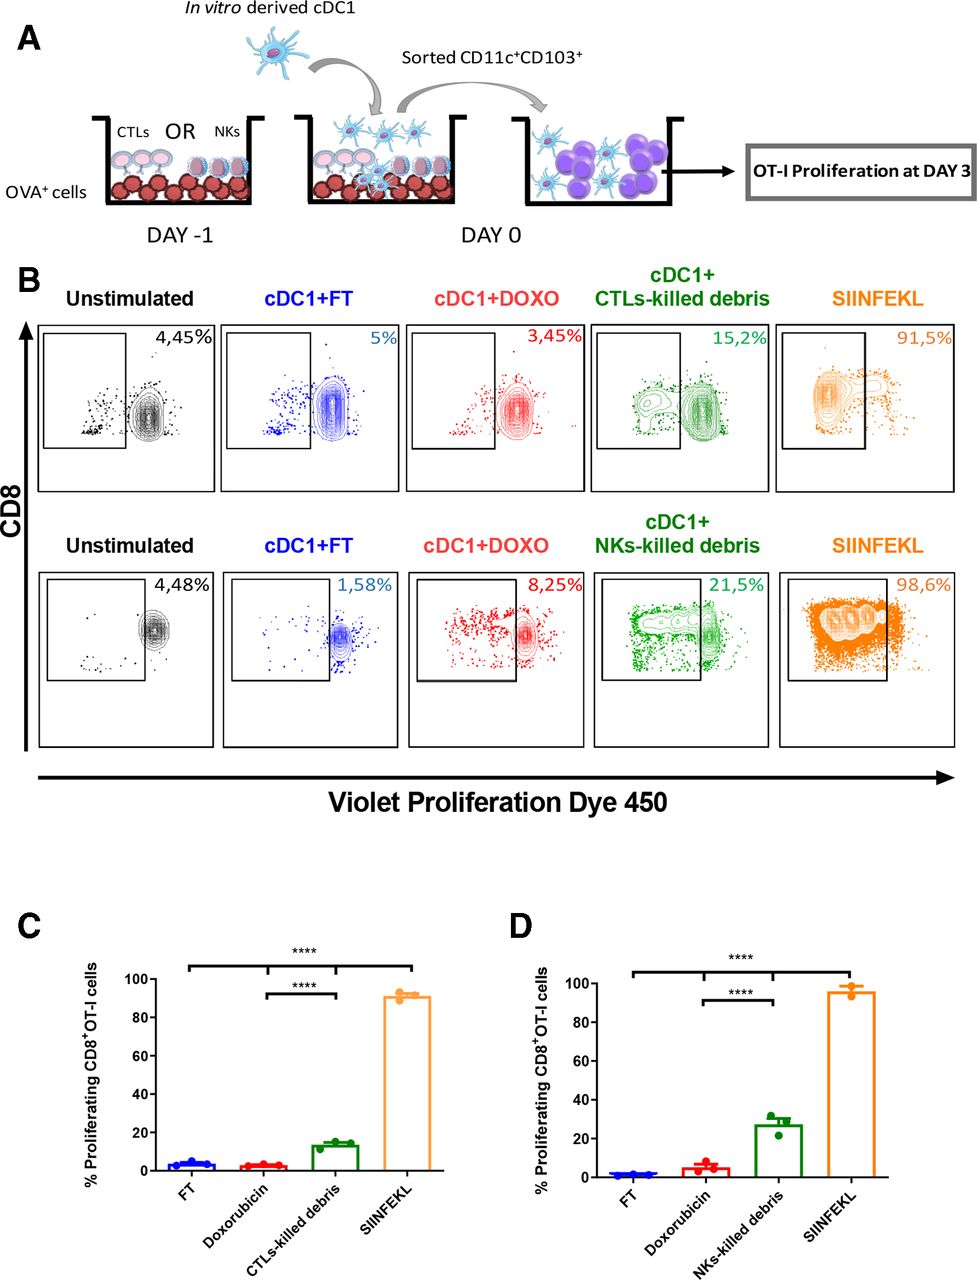
Further addressing the role of cDC1 cells in the process, we generated these cells in culture by differentiating bone marrow precursors under the influence of soluble FLT3-L and GM-CSF.34 Debris of OVA-expressing cells killed by Pmel-1 CTLs or NK cells resulted in OVA cross-presentation and in vitro priming of OT-I cells. Using FACS sorting, we recovered the CD11c+CD103+ DCs from the cultures of cytotoxic debris and such DCs. Next, we exposed these DCs in a coculture with OT-I lymphocytes loaded with a fluorescent dye to monitor their proliferation (figure 7). These results are consistent with a train of events in which cDC1 cells capture the tumor-cell remains and cross-present tumor-associated antigens. Figure 7 shows the experimental setting (figure 7A) and the OT-I proliferation responses (figure 7B–D) which indicate that CD8+ T cell or NK cell cytotoxic debris leads to cross-presentation that is not observed with cDC1 pulsed with freeze and thaw tumor cell lysates.

Antigens in dead cells from cytotoxicity are cross-presented by cDC1 cells. (A) Cross-presenting CD103+ DCs were differentiated in culture from bone marrow cells for 14 days in the presence of GM-CSF and soluble FLT3-L. On day −1, B16OVA (C) or MC38hEGFROVA (D) were killed with activated Pmel-1-derived splenocytes or activated NK cells, respectively. FT was derived from tumor cell debris obtained after three freeze/thaw cycles. The doxorubicin samples are tumor cells debris from cells killed with 2.5 µM doxorubicin dying 24 hours in culture. at day 0, DCs were added. after 3 hours, CD11c+CD103+ DCs were FACS-sorted and incubated with resting OVA-specific OTI CD8+ cells previously labeled with a proliferation dye. after 3 days, OT-I proliferation was assessed by flow cytometry. (B) Representative contour plots of DC-OT-I cocultures showing a representative case. (C, D) Percentage of proliferating CD8+ OT-I cells. Data are mean±SEM n=3 for each group. One-way ANOVA test with Tukey’s multiple comparisons tests, ****p<0.0001. Results from a single experiment for T cells and independent experiments for NK cells are available. ANOVA, analysis of variance; DC, dendritic cell; NK, natural killer; OVA, ovalbumin; SEM, standard error of the mean; GM-CSF, granulocyte macrophage-colony stimulating factor; Fms-related receptor tyrosine kinase 3 ligand.
Discussion
We present evidence strongly arguing that cytotoxicity, as mediated by CTLs and NKs cells on malignant cells, is immunogenic. This is coherent with the proposed model of the tumor immunity cycle5 and represents a self-amplifying mechanism to gain momentum in tumor rejection on successful immunotherapy. Our results would explain the phenomena of epitope spreading seen in vaccination experiments in mice37 38 and clinical trials of vaccination using defined antigens.39 40
From the point of immune regulation, these observations are relevant since once started, an effector immune response toward a given antigen will continue until cells expressing the antigen are cleared. It remains to be seen if these mechanisms are only relevant in the context of transformed tumor cells or would also apply to non-malignant counterparts. For instance, it could be important in the field of β-cell dysfunction in diabetes mellitus or acute rejection of transplants.41 42
In our experiments, we have followed the logic that allowed us to establish that certain chemotherapeutic drugs or radiotherapy are immunogenic because they induce immunogenic cell death.9 43
To explain our results, we invoke the interplay of DCs and cross-presentation of tumor antigens.20 21 In essence, both antigen release and DAMPs are required to accomplish immunization. The exact nature of antigen processing and redirection to the MHC-I antigen presentation pathway remains to be determined and is a matter of speculation.36 44 The main DAMPs associated with cytotoxicity are to be defined, but HMGB1 and calreticulin exposure are likely to contribute to immunogenicity.
Indeed, our experiments pinpoint a necessary role for BATF3-dependent cDC1 cells that in this case do not need the contribution of type I IFN receptor on endogenous cells or STING sensing as reported in other related experimental settings.45 Moreover, our results go on to demonstrate that cDC1 can uptake and cross-present antigens from tumor cell debris derived from CTL and NK cytotoxicity. The relative facility to culture GMP-grade NK cells might offer an opportunity for intratumoral therapies. In this sense, we have recently reported that intratumoral injection of antitumor CD8 T cells engineered to express IL-12 cause epitope spreading in a cDC1-dependent fashion.46
Ongoing work is addressing the intrinsic molecular requirements for immunogenicity of target cells following T or NK cytotoxicity. The relative contribution and relevance of perforin/granzyme-B, FASL-FAS, TRAIL-DR4/5 as killing mechanisms remains to be ascertained. Moreover, a role for IFNα or IFNγ signaling in tumor cells is being interrogated on knock-down of the corresponding receptors in target tumor cells. In fact, the experiments performed in Sting1 KO and Ifnar1 KO mice do not exclude a potential role for these receptor moieties in the tumor cells themselves. Requirements for the downstream mechanism of apoptosis signaling toward immunogenicity would be also a matter of interest. For instance, in the accompanying article published by the group of Julian Pardo in this issue, a key role for target-cell caspase-3 is revealed.47 Overall, our findings and those in this companion article are mutually supportive and confirm our conclusions leading to ongoing work on the intrinsic molecular immunogenic mechanisms that follow cytotoxicity.
Conclusions
Our findings may have fundamental implications for the development of immunotherapies from adoptive T-cell transfer to checkpoint inhibitors. For instance, it has been reported that cDC1 cross-priming is relevant for adoptive T-cell therapy48 and the efficacy of checkpoint inhibitors.30 49 This can be also useful for NK-based immunotherapies.
In our view, the main consequence of the link between cytotoxicity and immunogenic cell death of malignant cells is that it offers a mechanism of amplification and self-perpetuation of the immune response against cancer neoantigens. Indeed, certain tumor antigens might remain ignored by the immune system until a cytotoxic response is set in motion.50 51 Once CTL responses are unleashed, our results imply that strategies aimed at fostering cross-priming are due to consolidate and amplify clinical responses to immunotherapy. Furthermore, these findings predict that established tumors have likely evolved escape mechanisms that allow them to evade cross-priming of their antigens when under attack by CTLs or NK cells. Identification of such evasive mechanisms offers interesting opportunities in cancer immunotherapy.
Acknowledgments
We are grateful to Dr. Paul Miller for English editing and Eneko Elizalde for excellent animal facility assistance. Dr. Diego Alignani from the flow cytometry unit is acknowledged for his help in sorting experiments. The figures contain elements from Servier Medical Art (https://smart.servier.com/), licensed under Creative Commons Attribution 3.0 Unported License (https://creativecommons.org/licenses/by/3.0/).
References
Footnotes
PB and IM are joint senior authors.
Correction notice Since the online publication of this article, it was noticed that notes to production were left in the main text. These have been removed and the reference ‘Jaime-Sanchez P, Uranga-Murillo I, Aguilo N, et al Cell death induced by cytotoxic CD8+ T cells is immunogenic and primes caspase-3–dependent spread immunity against endogenous tumor antigens Journal for ImmunoTherapy of Cancer 2020;8:e000528. doi: 10.1136/jitc-2020-000528’ has been added to the article.
Contributors LM performed all the in vitro and in vivo experiments. AT performed the confocal microscopy experiment. ARS-P collaborated in the in vitro production of cDC1. MCO, MA, IO, IE, EB, AA, SG, NC, JLPG and MER-R collaborated in the in vivo experiments. PB and IM designed the experiments and interpreted the results. All authors read and approved the final manuscript.
Funding This study was supported by Spanish Ministry of Economy and Competitiveness (MINECO SAF2014-52361-R and SAF 2017-83267-C2-1R); a Worldwide Cancer Research Grant (15-1146); the Asociación Española Contra el Cancer (AECC) Foundation under grant GCB15152947MELE; and the European Union's Horizon 2020 Program (grant agreement no. 635122 PROCROP) to IM; and Instituto de Salud Carlos III (PI16/00668 and PI19/01128) cofinanced by Fondos Feder and Joint Translational Call for Proposals 2015 (JTC 2015) TRANSCAN-2 (code: TRS-2016-00000371) to PB. AT has received financial support through la Caixa Banking Foundation (LCF/BQ/LR18/11640014). MA has received a Marie Skłodowska-Curie fellowship (CINK 746985).
Competing interests IM reports advisory roles with Roche-Genentech, Bristol-Myers Squibb, CYTOMX, Incyte, MedImmune, Tusk, F-Star, Genmab, Molecular Partners, Alligator, Bioncotech, MSD, Merck Serono, Boehringer Ingelheim, Astra Zeneca, Numab, Catalym, and Bayer, and research funding from Roche, BMS, Alligator, and Bioncotech. PB reports advisory roles with Tusk and Moderna, research funding from Sanofi, and Bavarian Nordic and speaker honoraria from BMS, MSD, Novartis and AstraZeneca.
Patient consent for publication Not required.
Ethics approval Experiments involving mice were approved by the Ethics Committee of the University of Navarra (024-17).
Provenance and peer review Not commissioned; externally peer reviewed.
Data availability statement Data are available on reasonable request. All data relevant to the study are included in the article or uploaded as online supplementary information.