Article Text

Abstract
Background Immune checkpoint inhibitors, the most widespread class of immunotherapies, have demonstrated unique response patterns that are not always adequately captured by traditional response criteria such as the Response Evaluation Criteria in Solid Tumors or even immune-specific response criteria. These response metrics rely on monitoring tumor growth, but an increase in tumor size and/or appearance after starting immunotherapy does not always represent tumor progression, but also can be a result of T cell infiltration and thus positive treatment response. Therefore, non-invasive and longitudinal monitoring of T cell infiltration are needed to assess the effects of immunotherapies such as checkpoint inhibitors. Here, we proposed an innovative concept that a sufficiently large influx of tumor infiltrating T cells, which have a smaller diameter than cancer cells, will change the diameter distribution and decrease the average size of cells within a volume to a degree that can be quantified by non-invasive MRI.
Methods We validated our hypothesis by studying tumor response to combination immune-checkpoint blockade (ICB) of anti-PD-1 and anti-CTLA4 in a mouse model of colon adenocarcinoma (MC38). The response was monitored longitudinally using Imaging Microstructural Parameters Using Limited Spectrally Edited Diffusion (IMPULSED), a diffusion MRI-based method which has been previously shown to non-invasively map changes in intracellular structure and cell sizes with the spatial resolution of MRI, in cell cultures and in animal models. Tumors were collected for immunohistochemical and flow cytometry analyzes immediately after the last imaging session.
Results Immunohistochemical analysis revealed that increased T cell infiltration of the tumors results in a decrease in mean cell size (eg, a 10% increase of CD3+ T cell fraction results a ~1 µm decrease in the mean cell size). IMPULSED showed that the ICB responders, mice with tumor volumes were less than 250 mm3 or had tumors with stable or decreased volumes, had significantly smaller mean cell sizes than both Control IgG-treated tumors and ICB non-responder tumors.
Conclusions IMPULSED-derived cell size could potentially serve as an imaging marker for differentiating responsive and non-responsive tumors after checkpoint inhibitor therapies, a current clinical challenge that is not solved by simply monitoring tumor growth.
- immunology
- MRI
- physics
- tumors
This is an open access article distributed in accordance with the Creative Commons Attribution Non Commercial (CC BY-NC 4.0) license, which permits others to distribute, remix, adapt, build upon this work non-commercially, and license their derivative works on different terms, provided the original work is properly cited, appropriate credit is given, any changes made indicated, and the use is non-commercial. See http://creativecommons.org/licenses/by-nc/4.0/.
Statistics from Altmetric.com
Introduction
The detection and evaluation of tumor responses to immunotherapy are becoming increasingly important with the rapid expansion of checkpoint inhibitors as treatment options for a wide variety of cancers.1–3 A cross-sectional study found that the estimated percentage of US patients with cancer who are eligible for checkpoint inhibitor drugs increased from 1.54% in 2011 to 43.63% in 2018.4 However, immunotherapy poses special challenges for assessing successful responses because tumor responses may take longer than conventional treatments.5 Checkpoint inhibitors block PD1 and CTLA4 receptors on T cells from interacting with PD-L1 on tumor cells and CD80 on antigen-presenting cells, respectively, which allows for T cells to function in the tumors and lymph nodes.6 These treatments can result in increased cytotoxic T cell infiltration into tumors, which may lead to transient tumor enlargement due to the increased number of T cells, followed by shrinkage of tumors or long-term stability of tumor size. Because an increase in tumor volume is considered non-responding using the standard-of-care RECIST (V.1.1)7 criteria, effective responses could be misdiagnosed as disease progression, that is, pseudoprogression,5 which has been reported in numerous studies.5 8 9 Rates of pseudoprogression in patients receiving PD-1/PD-L1 Inhibitors in multiple phase II/III clinical trials have been reported to be up to 10%.9 Even the immune-specific-related response criteria (eg, immune-related response criteria (irRC),10 immune-related RECIST (irRECIST),11 and modified RECIST for immune-based theraputics (iRECIST)3) still rely on monitoring tumor growth kinetics in terms of volume and, hence, cannot distinguish immune cell-induced ‘pseudoprogression’ from tumor progression in non-responders.12 Currently, continuing treatment and longitudinal monitoring of tumor volume are used for for example, 4–8 weeks to verify the persistence of tumor enlargement and evaluate treatment efficacy, but this prolongs therapy with an ineffective agent. There is a need to assess an early response to immunotherapy that can prompt the discontinuation of ineffective therapy (thus avoiding unnecessary toxicity), and switch to a potentially more effective alternative therapy (thus avoiding unnecessary treatment delays).
A basic strategy to tackle this challenge is to detect and quantify T cell infiltration into solid tumors. Currently, the presence of tumor infiltrating T cells is obtained by performing immunohistochemical analyzes of histopathological specimens,13 which are not able to assess temporal changes in a single subject and are also restricted by sampling limitations. Various other cellular and molecular imaging technologies, including optical fluorescence/bioluminescence imaging,14 MRI,15 16 positron emission tomography (PET) and single photon emission computed tomography,17 18 have been employed for T cell tracking. However, these imaging methods require either direct or indirect labeling of the T cells and therefore, are usually applied to track the tumor-specific cytotoxic T cells during Adoptive Cell transfer/therapy (ACT) of labeled/engineered T cells.19 PET has been actively investigated for tracking naive T cells,20 but, it involves radiation and lacks spatial resolution. Currently, there is a lack of noninvasive clinical imaging methods to assess T cell infiltration during immunotherapy such as checkpoint inhibitor therapies.
In addition to various molecular and cellular differences, T cells and cancer cells are remarkably different in size. T cells before and after activation are typically 5–10 µm in diameter,21–24 which is significantly smaller than most cancer cells in solid tumors (10–20 µm).25 This provides an opportunity to distinguish T cells from cancer cells based on their sizes without labeling. Because infiltration by T cells increases the relative fraction of ‘small’ cells within a mass, the mean cell size of all cells inside tumors decreases. Therefore, detection of this decrease in mean cell sizes could provide a unique means to probe T cell infiltration.
Cell size information may be obtained clinically via biopsies, which suffer well-known limitations (eg, sampling errors and intraobserver and interobserver variations). Recently, a class of novel diffusion-sensitive MRI methods, quantitative Temporal Diffusion Spectroscopy Imaging (qTDSI), has been developed which provides quantitative information on tissue microstructure such as cell size and density.26 27 Different from conventional diffusion MRI methods, qTDSI MRI uses a variety of time-dependent diffusion gradient waveforms, such as cosinusoidal gradients oscillating at a selected frequency, to quantify how far water molecules translate via Brownian motion over different time scales, determined by the frequency spectra of the waveforms, which is then described by an Apparent Diffusion Coefficient (ADC). When the diffusion time is very short, the ADC is high and the distance traveled depends primarily on intrinsic properties of cytoplasm. If the diffusion time is sufficiently long, water molecules may encounter restrictions to free movement such as cell membranes, and their displacements are consequently limited. Then the ADC is lower and depends on tissue parameters such as cell sizes, cell densities and membrane permeabilities. By incorporating realistic approximations (eg, ignorance of water exchange between intracellular and extracellular spaces) and constraints into a model of tissue (the details of which are described below), we can extract cytological features, such as cell size and cell density, from the frequency/time dependence of the ADC. To accommodate the hardware limitations of clinical MRI scanners, acquisitions using conventional bipolar and oscillating gradients can be combined to cover a broad range of diffusion times suitable for quantifying typical cellular dimensions. We have previously reported a specific implementation of this approach termed Imaging Microstructural Parameters Using Limited Spectrally Edited Diffusion (IMPULSED) and showed it can accurately quantify mean cell sizes in vitro for different cancer cell types, independent of cell densities.28 29 This method can non-invasively detect changes in intracellular structure and cell sizes in solid tumors with the spatial resolution of MRI, in cell cultures and in animal models, early during specific treatments28 30 31 and without the confounding factors that limit conventional diffusion weighted imaging (DWI). A recent study has reported the implementation of IMPULSED for imaging patients with breast cancer on clinical 3T MRI scanners with an acquisition time of ~7 min, which is acceptable for clinical applications.32 We, therefore, hypothesize that IMPULSED may provide a noninvasive imaging method to assess the decrease of mean cell size caused by T cell infiltration in tumors and, hence, could assess tumor response to immune checkpoint inhibitor therapy.
In this study, the response to checkpoint inhibitors (anti-CTLA-4 and anti-PD-1) of a murine colorectal cancer model was monitored longitudinally using IMPULSED and standard measurements of ADC. IMPULSED-estimated cell sizes were correlated with histology-estimated cell sizes and CD3+ T cell percentages. The treatment responses were assessed by temporal changes of IMPULSED-derived parameters as well as tumor growth.
Methods
Theory
The details of IMPULSED have been reported and comprehensively validated with histology previously.28 29 32 Briefly, a combination of pulsed gradient spin echo (PGSE) and oscillating gradient spin echo (OGSE) diffusion MRI acquisitions are used to measure diffusion within solid tumors over a broad range of diffusion times (2.5–46 ms). Following previous approaches,33–35 tumors are modeled as tightly packed spherical cells with a mean diameter d. The total measured MRI signals are then expressed as the sum of the fractions experiencing restricted diffusion within tumor cells and hindered diffusion in the extracellular spaces, namely,
 (1)
(1)
where vin is the water volume fraction of intracellular space, and Sin and Sex are the DW signal magnitudes per volume from the intra- and extracellular spaces, respectively. We assume the effects of water exchange between intracellular and extracellular spaces during the diffusion time are negligible, as suggested in previous models of diffusion in tumors,13 14 and which is especially justifiable for short diffusion times.23 Analytical expressions of Sin and Sex acquired by OGSE and PGSE sequences have been reported previously15 and are summarized in the online supplementary materials.
Supplemental material
Four parameters (mean cell size d, intracellular diffusion coefficient Din , intracellular volume fraction vin and extracellular diffusion coefficient Dex ) can then be estimated by fitting to the measured data.
Animals and tumor induction
Female C57BL/6 mice (Envigo Laboratories, Indianapolis, Indiana USA) were used for the study. They were observed daily and weighed weekly to ensure that interventions were well tolerated.
In vivo MRI
Mice were anesthetized with a 2%/98% isoflurane/oxygen mixture before and during scanning. All images were acquired with a Varian DirectDrive horizontal 4.7 T magnet (Varian, Palo Alto, California, USA). The magnet bore temperature was kept at 32°C using a warm-air feedback system. Mice were restrained during imaging in a customized Teflon animal holder with a tooth bar and a head bar.
Two-dimensional scout images were obtained using a fast spin echo sequence with TR=3 s, TE=40 ms, slice thickness=1 mm, FOV=16×32 mm and data matrix size=64×128. DWI was implemented using single-shot spin-echo echo planar imaging acquisitions. A conventional PGSE sequence acquired data using pairs of unipolar diffusion gradients of duration δ=4 ms, and separation Δ=12 and 48 ms, corresponding to effective diffusion times (Δ-δ/3) approximately 10.7 and 46.7 ms. Shorter diffusion times were achieved using pairs of OGSE with gradient frequencies 50 and 100 Hz with δ/Δ=20/25 ms, corresponding to effective diffusion times (1/4 f for OGSE acquistions, where f is the frequency36) approximately 5 and 2.5 ms. Five diffusion weighting factors, or b-values, spaced at equal logarithmic intervals from 0 to either 1500 sec/mm2 or the allowed maximum b value (limited by our maximum gradient strength of 360 mT/m in a single direction), were used for both PGSE and OGSE acquisitions. Multiple axial slices covering the entire tumor of each animal were acquired with a slice thickness of 2 mm. The matrix size was 32×64 with FOV=16×32 mm, yielding an in-plane resolution of 0.5×0.5 mm2. Note that the echo times (TE=70 ms) were the same for all diffusion measurements to minimize differential relaxation effects.
Experiment outline
We studied anti-CTLA-4 and anti-PD-1 combination therapy in a mouse model of colon adenocarcinoma (MC38). Using two experimental cohorts, 34 C57/BL6 mice were subcutaneously injected with 1×10⁶ MC38 cells. Tumors were visible by MRI on day 7 post injection (DPI), and mice were imaged on days 7, 10, 13 and 16 post injection using IMPULSED and standard DWI measurements of ADC. Tumor volumes were monitored using T2-weighted images obtained without any diffusion weighting (b value=0). Three doses of either dual therapies (n=19, 100 µg of each anti-CTLA-4 and anti-PD-1 per dose IP) or IgG (n=15, 200 ug per dose IP) were administered immediately after the first three imaging sessions on 7, 10 and 13 DPI, respectively. After imaging on day 16, the tumors were collected for histology and flow cytometry.
Data processing
The dependency of water diffusion rate on effective diffusion time, or oscillating gradient frequency, is the basis of assessing tumor microstructure. Each tumor was covered by multiple axial imaging slices. For each slice, an region of interest (ROI) was manually drawn on the T2-weighted image where the tumor was identified as showing significant hyperintensity with the total tumor volume calculated by integration over all tumor-containing image slices. The signals from each voxel in the tumor were evaluated to see what fitting procedure was most appropriate using an F statistics model selection process.37 The models considered were either one in which a constant ADC at different diffusion times/oscillating gradient frequencies was assumed, or one in which the tumor signals fit better to the model described above based on statistical justification. Note that voxels with low signal-to-noise ratio (SNR) favor the constant ADC model because the noise tends to generate values of ADC that are very low. For voxels favoring the proposed tumor signal model, DW signals were fit to generate parametric maps using the fmincon function in Matlab (Mathworks, Natick, Massachusetts USA). The fittings maximized the log likelihood function with Rician noise, which was estimated from background voxels.36 Constraints for fitting parameters were based on physiologically relevant values14 26 27: 0≤d ≤ 40 µm, 0≤vin ≤ 1, 0≤Din ≤3.0 µm2/ms, and 0≤Dex ≤ 3.0 µm2/ms. Randomly generated initial parameter values were used in the fittings. The average values of each parameter for the entire tumor were calculated for further statistical analyzes. The precisions of the parameter estimates were assessed by calculating the covariance matrix of the fitted parameters.38 The relative SD (RSD) for each fitted parameter was estimated voxel by voxel following the approach described by Kellman et al.39 40 It has been shown in a phantom study38 that these estimated RSDs from a single measurement are equivalent to parameter variations obtained from multiple measurements.38
Tumor dissociation
From the 34 animals who received MC38 tumor injections, 33 mice were sacrificed immediately after the last MRI session (16 DPI). One control IgG-treated mouse was excluded due to IACUC restrictions, whereby tumors cannot exceed 2 cm, and the mosue required early euthanasia. After sacrifice, tumors from 31 mice were available for histology, as tumors from two immune-checkpoint blockade (ICB) treatment responding mice were too small to be processed for histology. In addition, one immunotherapy-treated tumor underwent significant late-stage apoptosis/necrosis, resulting in poor cell membrane staining, limiting histology to a total 15 ICB-treated tumors and from 15 IgG-treated (control) tumors. There were six tumors that were less than 0.08 g, and these tumors could be used only for histology as there were not a sufficient number of cells for flow cytometry analysis. Therefore, flow cytometry analysis was conducted on 24 tumor samples.
For flow cytometry, tumors were dissociated into single cell suspensions with DNAse I (Invitrogen) and collagenase type IV (Sigma) for 30 min at room temperature using a dissociator (Miltenyi) with gentleMACS C-tubes. To remove calcium, cells were resuspended for 5 min in HBSS without calcium or magnesium (Gibco), then resuspended in 5 mM of EDTA for 30 min at room temperature. Then, cells were passed through a 70 µm filter before ACK lysing buffer (KD Medical) was added to remove red blood cells before flow cytometry. Immediate staining was performed for surface marker expression to analyze with flow cytometry.
Fluorescence cytometry
One million cells of each tumor were transferred to a 96-well round-bottom, microtest plate and pelleted at 1000 rpm for 3 min (Beckman-Coulture Allegra X-14 Centrifuge). The following antibodies were used for surface staining: CD4 PECy7 (Gk1.5 Invitrogen), CD8a APCe780 (53–6.7 eBioscience), CD279 (PD-1) FITC (J43 eBioscience), CD25 PECy5 (PC61.5 eBioscience), CD71 PE (C2 BD), CD19 APC (6D5 Biolegend) and CD11b e450 (M1/70 eBioscience). Briefly, 1 000 000 cells from each tumor were stained with cell surface antibodies in FACS Buffer (PBS with 2% FBS) for 30 min at 4°C. Cells were pelleted at 1000 rpm for 3 min before resuspending in 200 µL of FACS Buffer. T cell surface markers were measured by fluorescence cytometry (MACSQuant, Miltenyi Biotec) and analyzed by FlowJo software (Tree Star). Statistical analyzes were performed using GraphPad Prism V.8. Lymphocytes were selected using forward and side-scatter before analyzing into further subtypes (online supplementary figure 3A).
Histology validation
A 5 µm thick section was obtained from each tumor and stained with DAPI, CD3 (sc-1127, Santa Cruz), and Na+/K+-ATPase (ab76020, Abcam).
Na+/K+-ATPase is a plasma membrane pump responsible for the extracellular transport of sodium ions and the intracellular transport of potassium ions. It is one of the most widely expressed plasma membrane markers38 which allows better visualization of cell boundaries (membranes) in circumstances when cancer cells are densely packed in solid tumors. Briefly, tissue samples were deparaffinized, rehydrated and antigen retrieval was performed using 6.1 pH citrate buffer (S169984-2, Dako) for 20 min at 105°C in a pressure cooker followed by a 20 min bench cool down. Samples were treated with 3% hydrogen peroxide and blocked for 30 min in PBS/3% bovine serum albumin/10% donkey serum. Primary antibodies were incubated overnight at 4°C, washed in PBS, and followed by staining with fluorescently-labeled secondary antibodies (Na+/K+-ATPase-Alexa647 and CD3-Alexa750) and DAPI.
Conventional microscopy studies of tissue sections are unable to reliably estimate some structural features of whole tumors because of insufficient sampling of the volume.39 In the current study, whole stained slides were scanned using an Apiro Versa 200 slide scanner at 20 x to generate high-resolution digital images. To reduce the chance of biased tissue selection, a purpose-written segmentation algorithm was implemented to calculate the percentage of CD3+ T cells and the mean cell sizes of T cells and tumor cells for the entire slides.
Spleen collection
Spleens were collected to analyze systemic immune changes in the first cohort of mice (nine ICB-treated and six control IgG-treated). Spleens were mechanically homogenized and passed through a 70 µm filter. Then, ACK lysing buffer (KD Medical Inc) was added to remove red blood cells before flow cytometry.
Statistical analysis
Tumors treated with a combination ICB of anti-PD-1 and anti-CTLA-4 antibodies were separated into responder and non-responder groups, where responder tumors had volumes less than 250 mm3 or showed stable or decreased volumes . The mean values of each metric for the entire tumor were calculated to compare ICB responders, ICB non-responders, and control IgG-treated groups. The temporal behavioral differences in IMPULSED-derived parameters, T2W-derived tumor volumes, and conventional ADC values, between checkpoint inhibitor-treated and control IgG-treated tumor xenografts, were summarized using means and standard errors of the means, and compared by repeated measures two-way analysis of variance with Tukey post-tests.
The correlations between histology and IMPULSED-derived mean cell sizes, and histology/IMPULSED-derived cell sizes and CD3+ T cell population fractions, were assessed using Spearman’s tau correlation coefficient.41 Statistical analyzes were performed using OriginPro 9.0 (OriginLab, Northampton, Massachusetts, USA).
Results
IMPULSED provides parametric maps of cellular properties in solid tumors
All the DW signals were normalized by dividing them by the signals acquired without any diffusion weighting (b value=0), so the normalized DW signals equal 1 at b-value=0. Figure 1 shows the typical normalized DW signals acquired with four different effective diffusion times, for increasing diffusion weighting factors or b-values. Clearly, DW signals decay faster with decreasing effective diffusion times as expected for restricted water. The average normalized DW signals were fit to IMPULSED signal model described previously to generate four cellular parameters (for this example, cell size d=11.55 µm, vin =0.43, Din =2.01 µm2/ms, Dex =0.52 µm2/ms).
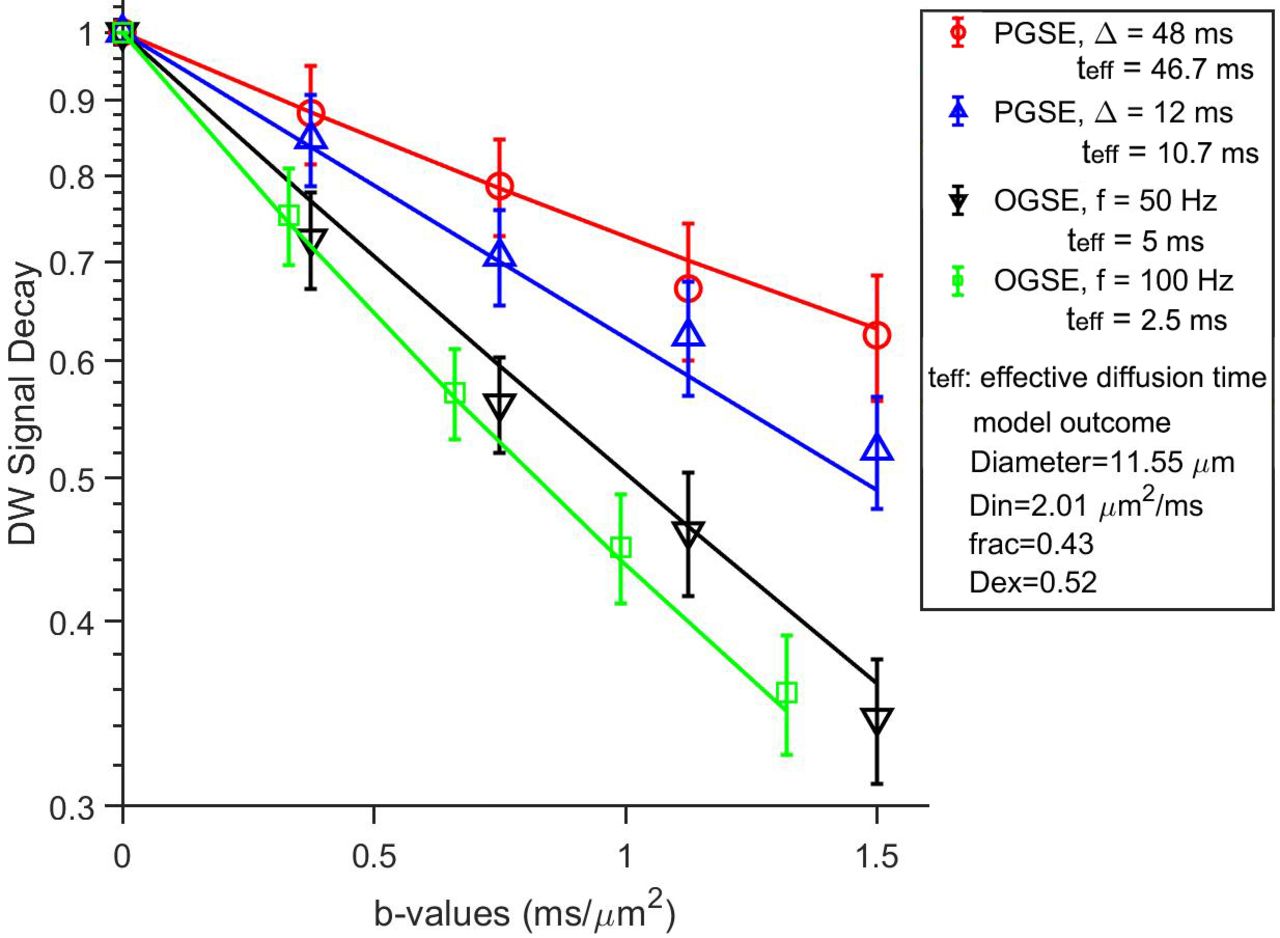
Typical normalized DW signals (mean±SD) for a single slice from a control IgG-treated tumor. The solid lines represent fits using the IMPULSED signal model. DW, diffusion-weighted; IMPULSED, Microstructural Parameters Using Limited Spectrally Edited Diffusion; OGSE, oscillating gradient spin echo; PGSE, pulsed gradient spin echo.
Figure 2 shows the IMPULSED-derived parametric maps for representative slices from control IgG treated, ICB non-responder, and ICB responder tumors, respectively, overlaid on T2-weighted images. Tumors were identified as hyperintense regions on T2-weighted images. Each of the parametric maps has physiologically reasonable values and shows regional heterogeneity that is not the same for each property. It may be noted that only few voxels (less than 1%) in the tumor for which cellular parameters could not be obtained due to the lack of measureable diffusion time dependency of tissue water, which may result from either insufficient SNR or very high fluid contents (eg, necrosis and/or edema). The voxel-wise precision analysis (online supplementary figure 1) shows that the RSD for the four fitted parameters, which reflect the uncertainty levels, are 5.6%±1.92%, 8%±2.8%, 14.7%±8.37%, and 5.6%±3.77%, respectively.

Representative T2-weighted images and parametric maps of cell size d, vin , Dex , and Din for control IgG treated, ICB non-responder, and ICB Responder tumors, respectively, at 16 DPI. ICB, immune-checkpoint blockade.
IMPULSED detects decreases in cell sizes associated with T cell elevation in response to ICB
Based on tumor growth curves as shown in figure 3A, we categorized the treated tumors into two groups (responding vs non-responding). ICB responders were identified as final tumor volumes less than 250 mm3 or tumors with stable or decreased volumes. The volume of 250 mm3 was chosen as all control IgG-treated tumors had volumes greater than 250 mm3 by 16 dpi. ICB responding tumors had a significantly higher percent of CD3+T cells as measured by histology than tumors from control or ICB responders at 16 dpi (figure 3B).
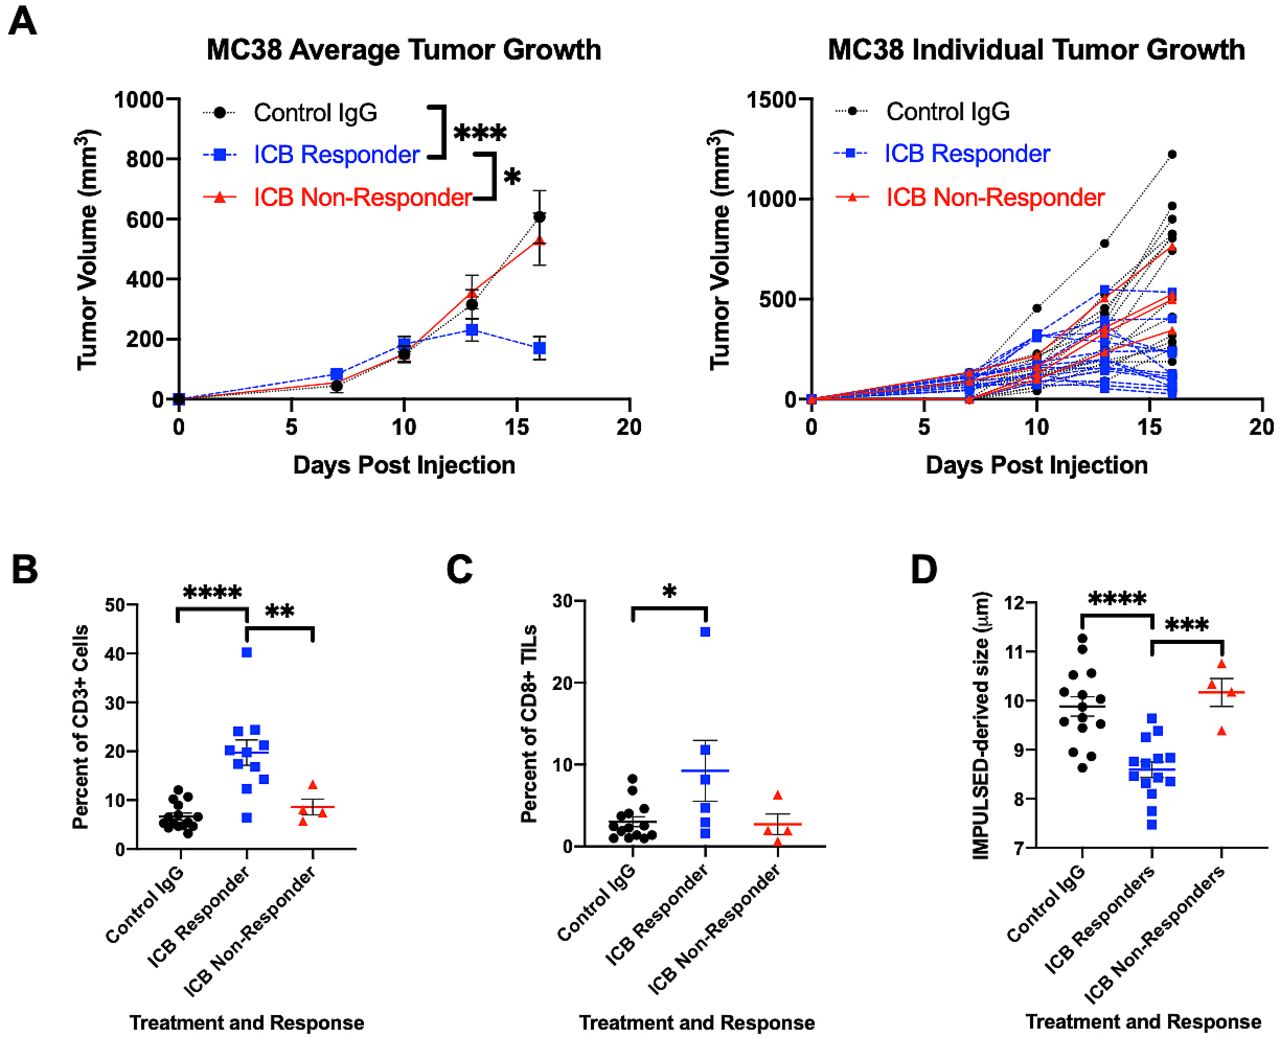
(A) Average (left) and individual (right) tumor volume of MC38 colon cancer tumors subcutaneously inoculated in 7–8 week-old C57BL/6 female mice and treated with either control IgG-treated (n=15) or combination immune-checkpoint blockade (ICB) of anti-PD-1 and anti-CTLA4 (n=18) as measured by MRI. ICB responders had final tumor volumes <250 mm3 or had tumors with stable or decreased volumes. tumor volumes depicted as mean±SE error of mean. (B) Tumors from ICB responders (n=11) had a significantly higher percent of CD3 +T cells as measured by immunohistochemistry compared with ICB non-responders (n=4) and control IgG-treated mice (n=15). (C) Tumors from ICB responders had a significantly higher percent of cytotoxic CD8+TILs as measured by flow cytometry analysis compared with control IgG-treated mice. (D) ICB responding tumors had a significantly smaller mean cell size as measured by impulse than tumors from control or ICB non-responders. Two-way ANOVA with Tukey post hoc test. P values used. *P<0.05, ***P<0.001, ****p<0.0001 as measured by two-way ANOVA for (B–D). ANOVA, analysis of variance; IMPULSED, Microstructural Parameters Using Limited Spectrally Edited Diffusion; TILs, tumor infiltrating lymphocytes.
Splenic and intratumoral immune changes between control IgG and ICB-treated tumors at 16 dpi were also analyzed by flow cytometry. In the tumor infiltrating lymphocytes (TILs), ICB responding mice had a significantly higher percent of CD8 +TILs compared with control mice, and ICB responding mice had a trend towards a greater percent of CD8 +TILs compared with ICB non-responding mice (figure 3C).
Spleens from ICB responding mice had significantly elevated percentages of CD8+compared with to control IgG-treated mice (online supplementary figure 3B). Similarly, ICB responding mice had elevated percentages of CD4+T cells compared with both control IgG and non-responding ICB-treated mice (online supplementary figure 3C).
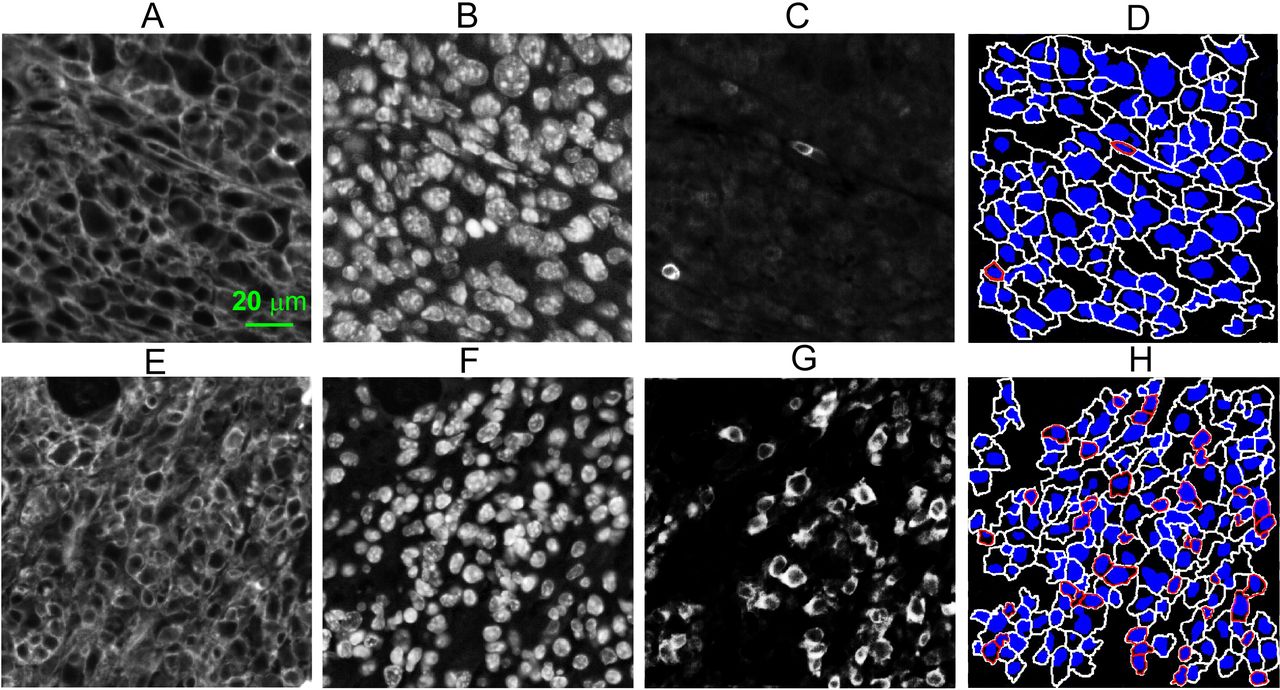
The average cell sizes of ICB responders as measured by IMPULSED are significantly smaller than those of control IgG-treated tumors or ICB non-responders, at 16 dpi (figure 3D). We subsequently validated the MR findings by performing immunohistochemical analyzes on tumor tissues collected at 16 dpi. Strong membranous Na+/K+-ATPase and CD3+staining in the tumor allows us to segment tumor cells and T cells easily and calculate mean cell sizes and T cell fractions for all the slides (figure 4). As shown in figure 5A, histology derived mean cell sizes including both tumor cells and T cells have a strong negative correlation (corr.=−0.9, p<0.0001) with T cell fractions. The mean cell size decreases about 1 µm with a 10% increase of CD3+T cell fraction. IMPULSED-derived cell sizes show a negative correlation (corr.=−0.64, p<0.0001) with T cell fractions (figure 5B). IMPULSED-derived cell sizes show a moderate correlation (corr.=0.52, p=0.008) with histology-derived cell sizes (figure 5C). It is noted that three out of nineteen ICB-treated tumors are not plotted in figure 5. For the unplotted three tumors, two had a significant response to ICB treatment and had shrank too much to be processed for histology. The third tumor underwent significant late-stage apoptosis/necrosis, resulting in poor cell membrane staining (online supplementary figure 2).

Examples of immunohistochemical analyzes of MC38 tumors treated with either control IgG (A–D) or checkpoint inhibitors (E–H). (A, E) Fluorescence images of Na+/K+-ATPase stained MC38 tumor cells; (B, F) fluorescence images of DAPI stained MC38 tumor cells; (C, G) fluorescence images of CD3 stained T cells; (D, H) segmented cells with blue nuclei and T cells outlined in red or tumor cells outlined in white.
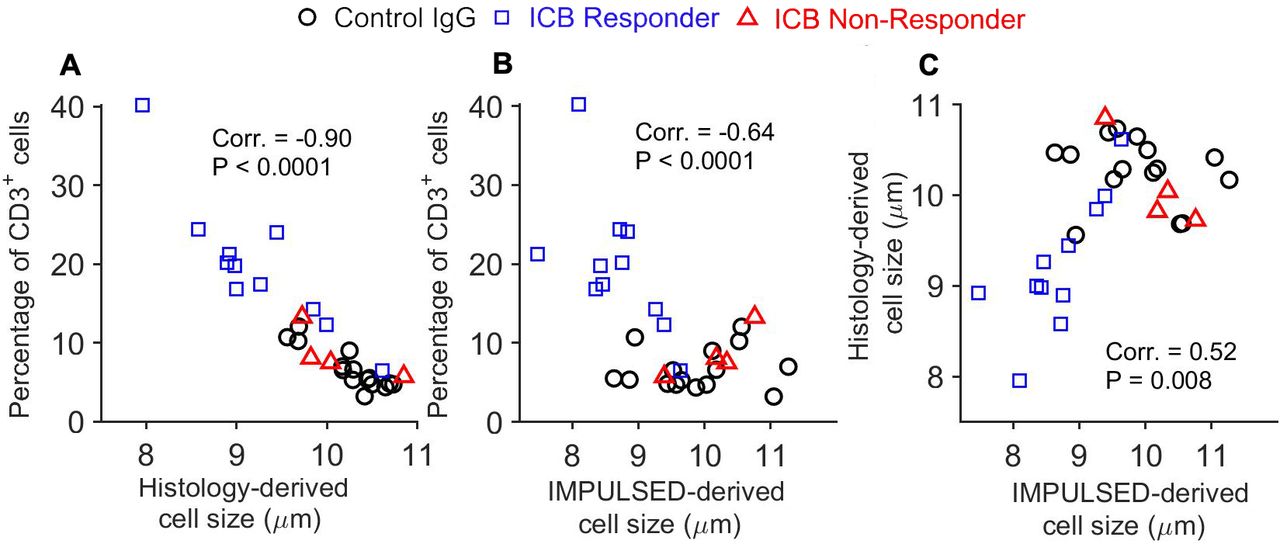
(A) Correlation between histology-derived cell sizes and percentage of CD3+ cells; (B) Correlation between IMPULSED-derived cell sizes and percentage of CD3+ cells; (C) correlation between histology-derived cell sizes and IMPULSED-derived apparent cell sizes. ICB, immune-checkpoint blockade; IMPULSED, Microstructural Parameters Using Limited Spectrally Edited Diffusion.
IMPULSED characterization of tumor response to check point inhibitors
To evaluate IMPULSED as a surrogate indicator of tumor response to checkpoint inhibitors, the dynamic changes of different metrics for control IgG-treated, ICB responding, and ICB non-responding mice are summarized in figure 6. The control IgG-treated tumors showed a decreasing conventional ADC (figure 6A), an increasing mean cell size d (figure 6B), an increasing intracellular volume fraction Vin (figure 6C), and a decreasing extracellular diffusion coefficient Dex (figure 6D). The ICB responders show a decreasing mean cell size d from 10 to 13 dpi (p=0.024). With Dex also decreasing from 7 to 10 dpi (p=0.028) followed by an increase in Dex from 10 to 16 dpi (p<0.0001). The mean cell size d differentiates the ICB responders from the control IgG-treated tumors at 13 (p<0.0001) and 16 dpi (p<0.0001). The conventional ADC, d, vin , and Dex , all show significant differences (p<0.05) between the control IgG-treated and the ICB responders at 16 dpi. The mean cell size d differentiates the ICB responders from the ICB non-responders at both 13 and 16 dpi (p=0.004 and 0.0003, respectively).

Temporal changes measured by conventional DWI and IMPULSED after either control IgG-treatment or dual ICB treatment in MC38 tumor models, including conventional ADC and IMPULSED-derived parameters (d, vin , Din , and Dex ). *P<0.05, **P<0.01, ***P<0.001, ****P<0.0001, as measured by two-way repeated-measures analysis of variance with a Tukey post-hoc test. ADC, Apparent Diffusion Coefficient; DWI, diffusion weighted imaging; ICB, immune-checkpoint blockade; IMPULSED, Microstructural Parameters Using Limited Spectrally Edited Diffusion.
We then further investigated the potential of IMPULSED-derived cell size as an early indicator of tumor response to checkpoint inhibitors in comparison with tumor growth. If we consider a <20% increase in tumor volume as an indicator of immune response as used in clinical practice,9 all 14 ICB responders can be differenciated from ICB non-responders and most control IgG-treated tumors at 16 dpi (figure 7A). However, only 7 out of 14 ICB responders can be identified at 13 dpi using the same threshold value of tumor growth rate. If we add a secondary criteria, defining the reponse as a combination of a decrease in IMPULSED-derived cell size and a<75% increase in tumor volume, a total of 12 ICB responders can be identified at 13 dpi (figure 7B).

Scatter plots of the percentage changes in tumor volume and IMPULSED-derived cell size for control IgG-treated, ICB responders, and ICB non-responders. ICB, immune-checkpoint blockade; IMPULSED, Microstructural Parameters Using Limited Spectrally Edited Diffusion.
Discussion
Sensitivity of IMPULSED method for assessing T cell infiltration
The sensitivity of IMPULSED for assessing T cell infiltration depends on the magnitude of cell size decreases due T cell infiltration, along with the magnitude of cell size changes that can be reliable detected by IMPULSED. In this study, our immunohistochemical analysis shows that the mean MC38 cell size is ~11 µm (online supplementary figure 4) and the overall mean cell size decreases about 1 µm (~10% of the tumor cell size) with a 10% increase of CD3+ T cell fraction in tumors (figure 5A). Given the results that approximately 1/3 of the ICB-treated mice show a >10% increase in CD3+ T cell fraction, a methodology that can reliably assess a 10% decrease of cell size in solid tumors would have significant clinical relevance. Although we were not able to investigate the repeatabliliy of IMPULSED on the same tumor for different time points (tumors were changing over time), we calculated the RSD values for the fitted cell sizes on a voxel-by-voxel basis following the approach described by Kellman et al, which have been shown to be equivalent to parameter variations obtained from multiple measurements.39 40 The mean cell size d as measured by IMPULSED has a very low RSD (~5% as shown in online supplementary figure 1), indicating a high precision of the fitted d with the current SNR level (~30 for b0 images in this study). The treatment response analysis (figure 6) shows that IMPULSED-derived d for the ICB-treated, responsive mice decreased from 9.3 at 10 dpi to 8.3 µm at 16 dpi, consistent with our immunohistochemical analysis. This demonstrates that the IMPULSED-derived mean cell size d is able to detect cell size decreases associated with treatment-induced T cell infiltration.
Specificity of IMPULSED method for assessing T cell infiltration
In this study, we evaluated a noninvasive imaging method to track T cell infiltration into tumors by monitoring temporal changes in mean cell sizes. Our method does not need to label T cells because they (5–10 µm) are significantly smaller than typical tumor cells (10–20 µm), which allows them to be distinguished by temporal diffusion MRI. However, the specificity of this approach is reduced when there are other biological processes which also change cell sizes. Different modes of cell death are commonly seen in ICB-treated tumors. Cell death typically follows one of two patterns: oncotic necrosis or apoptosis, and the latter has early and late stages that have different impacts on the specificity of IMPULSED.
Late stage apoptosis and necrosis: During late stages of apoptosis, cells separate into several apoptotic bodies. Cellular death due to necrosis results in the loss of cell membrane integrity and an uncontrolled release of cellular contents into the extracellular space. Although such changes might hinder extracellular water movement, necrotic bodies, apoptotic bodies and fragments of cellular debris are too small to influence the cell size measurements in the regimen of interest as IMPULSED emphasizes the effects of restrictions in a specific size range (eg, 5–25 µm in this study). Thus, water diffusion in necrotic/late apoptotic regions appears to be relatively ‘unrestricted’ and the corresponding ADC values show very small diffusion time dependency within the diffusion time range (~2 to 100 ms) available in current preclinical and clinical settings. We therefore can use this insensitivity to diffusion time to identify regions of necrosis or late apoptosis,31 and hence necrosis and late apoptosis do not affect the specificity of IMPULSED to detect T cell infiltration (online supplementary figure 2C).
Because cell shrinkage is one of the characteristic morphological changes that occur during the early stages of apoptosis, it might be challenging to distinguish how much cell size changes arise from either T cell infiltration or cells undergoing early apoptosis. In this study, there are no significant differences in the average tumor cell size (T cells were excluded) between control IgG-treated and ICB-treated tumors as shown in online supplementary figure 4. This observation suggests that in the specific animal model used in this study, the mean cell size decrease detected is mainly attributed to T cell infiltration and cell size changes due to early apoptosis are negligible. For future studies using treatment models in which both T cell infiltration and apoptosis have significant influence on changes of cell size, quantification of the degree of apotpsis with TUNEL or caspase immunohistochemistry in concert with cell membrane staining would shed light on the origin of cell size decreases. Also, it is possible to distinguish T cell infiltration from early apoptosis by including more IMPULSED-derived parameters. For example, the intracellular diffusion coefficient Din may illuminate the mechanism of decreasing cell sizes. As reported previously,30 decreasing intracellular diffusion coefficients may be associated with cytoplasmic condensation, a morphological feature of early-stage apoptosis. By contrast, T cell infiltration should not change the intracellular diffusion coefficient. A combination of Din and cell size d values is thus potentially able to increase the specificity for assessing T cell infiltration.28 However, as shown in online supplementary figure 1, estimates of Din have a relatively high RSD (~15%), so that Din obtained with our current imaging protocol may not be able to detect small changes (<15%). As reported by Xu et al, a precise estimation of Din in human imaging requires diffusion data with a high SNR (>100) and/or high oscillating gradient frequencies, which may be available only with cutting-edge advanced hardware.41 Finally, it should be kept in mind that our end goal is to use IMPULSED-derived parameters as noninvasive, imaging markers of treatment response, and both T cell infiltration and apoptosis are biomarkers of successful treatment. Therefore, this decreases the specificity to T cell infiltration but does not decrease the specificity to assess treatment response, which is our goal.
An increase in T cell size has been correlated to T cell proliferation following activation, an important component of the immune-response following ICB. The magnitude of cell size increase following T cell activation depends on multiple factors, including T cell receptor (TCR) signaling, costimulation, and signals from cytokines, which vary among different types of tumor and immunotherapy as well as different study settings (eg, in vitro cell experiment vs in vivo xenograft). In this study, there is no significant difference between the mean T cell sizes for control IgG-treated and ICB-treated tumors (online supplementary figure 4) measured by histology, suggesting that the T cell activation in our animal model has a minor effect on cell sizes. However, there are other in vitro studies reporting apparent cell size increases following T cell activation. Teague et al reported that the mean cell sizes of human CD3+T cells increased from 7.5 to 9.7 um (~30% increase) in an activation kinetics assay as measured by video microscopy and digital image analysis.21 K N. Pollizzi et al reported that the mouse Naïve CD4+T cells showed a~45% increase in DNA content or cell volume following TCR stimulation and appropriate co-stimulation, which approximately corresponds to 12% increase in cell diameter.22 Although the reported T cell sizes with or without activation are still smaller than typical tumor cell sizes (10–20 µm), such a variation in the sizes of naïve, ‘dormant’, and activated T cells could be a confounding factor for the use of IMPULSED-derived mean cell size, which represents the average restriction size in each imaging voxel, as a surrogate indicator of T cell infiltration in applications with relatively small cancer cells. There have been several recent reports estimating non-parametric cell size distributions in biological tissues using diffusion MRI-based methods.42–45 Deriving the cell size distribution within a voxel or region would potentially improve both the sensitivity and specificity of IMPULSED for assessing cell size changes. However, one important point should be kept in mind: the more complicated the signal model becomes, the higher SNR that is required to obtain stable fittings. SNR improvements are usually made at a cost of either increasing scanning time (eg, more acquisitions) or losing spatial information (eg, ROI-based quantitative analyzes), and therefore, choices of methodological details need to be examined on a case-by-case basis.
Correlation of IMPULSED method with flow cytometry analysis
Clinically, a tumor that stays a stable size or decreases in size to any degree is considered as a positive responder to ICB. Therefore, the volumetric grouping of responders and non-responders was used to analyze IMPULSED-derived cell sizes for these groups. The ICB responders had significantly smaller tumors than both the control IgG-treated mice and the ICB non-responders, but there were no significant differences between control IgG-treated mice and the ICB non-responders. Flow cytometry of the spleens also showed elevated CD4+and CD8+T cells of responding ICB-treated mice compared with control IgG-treated mice, with a significant difference of CD4+T cells between responding and non-responding ICB-treated mice (online supplementary figure 3B and C). The splenic T cell elevations were similar to those seen in other murine ICB models.46 47 In the tumors, the ICB responders had a larger percentage of CD8+T cells than control IgG-treated mice. IMPULSED showed that the ICB responder tumors had significantly smaller mean cell sizes than both control IgG-treated tumors and ICB non-responder tumors (figure 3D). Increased immune cell infiltration of the tumors results in a decrease in mean cell size. Together, these findings suggest IMPULSED has the potential to identify tumors that are responding to anti-PD-1 treatment.
Translation to human study
The gradient strength Gmax=360 mT/m used here is currently not achievable on any traditional commercial MRI scanner, which makes it challenging to translate the precise protocol used here to routine clinical systems. However, we have previously implemented IMPULSED on a clinical Philips Achieva 3T scanner for imaging breast cancer patients using a gradient strength<80 mT/m and slew rate<100 mT/m/sec, which is commonly achievable for state-of-the-art clinical scanners. Although the sensitivity to Din is then low due to hardware limitations, the measurement of cell size d is still reliable, making it possible to use IMPULSED to monitor T cell infiltration. Recently, there have been rapid improvements in the development of advanced gradient coils for human imaging such as the Human Connectome 1.0 coil (Gmax=300 mT/m)41 and Human Connectome 2.0 coil (Gmax=500 mT/m).48 Both will make it more possible to translate the IMPULSED protocol used here to human imaging.
Limitations of current study
We validated our working hypothesis in only a single animal model. This approach should be further evaluated in additional ICB animal models, including different treatment options and different cancer cell lines. The working hypothesis of IMPULSED for T cell tracking is based on the size differences between cancer cells and T cells, which is appropriate for most cancer applications.25 The magnitude of change in the T cell population in response to ICB, and the resulting changes in mean cell size, needs to be investigated further using the IMPULSED method, correlating the findings further with additional histology and flow cytometry studies.
Here, the temporal changes in the mean values of IMPULSED-derived parameters over tumor ROIs were used to assess tumor response. Other novel analyzes of heterogeneity (eg, functional diffusion maps and ADC histograms,49–51 texture analysis,52 and radiomics approaches53) have been shown to add value for tumor staging, classification, and treatment response assessment. Our parametric maps show significant heterogeneity across tumor regions (figure 2). This variation was not investigated in detail in this study because our primary goal here is to validate an innovative concept that makes use of diffusion MRI based cell size quantification for assessing T cell infiltration. Considering the significant tumor heterogeneity observed in humans, a detailed exploration of local variations of IMPULSED-derived parameters (eg, combinations of IMPULSED and histogram analysis) and their temporal changes in response to treatments is ongoing.
Conclusion
This proof-of-concept study has validated IMPULSED as a method for quantifying the decreased mean cell size associated with immunotherapy-induced T cell infiltration in a murine colon cancer model. We have also shown the power of using IMPULSED-derived cell size as an imaging marker for differentiating responsive and non-responsive tumors after treatment by check point inhibitors, a current clinical challenge that is not solved by simply monitoring tumor growth. Data presented in this study provide compelling evidence to justify further evaluation of IMPULSED in preclinical and clinical applications.
Acknowledgments
The authors would like to thank Dr. Fuxue Xin for his help on in vivo MRI of mice.
References
Footnotes
Correction notice This article has been corrected since it was published Online First. The author name ‘J Oliver McIntyre’ was incorrectly spelt as ‘Oliver J McIntyre’.
Contributors XJ, SD, KEB, OJM and KY participated in the design and/or interpretation of experiments. XJ, SD, EM and KEB participated in the acquisition and/or analysis of experimental data. JCR, JCG and JX provided supervisory support. All authors participated in writing and/or revising the manuscript and approved the final manuscript.
Funding This study was funded by National Cancer Institute; grand number (5R01CA109106-13).
Competing interests None declared.
Patient consent for publication Not required.
Ethics approval All animal studies were approved by the Institutional Animal Care and Usage Committee at Vanderbilt University under protocol M1800025.
Provenance and peer review Not commissioned; externally peer reviewed.
Data availability statement Data are available on reasonable request. Please contact XJ (xiaoyu.jiang@vumc.org) for all the data.