Article Text

Abstract
Background To control gene expression, microRNAs (miRNAs) are of key importance and their deregulation is associated with the development and progression of various cancer types. In this context, a discordant messenger RNA/protein expression pointing to extensive post-transcriptional regulation of major histocompatibility complex (MHC) class I molecules was already shown. However, only a very limited number of miRNAs targeting these molecules have yet been identified. Despite an increasing evidence of coding sequence (CDS)-located miRNA binding sites, there exists so far, no detailed study of the interaction of miRNAs with the CDS of MHC class I molecules.
Methods Using an MS2-tethering approach in combination with small RNA sequencing, a number of putative miRNAs binding to the CDS of human leukocyte antigen (HLA)-G were identified. These candidate miRNAs were extensively screened for their effects in the HLA-G-positive JEG3 cell line. Due to the high sequence similarity between HLA-G and classical MHC class I molecules, the impact of HLA-G candidate miRNAs on HLA class I surface expression was also analyzed. The Cancer Genome Atlas data were used to correlate candidate miRNAs and HLA class I gene expression.
Results Transfection of candidate miRNAs revealed that miR-744 significantly downregulates HLA-G protein levels. In contrast, overexpression of the candidate miRNAs miR-15, miR-16, and miR-424 sharing the same seed sequence resulted in an unexpected upregulation of HLA-G. Comparable results were obtained for classical MHC class I members after transfection of miRNA mimics into HEK293T cells. Analyses of The Cancer Genome Atlas data sets for miRNA and MHC class I expression further validated the results.
Conclusions Our data expand the knowledge about MHC class I regulation and showed for the first time an miRNA-dependent control of MHC class I antigens mediated by the CDS. CDS-located miRNA binding sites could improve the general use of miRNA-based therapeutic approaches as these sites are highly independent of structural variations (e.g. mutations) in the gene body. Surprisingly, miR-16 family members promoted MHC class I expression potentially in a gene activation-like mechanism.
- HLA
- oncology
- molecular biology
This is an open access article distributed in accordance with the Creative Commons Attribution Non Commercial (CC BY-NC 4.0) license, which permits others to distribute, remix, adapt, build upon this work non-commercially, and license their derivative works on different terms, provided the original work is properly cited, appropriate credit is given, any changes made indicated, and the use is non-commercial. See http://creativecommons.org/licenses/by-nc/4.0/.
Statistics from Altmetric.com
Background
The regulation at the post-transcriptional level substantially contributes to the control of gene expression. In this context, microRNAs (miRNAs) play a key role and their altered expression has been associated with the development and progression of various diseases, including cancer.1
Recently, Alles and coworkers estimated around 2.300 miRNAs.2 These non-coding 21–24 nt long RNAs direct the RNA-induced silencing complex (RISC) with an Argonaute protein as the essential component via base complementarity to target messenger RNAs (mRNAs). Finally, the interaction of RISC and mRNA usually results in the degradation and/or translational repression of the specific RNA.3 Although it is widely accepted that an miRNA-dependent regulation is largely facilitated through binding to the 3′-untranslated region (UTR) of mRNAs, there is raising evidence for miRNAs targeting the 5′-UTR and/or coding sequence (CDS) of transcripts.4–6 Given the fact that the CDS harbors a variety of regulatory sequences, the binding of miRNAs might affect the overall structure, alternative splicing and polyadenylation. Moreover, an miRNA binding could also modulate to a variable extent and time kinetics the protein abundance.4 However, according to Hausser et al, miRNAs directed to the CDS are less effective in protein deregulation than 3′-UTR targeting miRNAs.7 Depending on the cellular status, the interaction of RISC and mRNA might lead to translational activation rather than its repression, which was first shown for miR-369.8 9 Termed as RNA activation (RNAa), it was shown that nuclear localized RISC enable the upregulation of gene expression (eg, miR-589 and Cox2 gene). However, details how RNAa facilitates gene activation are not understood.10
A discordant mRNA/protein expression pointing to an intense post-transcriptional regulation was shown for major histocompatibility complex (MHC) class I molecules and antigen processing components in a number of different studies.11–13 MHC class I molecules, also known as human leukocyte antigen (HLA) class I, are key players for the adaptive immunity by presenting endogenous peptides to immune effector CD8+ T cells.14 15 This system provides a defense against neoplastic cells, since tumor antigens will be displayed via HLA to cytotoxic T lymphocytes (CTLs). However, cancer cells have acquired the ability to evade the recognition and destruction by CTL by distinct strategies, including the modulation of HLA class I expression as demonstrated in a broad range of human solid and hematopoietic malignancies.16
The classical HLA class I antigens, including HLA-A, HLA-B, and HLA-C are constitutively expressed in most cell types but are frequently downregulated in tumors. While the underlying molecular mechanisms like structural alterations (eg, inactivating mutations), epigenetic modifications (eg, methylation or histone acetylation) and transcriptional regulation have been well characterized,16 the post-transcriptional regulation of these molecules is only poorly understood. Until now, solely miR-148a was shown to target and affect HLA-C expression.17
With a restricted physiological expression to immune-privileged organs, HLA-G is a member of the non-classical HLA class I antigens and is further characterized by its immune suppressive properties due to negatively interfering with the T-cell and natural killer (NK)-cell activities.18 A number of HLA-G-specific miRNAs, mainly members of the miR-148/miR-152 family, have recently been identified, which target the 3′-UTR of HLA-G. These miRNAs inhibit HLA-G expression and increase the cytotoxic activity of NK cells and lymphokine-activated killer cells.19–21
Due to the increasing evidence that miRNAs can also bind to the CDS of mRNAs, this study aimed to identify HLA-G CDS-targeting miRNAs to analyze their effect on the expression of this important immune modulatory molecule and to determine their clinical relevance.
Materials and Methods
Cell lines and tissue culture
The HLA-G positive choriocarcinoma cell line JEG3, the human embryonal kidney cell line HEK293T, the breast cancer (BC) cell lines MCF-7 and HCC1806, the renal cell carcinoma (RCC) cell line MZ2905RC, and the colorectal carcinoma (CRC) cell lines HCT-116 and HT-29 were purchased from the American Type Culture Collection. With the exception of HEK293T cells, which were maintained in Dulbecco's Modified Eagle Medium (Invitrogen), all other cell lines were cultured in Roswell Park Memorial Institute 1640 Medium (Invitrogen) supplemented with 10% (v/v) fetal bovine serum (PAA laboratories), 0.1 mM non-essential amino acids (Gibco), 2 mM L-glutamine (Lonza), and 1% penicillin/streptomycin (v/v, PAA laboratories) and incubated at 37°C, 5% CO2.
Transfection and luciferase (luc) reporter gene assay
For miRNA transfection, cells were seeded at 1×10⁵ cells/well in 12-well plates, and after 16 hours, cells were transfected with miRNA mimics or controls (Sigma), respectively, at a final amount of 10 pmol using Lipofectamine RNAi MAX (Invitrogen) according to the manufacturer’s protocol. For increasing the effect of miRNAs, mimics were transfected under the same conditions after 48 hours. Cells were harvested 24 or 48 hours after transfection and either directly subjected to analysis or frozen down until use. A similar protocol was used to transfect miRNA inhibitors or controls (Sigma) at a final amount of 50 pmol per well.
For the luc reporter assay, 1×10⁴ HEK293T cells/well were seeded in a 96-well plate. After 16 hours, 10 ng of the reporter plasmid (pmirGLO Dual-Luciferase miRNA Target Expression Vector, Promega), in combination with respective miRNA mimic or control (Sigma) at a final concentration of 25 nM, was transfected using Lipofectamine 2000 reagent (Invitrogen) according to the manufacturers’ protocol. Luc activity was determined 48 hours after transfection using the Dual-Glo Luciferase substrate (Promega) according to the manufacturer’s protocol. Luminescence was detected by a Tecan Infinite 200 Pro plate reader device. Relative luc activity was determined by normalizing the firefly reporter to renilla luc activity.
RNA isolation, cDNA synthesis and quantitative PCR
Total RNA was isolated from cells using the NucleoSpin miRNA kit (Macherey & Nagel) according to the manufacturers’ instructions, followed by DNase I treatment (NEB). RNA quality and quantity were assessed by spectrophotometric analysis, and 500 ng of total RNA was used for cDNA synthesis (RevertAid H Minus First Strand cDNA synthesis kit, Fermentas). For miRNA-specific cDNA synthesis, a miRNA-specific stem-loop primer was used,22 while reverse transcription of mRNAs required a random hexamer primer (Fermentas). Expression levels were analyzed by quantitative reverse transcription PCR using GoTaq qPCR Master Mix (Promega). For all primer pairs, an annealing temperature of 61°C was used. Relative changes of mRNA/miRNA amounts were determined by the ΔΔCt method23 using glyceraldehyde-3-phosphatedehydrogenase (GAPDH) or U6 RNA for normalization. All primers are listed in online supplementary table 1.
Supplemental material
Protein isolation and western blotting
Total protein was extracted from 2×10⁵ cells using Radioimmunoprecipitation assay buffer (25 mM Tris–HCl pH 7.6, 150 mM NaCl, 1% NP-40, 1% sodium deoxycholate, 0.1% sodium dodecyl sulfate), and protein concentration was determined employing the Pierce BCA Protein Assay Kit (ThermoFisher).
For western blot analysis, 25 µg of protein/sample was separated by sodium dodecyl sulfate–polyacrylamide gel electrophoresis and transferred onto a nitrocellulose membrane by semidry blot. For detection of proteins, the following antibodies were used: anti-HLA-G antibody MEM-G/9 (Novus Biologicals), anti-Argonaute-2 antibody C34C6 (CST), anti-maltose-binding protein (MBP) antibody ab9084 (Abcam), anti-glyceraldehyde-3-phosphatedehydrogenase antibody 14C10 (CST), and anti-β-actin antibody ab8227 (Abcam). As secondary antibody, a horseradish peroxidase conjugated goat anti-α-mouse/rabbit antibody (CST) was used. Chemiluminescent blots were imaged by LAS-3000 Imaging System (Fuji). For densitometric analysis of western blot signal intensity, ImageJ software24 was used.
Flow cytometry
For flow cytometric analyses, the following antibodies were employed: the phycoerythrin-labeled anti-HLA-G monoclonal antibody (mAb) MEM-G/9 (ThermoFisher), the anti-HLA-ABC mAb W6/32 (eBioscience) and the respective isotype controls (Beckman Coulter, Krefeld, Germany). Cells were stained with mAbs at concentrations recommended by the manufacturers as recently described. The measurements were performed with a BD LSR Fortessa unit (Becton Dickinson). FlowJo software (FlowJo, LLC) was used for analyses and to display flow cytometry results. The results are presented as mean fluorescence intensity and were normalized relative to the respective mock control.
Actinomycin D assay
Prior to the actinomycin D assay, cells were transfected with respective miRNA mimics as described previously. RNA was isolated at various time points after treatment with actinomycin D (10 µg/mL, Merck). HLA-G mRNA levels were analyzed by qRT-PCR using ALAS1 for normalization.
miRNA enrichment assay (miTRAP) and small RNA sequencing
To identify potential miRNAs targeting the CDS of HLA-G, the miTRAP method25 was employed, which was recently published.26 Briefly, CDS of HLA-G (accession number NM_002127) lacking the start ATG was cloned upstream of two MS2 loops. T7 promoters based in vitro transcripts (T7 Ribomax, Promega) were purified using the MEGAclear Transcription Clean-Up Kit (Invitrogen). By application of 100 pmol of fusion protein consisting of the MS2 loop and MBP domains, in vitro transcribed RNAs (HLA-G CDS and control sequence encoding the two MS2 loops only) were immobilized on amylose resin (NEB). After washing and blocking steps, RNA was incubated with the cytoplasmic cell lysate of the RCC cell line MZ2905RC (HLA-G mRNA+/protein−) enabling the specific binding of miRNAs to the sequence. Extensive washing reduced unspecific binding, and elution was carried out with 10 mM maltose solution followed by phenol/chloroform RNA extraction. RNA eluates were either used for cDNA synthesis of candidate or control miRNAs or applied for small RNA sequencing (small RNA-seq).
Small RNA-seq of miTRAP eluates was carried out at Novogene (Hong Kong). In brief, sequencing libraries were generated using NEBNext Multiplex Small RNA Library Prep Set for Illumina (NEB, USA) following manufacturer’s recommendations. Subsequent PCR amplifications were performed using the LongAmp Taq 2X Master Mix, SR Primer for Illumina and index primer (NEB, USA). PCR products were purified on an 8% polyacrylamide gel, and DNA fragments corresponding to ~140 to 160 were recovered. Library quality control was assessed on an Agilent Bioanalyzer 2100 system using DNA High Sensitivity Chips (Agilent, USA). Clustering of the index-coded samples was performed on a cBot Cluster Generation System using TruSeq SR Cluster Kit v.3-cBot-HS (Illumina, USA) according to the manufacturer’s instructions. The library preparations were sequenced on an Illumina Hiseq 2500/2000 platform and 50 bp single-end reads were generated. Small RNA tags were mapped to the miRBase V.20.0 provided reference27 by Bowtie (bowtie-0.12.9, main parameter: -v 0 k 1)28 without mismatch to analyze their expression and distribution on the reference. Expression levels were estimated by TPM (transcript per million) through the following criteria29: normalized expression=mapped readcount/total reads×1 000 000.
A summary of the miRNA read counts obtained for the HLA-G CDS and MS2 control, as well as a list with all tools used for RNA-seq analysis (with their main parameter) is provided in online supplementary data 1. Further RNA-seq characteristics are provided in online supplementary table 2.
Supplemental material
In silico analysis and statistics
For miRNA binding prediction, different algorithms, including miRDB,30 miRWalk,31 miRcode,32 TargetScan,33 and RNA2234 with their default parameters were used. For correlation of miRNA and mRNA expressions, the online tool CancerMiner (last access December 2018)35 provided relevant data. The identification of the miR-16 and miR-744 binding site in HLA molecules was derived from the RNA22 software by using the following criteria: sensitivity of 63%, specificity of 61%; seed size of 7, allow a maximum one unpaired bases in seed; minimum number of paired-up bases in heteroduplex=12; maximum folding energy for heteroduplex (kcal/mol)=−12; maximum number of Guanine:Uracil wobbles allowed in the seed region=no limit.
Prism software (GraphPad) was used for calculating mean, SD or t-test as well as displaying results. For the two-sided t-test unequal variances have been selected. The data were significant with a p value<0.05. The number of biological replicates is given as n.
Results
Identification of HLA-G CDS targeting miRNAs
We and others have recently shown that HLA-G is post-transcriptionally regulated by miRNAs (eg, miR-148/miR-152 family) via binding to its 3′-UTR.19–21 For a more comprehensive understanding of the miRNA-mediated regulation of HLA-G, the interaction of miRNAs with the HLA-G CDS was determined. For using an advanced MS2-tethering approach called miRNA trapping by RNA in vitro affinity purification (miTRAP),25 the HLA-G CDS (accession number NM_002127) was inserted upstream of two MS2 repeats enabling the in vitro transcription of HLA-G CDS fused to two MS2 loops (figure 1A). Due to the rather long size of the RNA (1165 nt) and to assess conceivable steric interference, binding properties to the MS2 loop binding protein were analyzed and ~20% of the bait RNA immobilized to the resin was found (online supplementary figure 1).
Supplemental material
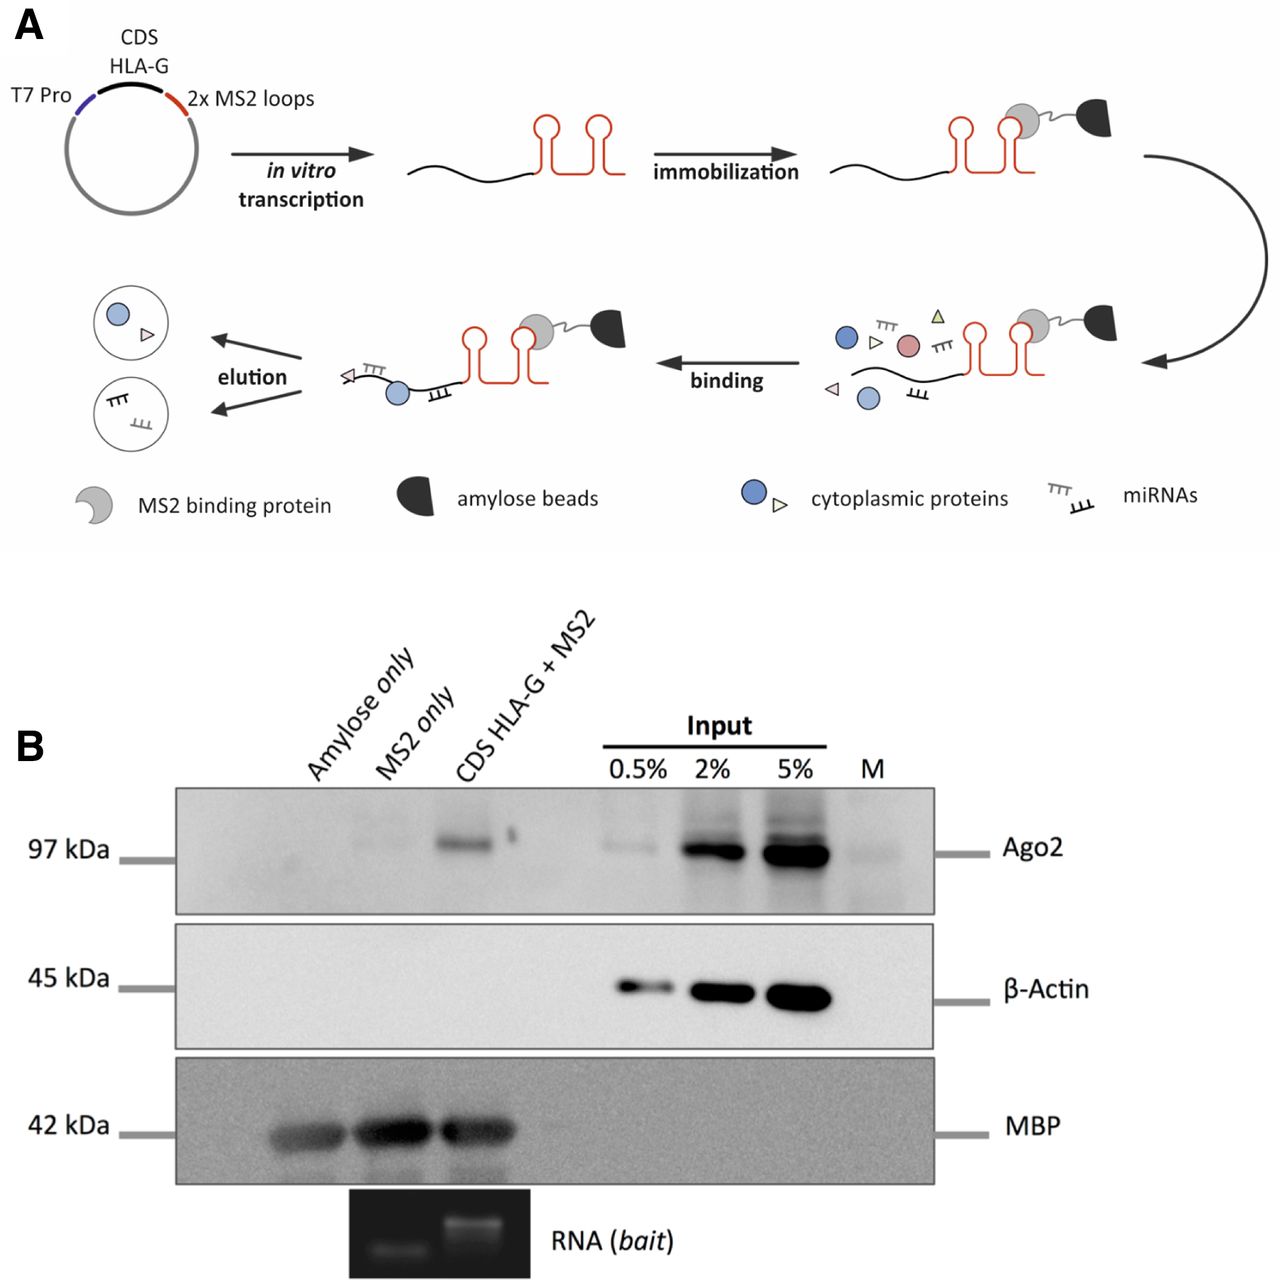
Scheme of RNA affinity purification and RISC-binding via CDS of HLA-G. (A) Procedure of HLA-G CDS RNA affinity purification (miTRAP) to identify coprecipitated proteins and miRNAs. (B) Western blot analysis of indicated proteins after miTRAP procedure. Argonaute 2 (AGO2) detection indicates the presence of copurified miRNAs in the HLA-G CDS eluate. Actin is used as internal negative control. Probing for MBP ensures equal loading of the resin. Integrity of the bait RNAs is analyzed by guanidine thiocyanate gel electrophoresis. CDS, coding sequence; HLA, human leukocyte antigen; MBP, maltose-binding protein; miRNA, microRNA; miTRAP, miRNA enrichment assay; RISC, RNA-induced silencing complex.
To analyze a potential CDS-dependent post-transcriptional regulation of HLA-G by miRNAs, the co-precipitated RNA and proteins were purified after RNA affinity purification. As shown in figure 1B, an enriched binding of the RISC component Argonaute 2 to the HLA-G CDS indicated an association with miRNAs. Accessible Argonaute 2-CLIP data further support the binding to the CDS of HLA-G.31 36 Interestingly, increased levels of the co-precipitated Argonaute 2 protein was found in the CDS miTRAP eluate compared with the 3’-UTR of HLA-G suggesting an intense miRNA-dependent regulation via the CDS of HLA-G (online supplementary figure 1). In a first attempt, miRDB software tool30 was used to predict high ranked miRNAs potentially targeting the HLA-G CDS, since it provides a target score allowing the ranking of miRNA candidates. The miRNAs miR-4749–3 p (score 77, rank 1), miR-1915–5 p (score 68, rank 4) and miR-654–5 p (score 67, rank 5) were selected for further analyzes due to their high rank and the fact to show detectable expression in the chosen cell line for miTRAP analysis. However, an enhanced binding of these miRNAs in the miTRAP eluate was not detected, indicating a more complex miRNA target selection. Therefore, copurification of miRNAs was assessed by high-throughput small RNA-seq. Libraries were generated from the HLA-G CDS and MS2 control miTRAP eluates. Length distribution of sequenced reads showed an accumulation of 21–24 nt RNAs, indicating an miRNA enrichment in miTRAP eluates (online supplementary figure S2 and online supplementary table S1).
Supplemental material
After evaluation of the normalized read counts (TPM) for the HLA-G CDS and MS2 control, highly stringent criteria for the enrichment of an miRNA like (1) TPM observed in the HLA-G miTRAP eluate >2500; (2) TPM observed in the control miTRAP eluate <300; and (3) enrichment ratio of >50 were applied; finally, (4) a specific binding site for the respective miRNA candidates within the HLA-G CDS needed to be predicted by at least two out of four applied algorithms to ensure a potential interaction of miRNA candidate and HLA-G.
This selection resulted in a total of six miRNAs enriched in the HLA-G miTRAP eluate (table 1). Noteworthy, the miRNAs miR-15a/b, miR-16 and miR-424 can be classified as an extended miR-16 family37 which share the same seed sequence and most likely compete for the same binding site. In accordance with our preliminary analysis, the miRNAs miR-4749–3 p, miR-1915–5 p and miR-654–5 p were not found to be enriched in the HLA-G CDS eluate compared with the control (online supplementary data 1).
HLA-G CDS associated miRNAs
For validation of RNA-seq results, the miTRAP analysis was repeated and co-purification of candidate miRNAs was determined by quantitative reverse transcription PCR. In order to assess enrichment, the miRNA abundance in the miTRAP eluate fraction normalized to the input (miTRAP ratio)25 was investigated demonstrating an accumulation of the indicated miRNAs in the HLA-G eluate compared with the MS2 control. This enrichment was accompanied by a high ratio of precipitation relative to the input. In contrast, selected control miRNAs showed significantly lower miTRAP ratios (figure 2A). The selective co-purification of the candidate miRNAs indicated a potential binding to the CDS of HLA-G.
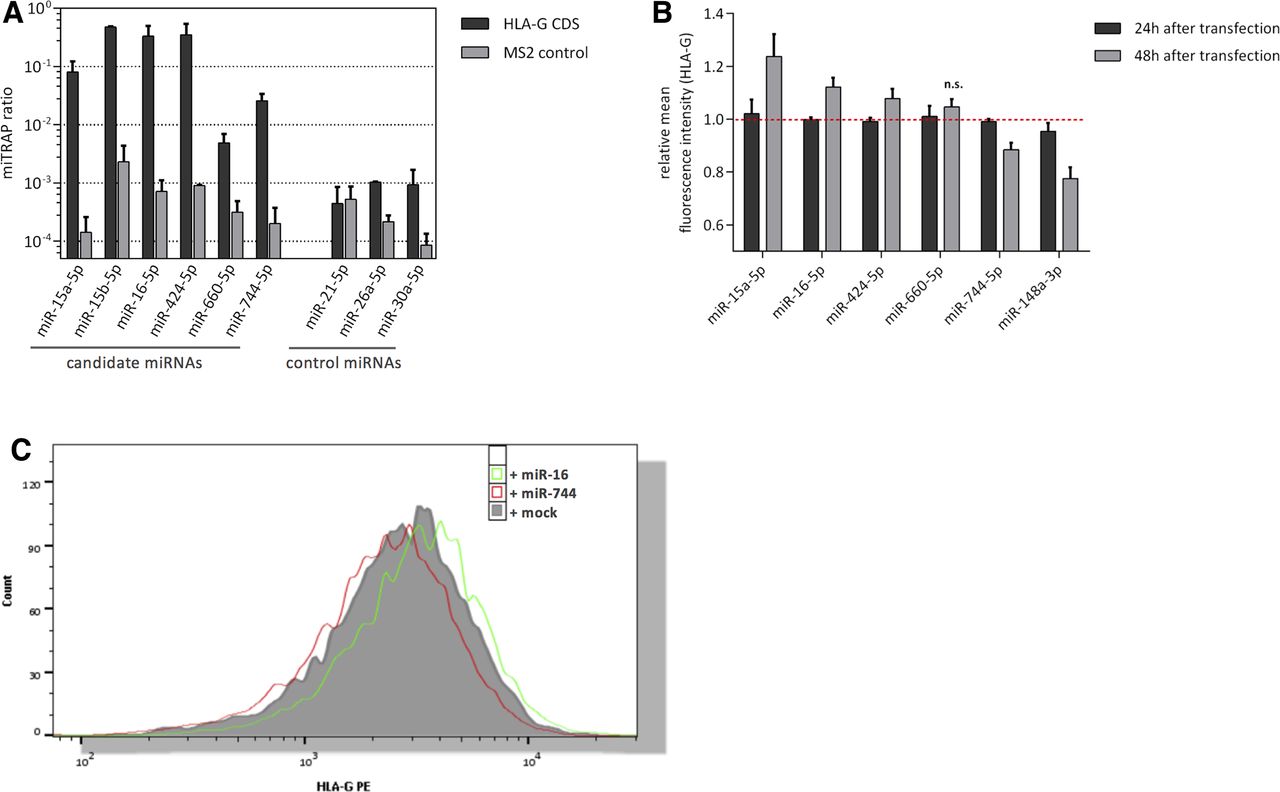
Analysis of HLA-G CDS-specific miRNA candidates. (A) Validation of HLA-G CDS-associated miRNAs obtained from RNA-seq by quantitative reverse transcription PCR. HLA-G and MS2 control miTRAP eluates were used to quantify candidate and control miRNAs. Results are displayed relative to the input level (=miTRAP ratio). (B) Flow cytometric analysis of HLA-G surface expression 24 and 48 hours post-transfection of candidate miRNA mimics in JEG3 cells. HLA-G 3’-UTR targeting miR-148a was used as positive control. Observed effects 48 hours after miRNA transfection are significant (p<0.05, Student t-test) except for miR-660 (n=4). (C) Flow cytometric histogram showing HLA-G PE signal for JEG3 miR-16 and miR-744 transfectants relative to mock controls. CDS, coding sequence; HLA, human leukocyte antigen; miRNA, microRNA; miTRAP, miRNA enrichment assay; PE, phycoerythrin; UTR, untranslated region.
Screening of candidate miRNAs in JEG3 cells
To analyze putative effects of the candidate miRNAs on HLA-G expression, HLA-G positive JEG3 cells were transiently transfected with respective miRNA mimics, before the HLA-G surface expression was evaluated after 24 or 48 hours, respectively, using flow cytometry (figure 2B). Due to the high sequence similarity of miR-15a and miR-15b, miR-15b was excluded from further analysis.
Neither the candidate miRNAs nor the positive control miR-148a (targeting HLA-G 3′-UTR) had a significant impact on HLA-G expression 24 hours post miRNA mimic transfection confirming reports of high MHC class I protein stability.38 However, reduced HLA-G surface expression was observed for miR-148a and the candidate miR-744 after 48 hours of transfection. As expected from previous reports describing lower effects of CDS-located binding sites,7 the impact for miR-744 was weaker compared with miR-148a. Surprisingly, 48 hours post-transfection, the extended miR-16 family members exhibiting the same seed sequence important for target mRNA binding showed a significant upregulation of HLA-G on the surface of JEG3 cells, while overexpression of miR-660 did not significantly modulate HLA-G surface expression on JEG3 cells. Based on these results, the further analyses focused on miR-744, whose overexpression resulted in the expected downregulation of HLA-G, and on miR-16 as one member of the extended miR-16 family, whose overexpression revealed increased HLA-G levels (figure 2C).
Opposing players in regulating HLA-G: miR-16 and miR-744
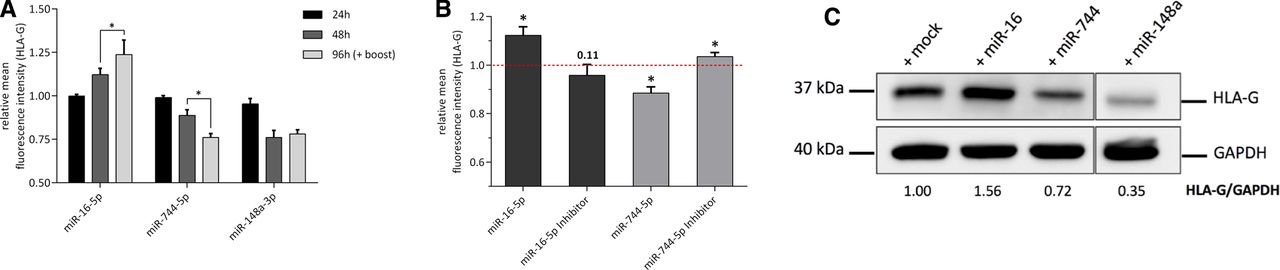
Following the first screening in JEG3 cells, miR-16 and miR-744 were subjected to additional investigations in order to analyze the effects of their overexpression in more detail. Due to the relatively low transfection efficiency of JEG3 cells (online supplementary figure 3) and in order to analyze putative dose dependent effects, transfection efficacy was increased by two subsequent miRNA transfections (0 and 48 hours) followed by flow cytometric analysis after 96 hours. Comparable but enhanced effects for miR-16 and miR-744 in deregulating HLA-G were observed (figure 3A), pointing to a direct connection of miRNA expression and the modulation of HLA-G. For further validation of the observed effects, JEG3 cells were transiently transfected with miRNA inhibitors.39 These molecules suppress the specific miRNA activity and resulted in contrary effects on HLA-G surface expression for miR-744 compared with the miRNA overexpression. In contrast, the miR-16 inhibitor transfection resulted in a non-significant downregulation of HLA-G (figure 3B). Next, to exclude indirect/secondary effects responsible for deregulation of HLA-G on the cell surface, total HLA-G protein was analyzed by western blot (figure 3). Overexpression of miRNA candidates affected total HLA-G protein in a similar way as shown by flow cytometry, confirming our previous assays. In sum, miR-744 targets HLA-G via the CDS resulting in reduced HLA-G protein levels, while miR-16 appears to be a positive regulator of HLA-G expression in JEG3 cells.
Supplemental material

Effects of candidate miR-16 and miR-744 transfection. (A) HLA-G surface expression in the indicated cells after 24, 48 and 96 hours of mimic transfection. A second miRNA mimic transfection after 48 hours (boost) was performed for the samples analyzed 96 hours after the first transfection to increase the number of positive transfected JEG3 cells (n=3, Student t-test, *p<0.05). (B) HLA-G surface expression 48 hours after transfection of the indicated miRNA mimics and inhibitors, respectively (n=3, Student t-test, *p<0.05). (C) Western blot-based detection of total HLA-G protein in the indicated miRNA mimic transfectants. GAPDH was used as loading control. ImageJ was used for densitometric analysis. GAPDH, glyceraldehyde-3-phosphatedehydrogenase; HLA, human leukocyte antigen; miRNA, microRNA.
Cross-regulation of classical MHC class I molecules by miR-16 and miR-744
The miRNA prediction tool RNA2234 allowed localization of the binding site of miR-16 and miR-744 in the CDS of HLA-G. In addition, sequence alignment revealed that miR-16 and miR-744 binding sites are highly conserved in both non-classical (HLA-E and HLA-G) and classical MHC class I antigens (HLA-A, HLA-B, and HLA-C; figure 4A). Therefore, it was investigated whether miR-16 and miR-744 were also capable to regulate related HLA-G genes. HLA-E expressing JEG3 cells were transfected with miR-16 or miR-744 and subsequently analyzed for HLA-E protein levels. However, a deregulated HLA-E expression could not be observed (online supplementary figure 4). To test miR-16 and miR-744-dependent effects on classical MHC class I antigens, HEK293T cells mainly expressing HLA-A40 were employed for transfection. miR-148a, known to affect HLA-C17 has a similar binding site for HLA-A and thus served as a positive control. Indeed, a significant downregulation of HLA-ABC on the surface of HEK293T cells was detected for miR-744 and miR-148a using an anti-HLA-ABC mAb (figure 4B). In contrast, miR-16 upregulated HLA class I surface expression, while transfection of a miR-16 inhibitor resulted in the opposite effect and downregulated HLA-ABC. It is noteworthy that the miR-744 inhibitor showed no deregulation most likely due to very low miR-744 levels in HEK293T cells (figure 4B). To further validate the effects of miR-16 and miR-744 on classical MHC class I genes, in silico analysis from TCGA data sets using the tool CancerMiner was performed,35 which determined the expression relationships between miRNAs and mRNAs in different cancer types. In this context, values<0 point to a negative correlation, while data>0 indicate a positive correlation. The correlation of miR-16 and miR-744 with MHC class I mRNA in a pan-cancer set composed of 11 different cancer types with 3.290 samples supported our findings in JEG3 and HEK293T cells for HLA-G and HLA-ABC, respectively. Moreover, this correlation was particularly significant in breast and colon adenocarcinoma (online supplementary table 3). Based on these data, the effect of miR-16 and miR-744 mimics was determined in two BC (MCF-7, HCC1806) and two CRC cell lines (HCT-116, HT-29; figure 4D). A significant downregulation of HLA-ABC after transfection of miR-744 (except MCF-7) and miR-148a (except HT-29) as a positive control was found in the different cell lines. In contrast, a general upregulation of HLA-ABC was detectable in the BC and CRC cell lines on transfection of miR-16.
Supplemental material
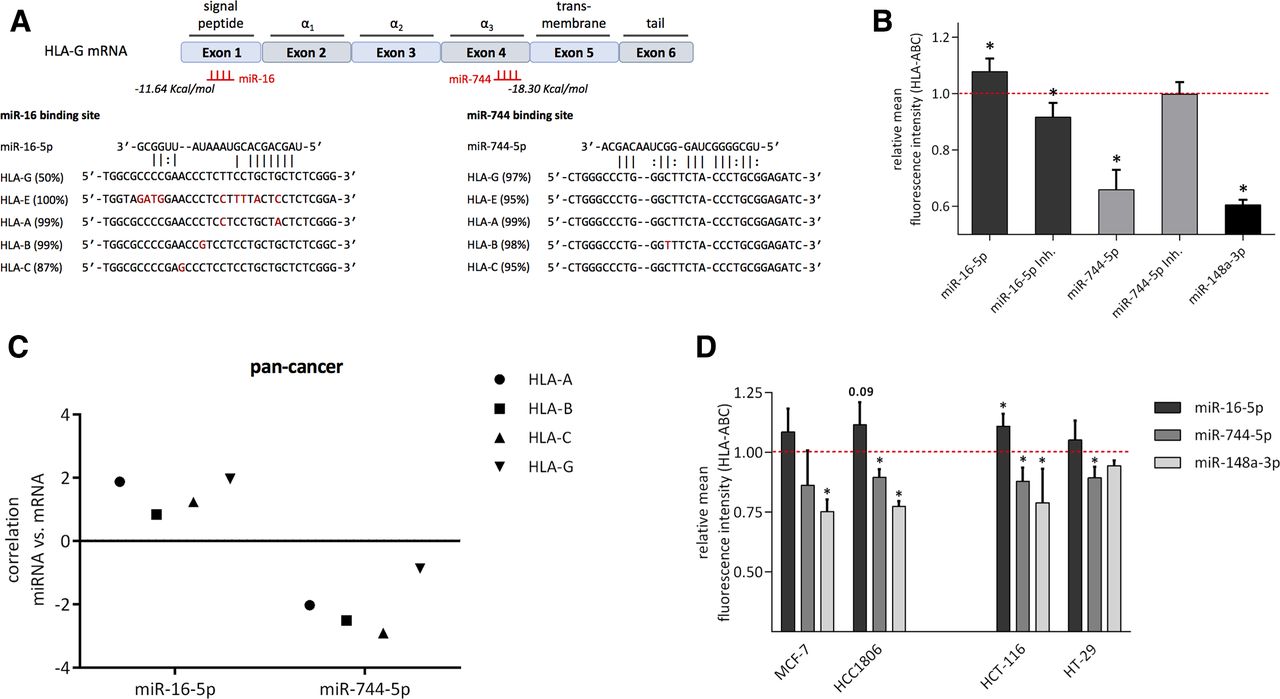
Cross-regulation of miR-16 and miR-744 with classical MHC class I. (A) Location of miR-16 and miR-744 binding site predicted by RNA22 and sequence alignment with MHC class I genes (as described in the Materials and methods section). Number in parentheses indicate frequency of HLA alleles exhibiting the specific binding site. (B) HLA-ABC surface expression after transfection of the indicated miRNA mimic and inhibitor in HEK293T cells (n=3, Student t-test, *p<0.05). (C) In silico analysis of miR-16 and miR-744 correlation with HLA class I mRNA using pan cancer data and the CancerMiner tool.35 (D) HLA-ABC surface expression of MCF-7, HCC1806, HCT-116, and HT-29 cell lines after transfection of the indicated miRNA mimics (n=3, Student t-test, *p<0.05). HLA, human leukocyte antigen; MHC, major histocompatibility complex; miRNA, microRNA; mRNA, messenger RNA.
Mir-16 and miR-744: mode of action
Finally, it was investigated how miR-16 and miR-744 regulate MHC class I genes. The overexpression of miR-744 resulted in a slight non-significant downregulation of HLA-G and HLA-ABC, suggesting mRNA degradation as the mode of action (figure 5A). To investigate whether the silencing of HLA-G occurred through a direct interaction and to determine the exact binding site for miR-744 in the CDS of HLA-G, luc gene reporter assays were performed as shown in figure 5B. The relative luc activity was reduced when compared with the mock control. As expected, mutation of the predicted miR-744 binding site in the CDS of HLA-G abolished this effect. A reduced relative luc activity was also observed for HLA-A and -B, but not for HLA-C.

Candidate miRNA mode of action. (A) Analysis of HLA-G and HLA-ABC transcript levels measured by qRT-PCR after transfection of the indicated miRNA mimics in JEG3 or HEK293T cells. GAPDH was used as housekeeper (n=3, Student t-test relative to mock control, *p<0.05). (B) Luc reporter assay using WT HLA-G CDS or a mutated version (HLA-G CDS mut.) and the classical HLA-A, HLA-B or HLA-C, respectively. Relative luc activity was measured in the absence of miRNA mimics (plasmid only) and after transfection of an miRNA mimic control (mock) or miR-744, respectively (n=4, Student t-test, *p<0.05). (C,D) Effect of miR-16 transfection on recombinant HLA-G expression (under the control of a CMV promoter and lacking its 3’-UTR) measured by flow cytometry and western blotting. transfection of miR-744 was used as control. (E) Detection of miR-16 by PCR after separation of cyto and nuclear fraction (nuc) of JEG3 cells. snoRNA RNU47 was used as nuclear marker while HPRT served as a cyto marker. ImageJ was used for densitometric quantification. (F) Locations of the oligonucleotides P1 (reflecting the proximal HLA-G promoter) and P2 (reflecting the distal HLA-G promoter) used for CHIP analysis are illustrated (top left). PCR analysis after anti-Argonaute 2 (AGO2) CHIP assay in JEG3 cells using the indicated oligonucleotides (bottom left). CHIP assay in JEG3 cells using the indicated oligonucleotides (bottom left). CHIP assay in JEG3 cells using the indicated oligonucleotides (bottom left). CHIP assay in JEG3 cells using the indicated oligonucleotides (bottom left). Quantitative reverse transcription PCR analysis after anti-Argonaute 2 (AGO2) CHIP assay in JEG3 cells using oligonucleotide P1. CDS, coding sequence; CMV, Cytomegalovirus; cyto, cytoplasmic; HLA, human leukocyte antigen; HPRT, Hypoxanthine Phosphoribosyltransferase; luc, luciferase; miRNA, microRNA; mRNA, messenger RNA; nuc, nuclear fraction; UTR, untranslated region.
Concerning miR-16, the transcript levels of HLA-G and HLA-ABC were upregulated after overexpression indicating either a stabilization of the mRNA or an enhanced transcription (figure 5A). To analyze if miR-16 overexpression and thereby enhanced binding to the CDS of HLA-G blocks a potential interaction with a general negative regulator (eg, RNA-binding protein (RBP) with destabilizing function), a recombinant HLA-G expressing cell line was established. In this model system, HLA-G is under the control of a CMV promoter and the transcript lacks the original 3′-UTR. Transient overexpression of miR-16 had no effect on total and cell surface expression of HLA-G, whereas miR-744 serving as a control still affected HLA-G (figure 5C,D). However, it should be noted that the CMV promoter construct resulted in a strong HLA-G expression potentially masking miR-16-based induction of HLA-G. An indirect effect stabilizing the HLA-G transcript by miR-16 was excluded by actinomycin D mRNA stability assay (online supplementary figure 5a). Additionally, a gene reporter assay using miR-16 failed to show an upregulation in luc activity (online supplementary figure 5b). These observations led to the assumption that the genetic context is important for the miR-16-directed upregulation of HLA-G. Recently, Catalanotto and coworkers suggested a mechanism for miRNA-dependent activation of gene expression, which involves a nuclear localized RISC complex and the interaction with the respective promoter as well as additional transcriptional activators to induce target gene expression.41 To prove whether miR-16 is able to localize to the nucleus, cytoplasmic and nuclear cell extracts were prepared from JEG3 cells. Despite miR-16 being found predominantly in the cytoplasm of JEG3 cells, a considerable proportion of miR-16 was also detected in the nucleus (figure 5E), which confirmed results from a previous report in HCT116 colon cancer cells.42 As shown in figure 5, ChIP assays revealed an enriched occurrence of the RISC core component Argonaute 2 at the proximal HLA-G promoter (figure 5F), which could further point to the existence of a miRNA-dependent gene activation mechanism as proposed by Catalanotto et al .41
Supplemental material
Discussion
The deregulation of MHC class I antigens is tightly associated with the development and progression of human diseases, particularly of cancer. Beside some substantial progress in deciphering the transcriptional regulation mechanisms,43 the miRNA-dependent control of these genes is only poorly understood. Therefore, we attempted to identify immune modulatory miRNAs targeting these molecules. Taking advantage of the recently published miTRAP method25 in combination with RNA-seq, the six miRNAs miR-15a/b, miR-16, miR-424 (all belonging to the extended miR-16 family), miR-660, and miR-744 were found to be selectively enriched in the HLA-G eluate.
Subsequently, overexpression of candidate miR-744 was shown to reduce HLA-G protein in a dose-dependent manner. While the miTRAP results pointed to a direct interaction of the HLA-G CDS with miR-744, the reporter assays further confirmed these results. However, the effects of miR-744 on HLA-G expression were less pronounced compared with the 3′-UTR targeting miR-148a. This is in agreement with a number of reports analyzing CDS-located miRNA binding sites7 and may be due to the accessibility of the target site in context of the translation process.44 45 In addition, the miR-744 binding site was found to be conserved in the classical MHC class I genes, suggesting their deregulation. In silico analysis of The Cancer Genome Atlas data resulted in a negative correlation of miR-744 and MHC class I mRNA. Indeed, their miR-744 mimic transfection led to a decreased HLA-ABC surface expression in a number of different tumor cell lines. Since the luc reporter gene assay for HLA-C was negative, a selective downregulation of the HLA class I loci HLA-A and -B by miR-744 was suggested. Next to some intrinsic limitations of this assay,46 the results could be explained by a steric restriction of the miR-744 binding site in the HLA-C mRNA. Alternatively, there might be a competition for the HLA-C miRNA binding site, such as the binding of RBPs or other non-coding RNAs inhibit an effective targeting by miR-744.
Surprisingly, all identified members of the extended miR-16 family showed an upregulation of HLA-G surface expression after transfection into JEG3 cells. Focusing on miR-16, our unexpected results were confirmed, and slightly higher HLA-G mRNA levels were detected pointing either to a more stable transcript or enhanced expression levels. Furthermore, classical MHC class I genes were affected in the same way, which was supported by pan-cancer The Cancer Genome Atlas data demonstrating by a positive correlation score for miR-16 (as well as miR-15 and miR-424, data not shown) and MHC class I expression. Although the miRNA-dependent upregulation of target genes is counterintuitive, a raising number of reports suggest that miRNAs can also promote gene expression.10 47 48 For example, under specific cellular conditions, it was shown that binding of miR-369–3 p to the tumor necrosis factor-α results in an activation signal depending on the recruitment of Argonaute and fragile X mental retardation-related protein 1.9 However, the collected data in this study suggest an miR-16-dependent transcriptional gene activation (TGA) for the investigated MHC class I genes as proposed by Catalanotto et al. 41
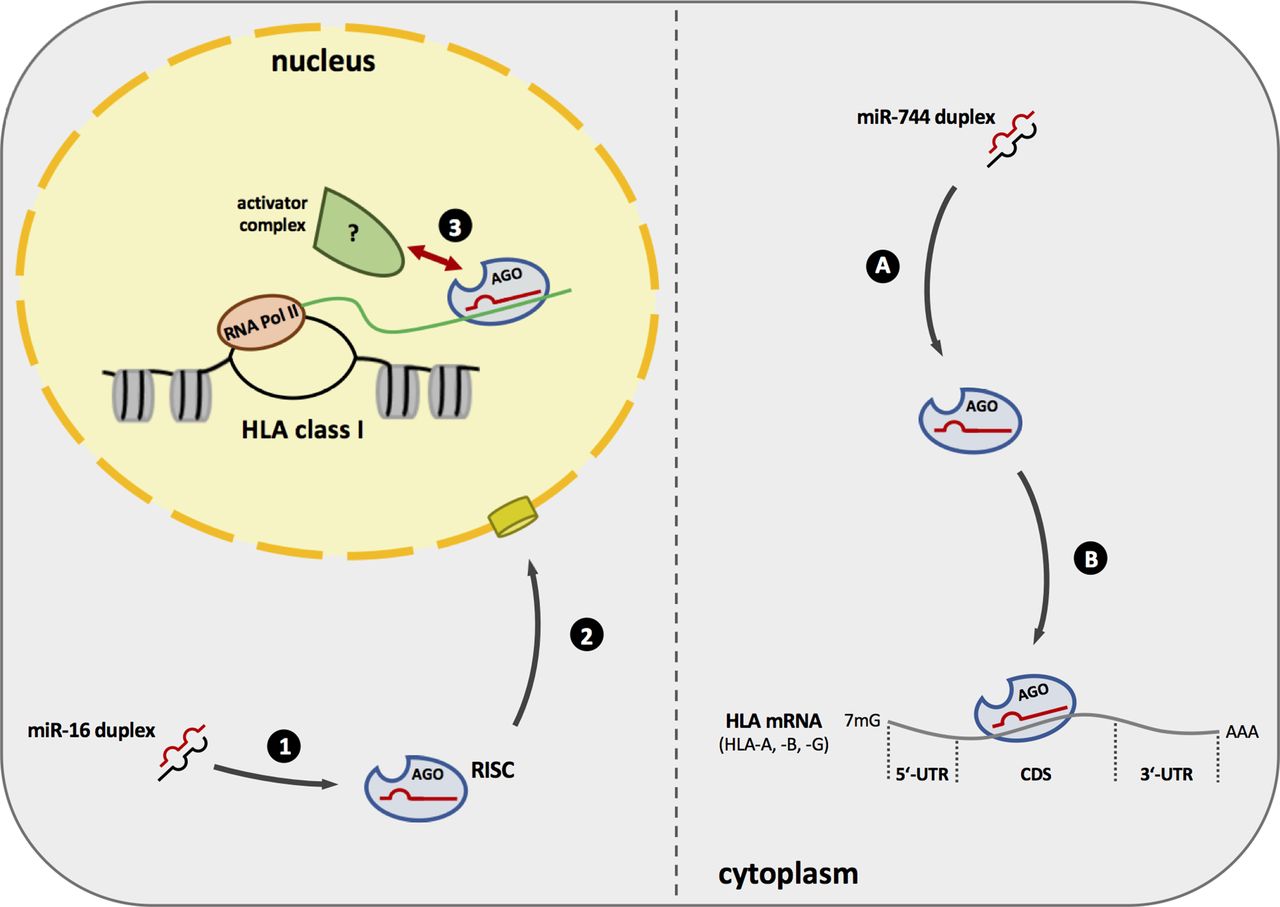
Due to the high complexity of miRNA-dependent regulation mechanisms and the large number of different targets, an indirect (secondary) effect of miR-16 overexpression resulting in the upregulation of MHC class I antigens cannot be completely ruled out. It is noteworthy that none of the best validated miR-16 family targets is known as a suppressor of MHC class I genes. Furthermore, the observed degree of copurification in the miTRAP assay for miR-16 family members was exceptional high and supports the assumption of a direct binding to MHC class I molecules. Interestingly, Hausser et al found miR-16 family members to preferentially bind to CDS-located target sites7 without investigating if this binding occurs in the cytoplasm or the nucleus. Moreover, the data here presented analyses including luc reporter assay (online supplementary figure 5b), the effect of miR-16 on HLA-G driven by a CMV promoter (figure 5C,D) and the mRNA stability assay using actinomycin (online supplementary figure 5a) point to the importance of the genetic context when assessing miR-16-derived effects on HLA class I molecules. Altogether these data support the possibility that miR-16 is involved in the mechanism of gene activation. Unfortunately, the underlying mechanisms, including further interaction partners, are not known. Figure 6 summarizes the data observed in this study and presents a model of miR-16 and miR-744 activity on HLA class I molecules. However, subsequent studies are urgently needed to decipher all players involved in TGA.

Scheme of miR-744 and miR-16 putative mode of action. Left: miR-16 is stably incorporated into the RISC (1) and translocates to the nucleus. (2) Here miR-16 containing RISC can bind to the nascent HLA transcript and potentially recruits an unknown protein complex consisting of transcriptional activators to induce HLA expression. (3) Right: miR-744 and an Argonaute protein build the RISC (A) and targets HLA mRNA, in particular HLA-A, HLA-B, and HLA-G, via its CDS leading to the inhibition of protein synthesis (B). CDS, coding sequence; HLA, human leukocyte antigen; mRNA, messenger RNA; RISC, RNA-induced silencing complex
In the context of miRNA-based therapeutics, identification and use of miRNAs that target the CDS of specific genes could be of crucial importance. Structural variations (SVs), like mutations, single-nucleotide polymorphism or disruption in the 3′-UTR of immune modulatory genes, are causal to elevated expression levels. While these SVs have no impact on the mature protein, the sequence-specific binding of miRNAs could be easily impaired as shown for CEP genes, E2F1, and PD-L1.49–51 Apparently, miRNA target sites in the CDS are at least partially protected since the coding capacity has to be maintained. Therefore, CDS-targeting miRNAs could improve the general use of miRNA-based therapeutic approaches mainly independent of SV in the gene body.
Conclusions
The data presented here expand the knowledge about miRNA-dependent regulation of HLA class I expression. For the first time, a post-transcriptional regulation of HLA class I by miR-744 via the coding sequence could be demonstrated. In general, coding sequence-located miRNA-binding sites could improve the use of miRNA-based therapeutic approaches as these sites are highly independent of SVs (eg, mutations). Unexpectedly, miR-16 overexpression (and most likely other miR-16 family members) was found to enhance HLA class I expression. Despite the fact that details about the miR-16-dependent HLA class I upregulation could not be captured, our data point to a miRNA-specific gene activation mechanism.
Acknowledgments
We thank Maria Heise and Nicole Ott for excellent secretarial help.
References
Footnotes
Contributors MF performed majority of the experiments and data analyses. CKV performed the actinomycin D studies. AM and KB helped with data acquisition and analyses and performed the supplement experiments. BS conceived the concept, directed the study, and constructed the manuscript. All authors read and approved the final manuscript.
Funding This work was funded by the German Research Foundation (DFG; SE 581/22-1).
Competing interests None declared.
Patient consent for publication Not required.
Provenance and peer review Not commissioned; externally peer reviewed.
Data availability statement All data relevant to the study are included in the article or uploaded as supplementary information. Please contact author for data requests.