Article Text

Abstract
Background Recently, antiprogrammed cell death protein 1 (aPD-1) and antiprogrammed death-ligand 1 (aPD-L1) monoclonal antibodies (mAbs) have been approved. Even though aPD-1 and aPD-L1 mAbs target the same PD-1/PD-L1 axis, it is still unclear whether both mAbs exert equivalent pharmacological activity in patients who are sensitive to PD-1/PD-L1 blockade therapy, as there is no direct comparison of their pharmacokinetics (PK) and antitumor effects. Therefore, we evaluated the differences between both mAbs in PK and therapeutic effects in PD-1/PD-L1 blockade-sensitive mouse models.
Methods Herein, murine breast MM48 and colon MC38 xenografts were used to analyze the pharmacological activity of aPD-1 and aPD-L1 mAbs. The PK of the mAbs in the tumor-bearing mice was investigated at low and high doses using two radioisotopes (Indium-111 and Iodine-125) to evaluate the accumulation and degradation of the mAbs.
Results aPD-1 mAb showed antitumor effect in a dose-dependent manner, indicating that the tumor model was sensitive to PD-1/PD-L1 blockade therapy, whereas aPD-L1 mAb failed to suppress tumor growth. The PK study showed that aPD-L1 mAb was accumulated largely in normal organs such as the spleen, liver, and kidney, resulting in low blood concentration and low distributions to tumors at a low dose, even though the tumors expressed PD-L1. Sufficient accumulation of aPD-L1 mAb in tumors was achieved by administration at a high dose owing to the saturation of target-mediated binding in healthy organs. However, degradation of aPD-L1 mAb in tumors was greater than that of aPD-1 mAb, which resulted in poor outcome presumably due to less inhibition of PD-L1 by aPD-L1 mAb than that of PD-1 by aPD-1 mAb.
Conclusion According to the PK studies, aPD-1 mAb showed linear PK, whereas aPD-L1 mAb showed non-linear PK between low and high doses. Collectively, the poor PK characteristics of aPD-L1 mAb caused lower antitumor activity than of aPD-1 mAb. These results clearly indicated that aPD-L1 mAb required higher doses than aPD-1 mAb in clinical setting. Thus, targeting of PD-1 would be more advantageous than PD-L1 in terms of PK.
- pharmacokinetics
- oncology
- pharmacology
- tumors
This is an open access article distributed in accordance with the Creative Commons Attribution Non Commercial (CC BY-NC 4.0) license, which permits others to distribute, remix, adapt, build upon this work non-commercially, and license their derivative works on different terms, provided the original work is properly cited, appropriate credit is given, any changes made indicated, and the use is non-commercial. See http://creativecommons.org/licenses/by-nc/4.0/.
Statistics from Altmetric.com
Introduction
Blockade of the inhibitory programmed cell death protein 1/programmed death-ligand 1 (PD-1/PD-L1) immune checkpoint axis is a promising cancer treatment. Anti-PD-1 (aPD-1) monoclonal antibodies (mAbs) nivolumab and pembrolizumab were approved by the US Food and Drug Administration (FDA), as well as other regulatory authorities, for treatment of metastatic melanoma and non-small-cell lung carcinoma, among others.1 Additionally, anti-PD-L1 (aPD-L1) mAbs such as avelumab, atezolizumab, and durvalumab have also been approved by the FDA.2 However, it has not been verified whether both mAbs exert equivalent pharmacological activity in patients whose tumors are sensitive to PD-1/PD-L1 blockade therapy. Although the pharmacokinetics (PK) analyses in clinical studies indicated that the two mAbs are noticeably different in PK (online supplementary table S1),3–6 little information exists on the quantitative difference in PKs in non-clinical models.7 Furthermore, the relationship between PK and antitumor activity has not been directly compared between aPD-1 and aPD-L1 mAbs in either non-clinical or clinical studies. Therapeutic antibodies are primarily eliminated by protein catabolism in various organs via target-mediated drug disposition (TMDD) and non-specific pinocytosis. Therefore, evaluation of the mAb distribution and degradation processes would provide useful information on how long they remain intact and have the potential to exert their therapeutic effect in tissues.
Supplemental material
Indium-111 (In-111) labeling via chelating agents has been widely used in tissue distribution analyses of mAbs and the technique was applied here to aPD-1 and aPD-L1 mAbs.8 9 However, In-111 radioactivity does not distinguish intact antibodies, which exert a therapeutic effect, from degraded antibodies, which do not. When mAbs are internalized into cells through antigen-specific or non-specific processes, they are catabolized in endosome/lysosome compartments. In-111 resides in the cell even after the pharmacological potential has disappeared, since radioactive metabolites, such as metal-chelate-amino acid adducts, are unable to pass through biological barriers such as the plasma and lysosomal membranes due to their charge and hydrophilic nature (figure 1).10
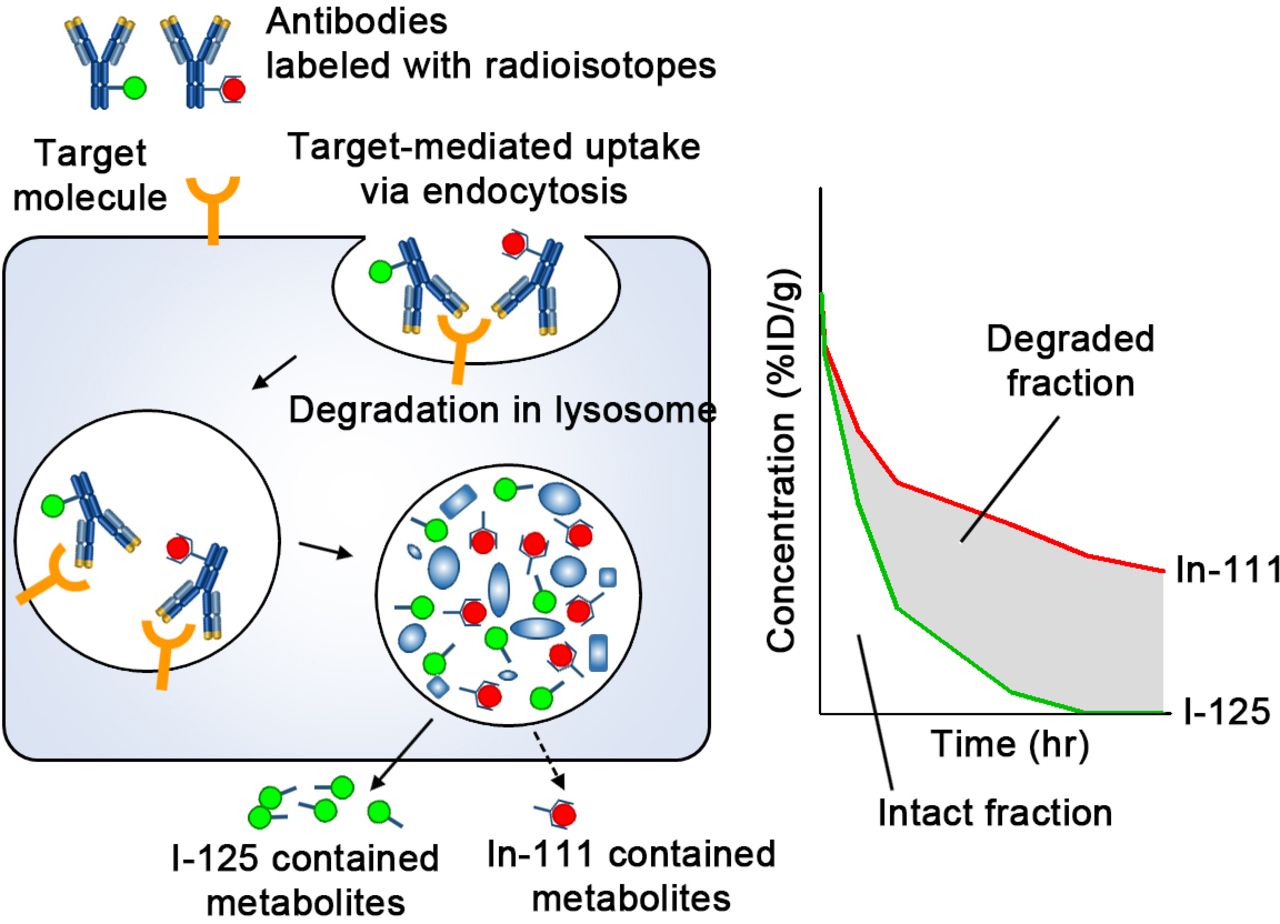
Schematic diagram of the processing of radiolabeled IgG following cellular uptake. Abs are taken up by cells via either specific binding to target molecules and subsequent endocytosis or non-specific pinocytosis. Abs undergo degradation in the lysosome. In-111-chelate-amino acid catabolite is trapped in the cell for a certain time; conversely, I-125 catabolite leaves the cell quickly. In organs where Abs are degraded actively, radioactivity of mAbs labeled with I-125 is decreased faster than that labeled with In-111. Therefore, the difference (shaded area) is an indicator of the extent of degradation, and the remaining represents intact Abs which could reflect therapeutic efficacy. %ID/g, percentage of injected dose per gram; Abs, antibodies; I-125, Iodine-125; In-111, Indium-111; mAbs, monoclonal antibodies.
In contrast, Iodine-125 (I-125) containing metabolites, such as the lysine adduct of I-125-iodobenzoate, are rapidly released from cells and eliminated from circulation such that the two radiolabels (In-111 and I-125) differ in their intracellular residence time (figure 1).11–14 Therefore, once a labeled antibody is degraded in the endosome/lysosome space following uptake, the I-125 metabolite is quickly released while the In-111 metabolite remains trapped within the cells. Hence, mAbs labeled with In-111 and I-125 have been used to distinguish between intact and degraded fractions of mAbs in tissues.15 16
In this study, we evaluated the antitumor activity and PK of aPD-1 and aPD-L1 mAbs by labeling them with In-111 and I-125 and investigating the relationship between PK and effect in tumor-bearing mouse models.
Materials and methods
Materials
Murine mammary carcinoma MM48 was obtained from the Cell Resource Center for Biomedical Research, Institute of Development, Aging and Cancer, Tohoku University. The antibodies used in this study are listed in online supplementary table S2. Recombinant murine interferon-gamma (IFNγ) (#315–05) was obtained from PeproTech. Recombinant murine PD-L1 (#cj89) was obtained from NovoProtein. N-[(R)-2-Amino-3-(p-isothiocyanatophenyl)propyl]-trans-(S,S)-cyclohexane-1,2-diamine-N,N,N’,N’’,N’’-pentaacetic acid (p-SCN-CHX-A’’-DTPA, B-355) was purchased from Macrocyclics. N-succinimidyl 3-(tri-n-butylstannyl)benzoate (ATE) was synthesized according to the procedure described previously.12 [In-111]InCl3 (74 MBq/mL, 874300) was purchased from Nihon Medi-Physics. [I-125]NaI (74 MBq, #NEZ033A002MC) was purchased from Perkin Elmer.
Cell culture
MM48 was cultured in RPMI 1640 (Sigma, #R8758) supplemented with 10% fetal bovine serum (Biowest, #S1820) and 1% penicillin and streptomycin (Nacalai Tesque, #26253-84). Cells were not detected for Mycoplasma and used for experiments within 20 passages after obtaining.
Evaluation of PD-L1 expression
Following treatment with 50 ng/mL IFNγ for 24 hours in culture media to induce the maximum expression of PD-L1, cells were washed with phosphate-buffered saline (PBS). Collected cells were incubated with aPD-L1 mAb in Krebs-Henseleit buffer (118 mM NaCl, 23.8 mM NaHCO3, 4.83 mM KCl, 0.96 mM KH2PO4, 1.20 mM MgSO4, 12.5 mM Hepes, 5 mM glucose, and 1.53 mM CaCl2 adjusted to pH 7.4) at indicated concentrations at 4°C for 2 hours. Cells were washed with fluorescence-activated cell sorting (FACS) buffer followed by incubation with Alexa 488-labeled anti-rat IgG secondary antibody at 4°C for 30 min. Ten thousand cells were analyzed using BD FACSCanto II (BD Biosciences).
Tumor inoculation
C3H/He mice (6 weeks old, female) were purchased from Japan SLC (Shizuoka, Japan). Cancer cells were subcutaneously transplanted into syngeneic mice using at 1×10⁶ cells in 100 µL Hanks’ balanced salt solution (Gibco, #14025-092).
Western blotting
Protein lysates were prepared from tumors and normal tissues collected from tumor-bearing mice when tumor volumes reached around 200–500 mm3. Frozen tissues were homogenized in lysis buffer on ice at 1500 rotations per minute (rpm) for 90 s using a Shake Master Neo (BMS), and the cellular debris was pelleted by centrifugation at 20,000 g for 10 min at 4°C. The protein concentration in the lysates was determined using BCA Protein Assay Reagent Kit (Thermo Scientific, #23225). Protein lysates (10 µg protein) were subjected to 10% sodium dodecyl sulfate-polyacrylamide gel electrophoresis separation, transferred onto a nitrocellulose membrane, and blocked with 5% bovine serum albumin (BSA; Nacalai Tesque, #0186-07) in Tris-buffered saline with Tween 20 (TBST) for 1 hour at 25°C. Membranes were probed with primary antibodies in Can Get Signal Immunoreaction Enhancer Solution (Toyobo, #NKB-101) overnight at 4°C. The bands were then incubated with HRP-conjugated secondary antibodies in 5% BSA in TBST for 1 hour at 25°C. Blots were developed using an Immobilon Western (Millipore, #WBKLS0500) and captured using a LAS4000 (GE Healthcare).
Immunohistochemistry
Tissues were harvested from tumor-bearing mice when tumor volumes reached 200–500 mm3, then fixation with 4% paraformaldehyde (PFA) in PBS for 24 hours at 4°C. The tissues were transferred to 30% sucrose in PBS overnight at 4°C, then frozen in optimal cutting temperature (OCT) compound (Sakura Finetek, #4583). Fixed tissues were sectioned (10 µm) on glass slides (Matsunami, #FCR-01). Endogenous peroxide was blocked by incubating the slides with 3% hydrogen peroxide in PBS. Slides were incubated in 3% BSA in TBST, followed by an overnight incubation with either aPD-1 or aPD-L1 antibody. The slides were incubated with HRP-conjugated secondary antibodies. After 3,3’-diaminobenzidine staining, the nuclei were stained using hematoxylin solution.
Treatment of tumor-bearing mice with mAbs
Tumor-bearing mice were randomized and treated intraperitoneally with either aPD-1, aPD-L1, or IgG2a mAb at the indicated doses in 100 µL PBS on days 5, 8, and 12 (post-tumor inoculation) according to previous reports.17 Tumor volume was calculated using the following formula: 1/2×a×b2, where a and b represent the largest and smallest tumor diameters, respectively.
Radiolabeling of antibodies with In-111
The mAbs were conjugated with p-SCN-CHX-A’’-DTPA according to previous reports.18 Briefly, mAbs (5 mg/mL) in 0.1 M borate buffer (pH 8.5) were incubated with a solution of p-SCN-CHX-A’’-DTPA (5 mg/mL) in 0.1 M borate buffer (pH 8.5) at 37°C for 16 hours. The number of p-SCN-CHX-A’’-DTPA introduced per molecule of IgG was 1.5–1.8, as determined by thin-layer chromatography (TLC). The conjugate was purified via the centrifuged column procedure using Sephadex G-50 Fine (GE Healthcare, 17-0042-01), equilibrated and eluted with 0.25 M acetate buffer (pH 5.5). [In-111]InCl3 was added to 1 M acetate buffer (pH 5.5) and incubated for 5 min at 25°C. Each conjugate was added to the solution and the mixture was incubated at 37°C for 1 hour, followed by addition of 2 mM DTPA solution to a final concentration of 500 µM. Each mixture was incubated for 5 min and purified by a centrifuged column procedure using Sephadex G-50 Fine, equilibrated and eluted with PBS to provide a solution of In-111-labeled mAbs. The radiochemical purity was >95% determined by size-exclusion high performance liquid chromatography (HPLC) (SE-HPLC) and TLC (online supplementary figure S1).
Radiolabeling of antibodies with I-125
The mAbs were radiolabeled with I-125 by the succinimidyl iodobenzoate (SIB) method according to the previous report.12 Briefly, ATE was dissolved in 1% acetic acid/methanol (0.45 mg/mL), and this solution was mixed with N-chlorosuccinimide (NCS) in methanol (0.5 mg/mL), followed by addition of [I-125]NaI. After the mixture was incubated at 25°C for 45 min, the reaction was quenched with aqueous sodium bisulfite (0.72 mg/mL). The solvent was removed under a stream of nitrogen before conjugation with the mAbs. Each solution of mAbs (5 mg/mL) in 0.2 M borate buffer (pH 8.5) was added to the dried residue of crude [I-125]SIB. After incubation at 25°C for 1 hour, [I-125]SIB-labeled mAbs were purified by a centrifuged column procedure using Sephadex G-50 Fine, equilibrated and eluted with D-PBS(−). The radiochemical purity was >95% determined by SE-HPLC and TLC (online supplementary figure S1).
Biodistribution of radiolabeled mAbs in tumor-bearing mice
Tumor-bearing mice were intraperitoneally coinjected with In-111-labeled and I-125-labeled mAbs at a dose of 2 µg (In-111:I-125, 1:1, 0.05–0.5 µCi) in 100 µL of PBS. For competitive studies, tumor-bearing mice were coinjected with In-111 and I-125 labeled mAbs at a dose of 2 µg and unlabeled mAb at a dose of 198 µg in 100 µL of PBS. At 3, 48, 120, and 216 hours postinjection, the blood, heart, lung, liver, spleen, kidney, muscle, skin, and tumor were collected and weighed, and the radioactive counts in each tissue were determined with a Wizard 3 using 171 and 245 keV photons for In-111 and 35 keV photons for I-125. The percentage of injected dose per gram was calculated.
PK analysis
The area under the concentration-time curve (AUC) was calculated by the moment analysis with a log-linear trapezoidal rule. The elimination half-life time (t1/2) was calculated by a linear regression of the log-linear elimination phase of the concentration-time curve. Since all animals were sacrificed for collection of the biological specimens at each time point in this study, the concentration data were averaged at each time point, then used for PK analysis. The analyses were performed using Napp (Numeric Analysis Program for Pharmacokinetics) V.2.31.19
Statistical analysis
All data are presented as mean±SE. Pairwise comparisons of subgroups were done using Student’s t-test with Welch’s correction, and p values (both sides) were considered significant if <0.05. Statistical analyses were performed with GraphPad Prism V.5.0.
Results
The in vitro and in vivo expression of PD-L1 and PD-1
We evaluated the expression of PD-L1 on MM48 cells by flow cytometry. As shown in figure 2A, PD-L1 was expressed on the cell surface. The expression of PD-L1 in tissues from tumor-bearing mice was evaluated by western blotting and immunohistochemistry. Among the healthy organs, the spleen showed the highest expression of PD-L1 (figure 2B). The protein expression levels of PD-L1 in both tumors were as abundant as that of the spleen. The RNA expression pattern of PD-L1 was similar to that of PD-L1 protein (online supplementary figure S2). Because the RNA expression of PD-1 in MM48 tumor was the highest, MM48 tumor seemed to be a PD-1-positive model. Immunohistochemistry was performed on the tumor, liver, spleen, and kidney (figure 2C). PD-L1 was highly expressed in the spleen, and the expression of PD-L1 in both tumors was equal to or higher than that of the spleen. PD-1 was also detected in the tumors, spleen, and kidney.
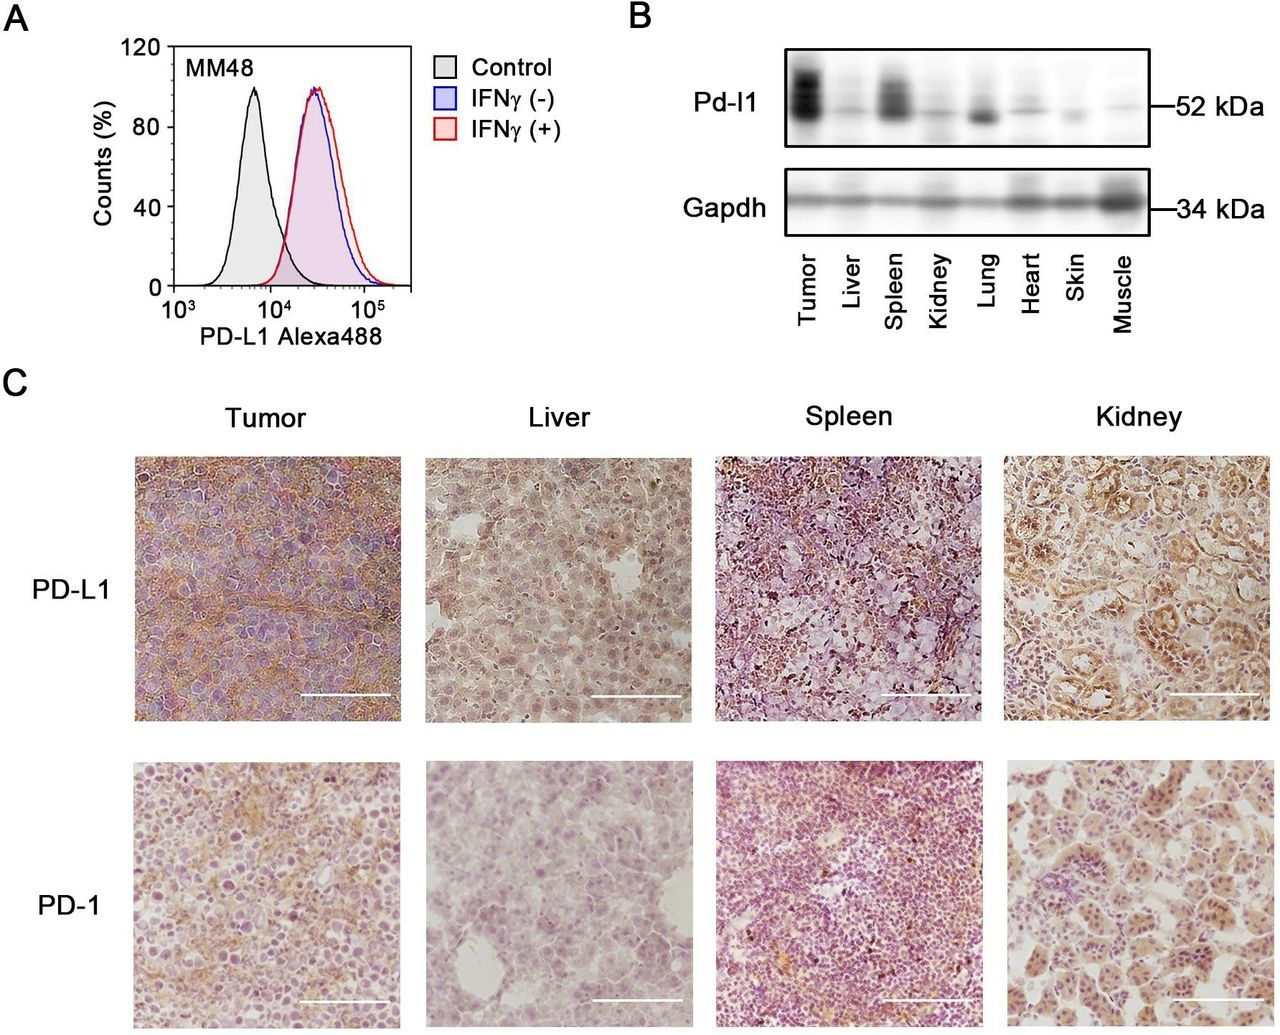
PD-L1 and PD-1 expression in cancer cells and tissues. (A) Flow cytometry analyses for MM48 (murine breast cancer) stained with aPD-L1 with (+) or without (−) IFNγ treatment (50 ng/mL) for 24 hours. (B) The protein expression level of PD-L1 in tissues of MM48-bearing mice detected by western blotting. (C) The expression of PD-L1 and PD-1 in tissue sections of tumor, liver, spleen, and kidney detected by immunohistochemistry. Bars represent 100 µm. aPD-L1, anti-PD-L1; IFNγ, interferon gamma; PD-1, programmed cell death protein 1; PD-L1, programmed death-ligand 1.
Antitumor activity of mAbs aPD-1 (IgG2a, RMP1-14) and aPD-L1 (IgG2b, 10F.9G2) mAbs were employed in this study to evaluate antitumor activity. Treatment with aPD-1 mAb showed antitumor activity (figure 3). However, MM48 tumors did not respond to aPD-L1 mAb treatment. As it was reported that murine colon adenocarcinoma MC38 tumors provide a model sensitive to aPD-1 mAb,20 we treated MC38 tumor-bearing mice with aPD-1 mAb, and the results showed that this treatment suppressed tumor growth (online supplementary figure S3). However, aPD-L1 mAb exhibited lower efficacy on tumor growth in MC38 tumor-bearing mice than did aPD-1 mAb (online supplementary figure S3). The antitumor effect of MIH6, another clone of aPD-L1 mAb, was also inferior to that of aPD-1 mAb in MM48 tumor-bearing mice (online supplementary figure S5A). We hypothesized that the lower antitumor activity observed for aPD-L1 mAb resulted from its poor PK properties, such as insufficient distribution and/or rapid degradation in tumors, compared with those of aPD-1 mAb.

In vivo antitumor activities of aPD-1/aPD-L1 mAb. C3H mice were injected subcutaneously with MM48 cells on day 0. Tumor-bearing mice were intraperitoneally treated with Abs at the indicated doses at days 5, 8, and 12 (post-tumor inoculation). (A) The average tumor volumes of MM48 tumor-bearing mice treated with the mAbs at a dose of 200 µg/mouse. Data are presented as mean±SE (n=8–10). *P< 0.05 (one-way analysis of variance followed by Kruskal-Wallis test). (B) The changes in each tumor volume for MM48 are presented treated with mAbs at indicated doses. Tumor volumes were measured two to three times weekly. Numbers each graph shows tumors with <10% of the average volume of tumors treated with control IgG on the last day. Abs, antibodies; aPD-1, anti-PD-1; aPD-L1, anti-PD-L1; mAbs, monoclonal antibodies; PD-1, programmed cell death protein 1; PD-L1, programmed death-ligand 1.
Blood concentration of mAbs at low dose
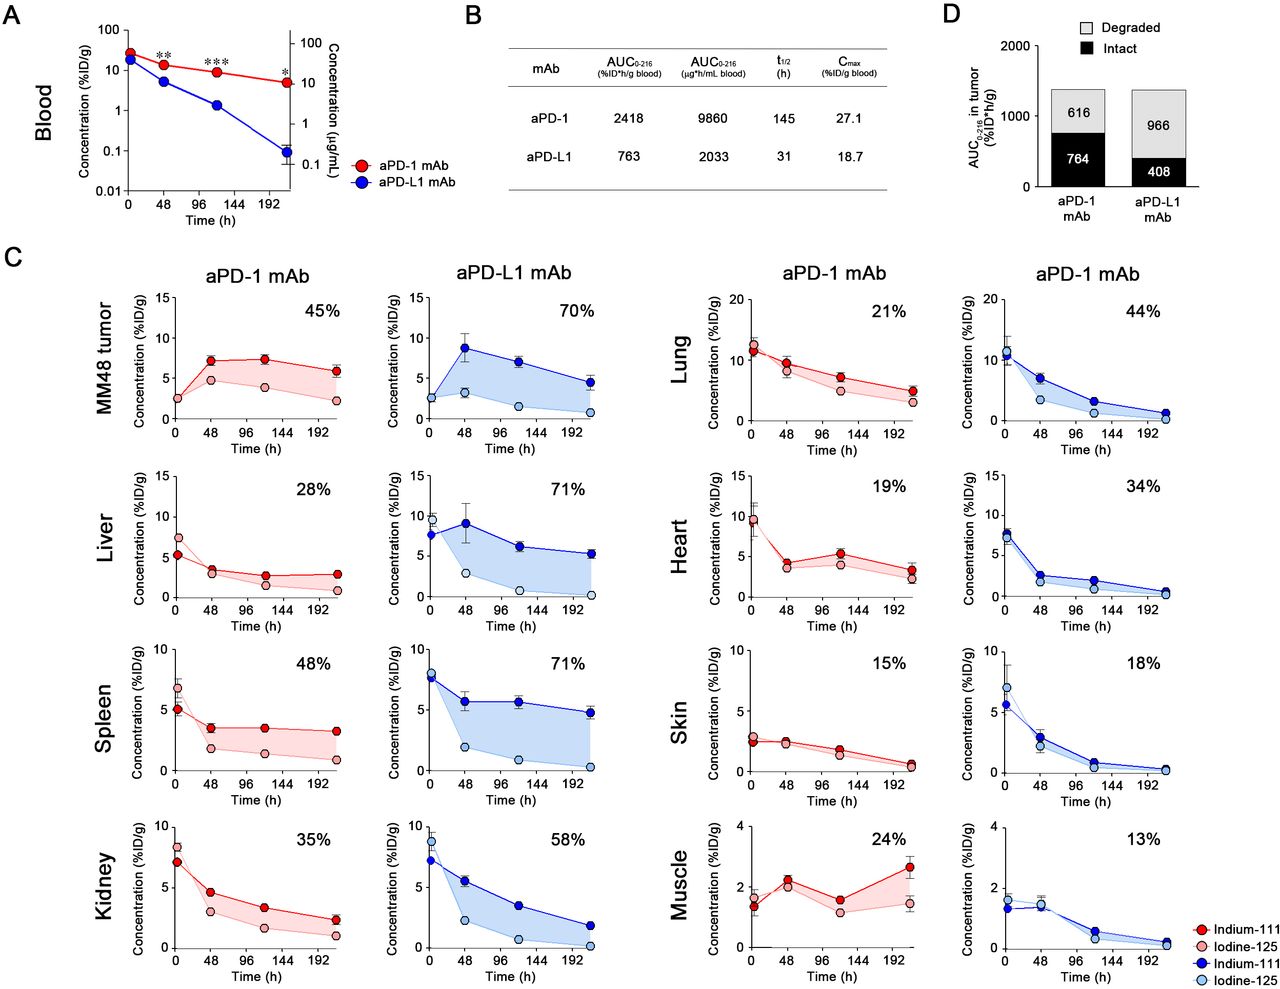
Radiolabeled aPD-1 and aPD-L1 (10F.9G2) mAbs were injected into tumor-bearing mice at 2 µg to avoid saturation of the antigen-antibody reaction. The PK parameters were calculated using I-125 radioactivity as no significant differences were observed in their radioactivity in the blood between In-111 and I-125 (online supplementary figure S4). The early (3-hour) blood concentration of 10F.9G2 mAb was approximately 20-fold lower than that of aPD-1 mAb (figure 4A), which indicated that 10F.9G2 mAb was distributed extensively in PD-L1-expressing tissues. As a result, the AUC of 10F.9G2 mAb was approximately 40–50 times smaller than that of aPD-1 mAb (figure 4B). The PK of MIH6, the other clone of aPD-L1 mAb, was similar to that of 10F.9G2 mAb rather than that of aPD-1 mAb (online supplementary figure S5B,C), whereas the isotype control IgG2a (2A3) and IgG2b (LTF-2) presented comparable PK profiles (online supplementary figure S6). These results suggested that the difference in PK between aPD-1 (RMP1-14) and aPD-L1 (10F.9G2 and MIH6) mAbs was independent on the difference in isotypes.

Biodistribution of aPD-1 and aPD-L1 mAbs at low dose. (A) The radioactive blood concentrations associated with I-125 were measured at 3, 48, 120, and 216 hours following intraperitoneal injection of aPD-1 or aPD-L1 mAb (2 µg/mouse) into MM48 tumor-bearing mice. Blood concentrations are presented as %ID/g blood (left axis) and μg/mL blood (right axis). Data are presented as mean±SE (n=3–4). *P< 0.05, **P<0.01 (Student’s t-test with Welch’s correction). (B) The pharmacokinetic parameters of mAbs blood concentration associated with I-125 at a low dose. AUC0 – 216, area under the concentration-time curve from 0 to 216 hours; t1/2, elimination half-life time; Cmax, maximum observed blood concentration. (C) The radioactivities for In-111 and I-125 were determined at 3, 48, 120, and 216 hours following intraperitoneal injection of the labeled mAbs (2 µg/mouse) into MM48 tumor-bearing mice. The shaded area indicates the difference between the measured pharmacokinetics of the In-111 and I-125 as an indication of degradation. The percentage on each graph represents the degradation ratio of the mAb in each organ. Data are presented as mean±SE (n=3–4). %ID/g, percentage of injected dose per gram; aPD-1, anti-PD-1; aPD-L1, anti-PD-L1; I-125, Iodine-125; In-111, Indium-111; mAbs, monoclonal antibodies; PD-1, programmed cell death protein 1; PD-L1, programmed death-ligand 1.
Tissue distribution and degradation of mAbs at low dose
As the blood concentration of the 10F.9G2 mAb approached zero, it was suggested that this aPD-L1 mAb was highly distributed throughout various organs at early time points, especially in the spleen, liver, and kidney (figure 4C). Conversely, the concentration of aPD-1 mAb was higher in blood than tissues. Accumulation of 10F.9G2 mAb in tumors was significantly lower than that of aPD-1 mAb, despite the abundant expression of PD-L1 in tumors (figure 2). At 3 hours postinjection, the radioactivities of I-125 and In-111 were similar in various organs, suggesting that the mAbs were initially intact, but then they became subsequently degraded in a time-dependent manner. The degradation ratio of 10F.9G2 mAb reached 40%–60% in tumors at 216 hours postinjection in tumors. A noticeable portion (20%–40%) of the accumulated aPD-1 mAb was degraded in the liver, spleen, kidney, and tumors, and degradation was lower in other organs. MIH6, another aPD-L1 mAb, showed similar tissue distribution to that of 10F.9G2 mAb (online supplementary figure S5D). These results demonstrated that PK and distribution of these mAbs were significantly influenced by the difference in antigen expression.
Differences in mAb PK between low and high doses
The biodistribution of labeled mAbs was evaluated at 200 µg/mouse by coinjecting excess unlabeled mAbs to achieve the dose used in anticancer treatments. The blood concentrations and tissue distribution of aPD-1 mAb were similar for the high and low doses, which suggested that target-mediated binding was saturated even at the 2 µg dosage (figure 5A,B). In contrast, the PK of 10F.9G2 mAb was strongly affected by the presence of excessive unlabeled mAbs. The tissue distribution at 3 hours of 10F.9G2 mAb was significantly lower at a high dose in the liver, spleen, and lung (figure 5B). As blood AUC0–216 of 10F.9G2 mAb increased by 9.3-fold at 200 µg compared with that at 2 µg, the dose-normalized accumulation of In-111 radioactivity in MM48 tumors was increased by 6.8-fold (figure 5C).

The effect of excess unlabeled mAbs on biodistribution in tumor-bearing mice. (A) The kinetic profiles of mAb concentrations in the blood associated with I-125 radioactivity following injection at low and high doses. The radioactivity associated with I-125 was measured at 3, 48, 120, and 216 hours following intraperitoneal injection into MM48 tumor-bearing mice. (B) The radioactivities associated with I-125 at 3 hours in MM48 tumor-bearing mice administered labeled mAbs at tracer or high doses. (C) The kinetic profiles of aPD-1 or aPD-L1 mAb (labeled with In-111) in tumors. Gray and black represent the doses at 2 µg/mouse (low dose) or 2 µg/mouse with excess cold mAbs (198 µg/mouse, total 200 µg/mouse, high dose) per mouse, respectively. The concentration in the blood and the tumor uptake are expressed as %ID/g. Data are presented as mean±SE (n=3–4). *P<0.05, **P<0.01, ***P<0.001 (Student’s t-test with Welch’s correction). %ID/g, percentage of injected dose per gram; aPD-1, anti-PD-1; aPD-L1, anti-PD-L1; I-125, Iodine-125; In-111, Indium-111; mAbs, monoclonal antibodies; PD-1, programmed cell death protein 1; PD-L1, programmed death-ligand 1.
Tissue distribution and degradation of mAbs at high dose
The blood concentration of 10F.9G2 mAb at 3 hours was comparable with that of aPD-1 mAb (figure 6A). The degradation of mAbs at high dose was minimal up to 3 hours following administration, and was observed to occur for over 216 hours. The t1/2 of 10F.9G2 mAb was approximately fivefold shorter than that of aPD-1 mAb (figure 6B). The degradation ratio of aPD-1 mAb at high dose (figure 6C) was found to be similar to that at the tracer dose (figure 4C). As the PK and degradation of aPD-1 mAb were found to be linear between low and high doses, it is likely that degradation of aPD-1 mAb via TMDD hardly occurred even at the low dose. In the tumors, liver, spleen, and kidney, degradation of 10F.9G2 mAb at the high dose (figure 6C) was equivalent to that at the low dose (figure 4). These observations indicate that the degradation process of 10F.9G2 mAb was not likely saturated even at the high dose, presumably because new antigens would be synthesized by PD-L1 expressing cells. Although comparable accumulation of 10F.9G2 mAb and aPD-1 mAbs in tumors was achieved, the intact fraction of 10F.9G2 mAb was smaller than that of aPD-1 mAb (figure 6D). These differences in PK between the two mAbs were also observed in MC38 tumor-bearing mice (online supplementary figure S7).

Biodistribution of aPD-1 and aPD-L1 mAbs at high dose. (A) aPD-1 and aPD-L1 mAb concentrations in the blood associated with I-125 radioactivity were measured at 3, 48, 120, and 216 hours following intraperitoneal injection of labeled mAbs (2 µg/mouse) with excess cold mAbs (198 µg/mouse) into MM48 tumor-bearing mice. Blood concentrations are presented as %ID/g blood (left axis) and μg/mL blood (right axis). Data are presented as mean±SE (n=3–4). *P<0.05, **P<0.01, ***P < 0.001 (Student’s t-test with Welch’s correction). (B) The pharmacokinetic parameters of mAbs blood concentration associated with I-125 at a high dose. AUC0–216, area under the concentration-time curve from 0 to 216 hours; t1/2, elimination half-life time; Cmax, maximum observed blood concentration. (C) The radioactivities for In-111 and I-125 were determined at 3, 48, 120, and 216 hours following intraperitoneal injection of the labeled mAbs (2 µg/mouse) with excess cold mAbs (198 µg/mouse) into MM48 tumor-bearing mice. The shaded area indicates the difference between the measured pharmacokinetics of the In-111 and I-125 as an indication of antibody degradation. The percentage on each graph represents the degradation ratio of the mAb in each organ. Data are presented as mean±SE (n=3–4). (D) The AUC0–216 of the degraded and intact fractions of mAbs in MM48 tumors. %ID/g, percentage of injected dose per gram; aPD-1, anti-PD-1; aPD-L1, anti-PD-L1; I-125, Iodine-125; In-111, Indium-111; mAbs, monoclonal antibodies.
Discussion
This study investigated the antitumor activity and PK of aPD-1 and aPD-L1 mAbs and determined the relationship between their PK and efficacy in MM48 and MC38 tumor-bearing mouse models. Based on the antitumor activity observed for aPD-1 mAb, MM48 and MC38 tumors were sensitive to blockade of the PD-1/PD-L1 axis. The subclass of IgG determines the pharmacological efficacy of antibodies. Dahan et al 21 have shown the contributions of the Fc region of aPD-1 (RMP1-14, rat IgG2a) and aPD-L1 (10F.9G2, rat IgG2b) mAbs to the antitumor effect through antibody-dependent cellular cytotoxicity (ADCC), which is induced by IgG2b binding to mouse FcγRs. As the mAbs used in this study are the same clones as those used by Dahan et al,21 we concluded that 10F.9G2 mAb exerted antitumor activities through both inhibition of the PD-1/PD-L1 axis and ADCC. However, treatment with 10F.9G2 mAb showed a negligible response in PD-1/PD-L1 blockade-sensitive MM48 and MC38 tumor-bearing models. The other clone of aPD-L1 mAb, MIH6 (rat IgG2a), also showed lower antitumor efficacy on tumor growth of MM48 than aPD-1 mAb did.
We hypothesized that the lower antitumor activity of both 10F.9G2 and MIH6 mAbs resulted from their poor PK, compared with aPD-1 mAb. Although clinical studies have indicated differences in PK profiles between aPD-1 and aPD-L1 mAbs, direct comparison between both mAbs has not been performed in either clinical studies or non-clinical animal models. Therapeutic antibodies are primarily eliminated by protein catabolism in a multitude of tissues following target-mediated endocytosis and non-specific pinocytosis; thus, clearance is not dependent on a single organ. Therefore, characterization of the tissue PK and metabolism of mAbs is essential for understanding their mechanism of action and efficacy.22 We evaluated the distribution and degradation of aPD-1 (RMP1-14) and aPD-L1 (10F.9G2 and MIH6) mAbs by using In-111 and I-125 radiolabels to determine the relationship between therapeutic efficacy and PK.
aPD-1 mAb showed a linear PK in MM48 and MC38 models within the dosage range investigated. In a phase I study of nivolumab, a dose proportional increase in AUC was shown from 1 mg/kg to 20 mg/kg.23 Population PK analysis in patients also showed that the PK of nivolumab was linear within the dose range of 0.1–20.0 mg/kg.24 Taken together, aPD-1 mAb could present a similar PK behavior in mouse tumor models to nivolumab in human patients. In contrast, a non-linear blood PK was observed for 10F.9G2 mAb at the tested doses in the mouse models. As PD-L1 is ubiquitously expressed on lymphocytes and other cells,25 10F.9G2 mAb was distributed to the spleen, liver, and kidney, as indicated by the dose-dependent decrease in radioactivity. Similar results were found in mouse models.9 26 In addition, an avelumab phase I study showed that target-mediated clearance was saturated at 10 and 20 mg/kg in humans.5 These results suggested that targeted-mediated binding of 10F.9G2 mAb was saturated in various tissues at the high dose in the mouse models.
The mAb distribution in tumors depends on the rates of extravasation from capillary to tissue, distribution in the interstitial space, antibody binding to the target molecule, and clearance from the tissue, including intracellular uptake and degradation. The results indicate that the saturation of targets in non-tumor tissue can lead to desirable tumor uptake and acceptable exposure to the antibody.27 As expected, a high dose of 10F.9G2 mAb accumulated in tumors as much as aPD-1 mAb. This supports the mechanism whereby the accumulation of mAbs in tumor tissues depends primarily on the blood concentration through convective transport.28
PD-L1 appeared to be abundant in MM48 tumor. In the tumor microenvironment, PD-L1 was expressed on not only cancer cells but also other types of cells, such as tumor-associated macrophages (TAMs), which are phagocytic cells.21 It was hypothesized that 10F.9G2 and MIH6 mAbs are recognized by TAMs in tumors, thereby acting as a binding-site barrier29 and resulted in shorter inhibition of PD-L1 by 10F.9G2 and MIH6 mAbs due to degradation. The degree of antibody degradation in tumors may predict the efficacy of antibodies. Therefore, the identification of markers that could assess the degradation of antibodies would be useful in predicting the therapeutic outcome or response of aPD-1 and aPD-L1 mAbs against PD-L1 positive tumors.
Preclinical tumor uptake and penetration data from these studies could be used to characterize the relationship between tumor uptake and dose of 10F.9G2 and MIH6 mAbs to provide additional information for clinical dose selection. It has been reported that preclinical pharmacological efficacy in xenograft models may predict the clinical therapeutic efficacy.30 31 Therefore, understanding the relationship between therapeutic efficacy and PK characteristics of aPD-1 (RMP1-14) and aPD-L1 (10F.9G2 and MIH6) mAbs in preclinical models could aid in predicting the optimal dose and regimen in patients.
Collectively, we concluded that the PK features of aPD-1 (RMP1-14) and aPD-L1 (10F.9G2 and MIH6), which target the same axis, were not equivalent, and that targeting of PD-1 would be more advantageous than PD-L1 in terms of PK and therapeutic efficacy.
References
Footnotes
Contributors Conception and design: TK, YA, AH, HH. Acquisition of data: TK, RM, AT, HS, TK. Therapeutic study: TK, AT, HH. Writing and review of the manuscript: TK, HS, TU, YA, AH, HH.
Funding This work was supported, in part, by the Program to Disseminate the Tenure Tracking System in Japan funded by the Ministry of Education, Culture, Sports, Science and Technology (MEXT) of Japan, a Grant-in-Aid for Research Activity Start-up (16H06671) and Scientific Research (B) (19H03387) from the Japan Society for the Promotion of Science (JSPS), Takeda Science Foundation, the Inohana Foundation (Chiba University), the Ichiro Kanehara Foundation, and the Research Foundation for Pharmaceutical Sciences (to HH).
Competing interests None declared.
Patient consent for publication Not required.
Ethics approval All animal procedures were approved by the Chiba University Institutional Animal Care and Use Committee.
Provenance and peer review Not commissioned; externally peer reviewed.
Data availability statement Data are available upon reasonable request.