Article Text

Abstract
Background Tumor-infiltrating lymphocytes (TILs), mainly CD8+ cytotoxic T lymphocytes (CTL), are linked to immune-mediated control of human cancers and response to immunotherapy. Tumors have nonetheless developed specific mechanisms that selectively restrict T cell entry into the tumor microenvironment. The extracellular superoxide dismutase (SOD3) is an anti-oxidant enzyme usually downregulated in tumors. We hypothesize that upregulation of SOD3 in the tumor microenvironment might be a mechanism to boost T cell infiltration by normalizing the tumor-associated endothelium.
Results Here we show that SOD3 overexpression in endothelial cells increased in vitro transmigration of naïve and activated CD4+ and CD8+ T cells, but not of myeloid cells. Perivascular expression of SOD3 also specifically increased CD4+ and CD8+ effector T cell infiltration into tumors and improved the effectiveness of adoptively transferred tumor-specific CD8+ T cells. SOD3-induced enhanced transmigration in vitro and tumor infiltration in vivo were not associated to upregulation of T cell chemokines such as CXCL9 or CXCL10, nor to changes in the levels of endothelial adhesion receptors such as intercellular adhesion molecule-1 (ICAM-1) or vascular cell adhesion molecule-1 (VCAM-1). Instead, SOD3 enhanced T cell infiltration via HIF-2α-dependent induction of specific WNT ligands in endothelial cells; this led to WNT signaling pathway activation in the endothelium, FOXM1 stabilization, and transcriptional induction of laminin-α4 (LAMA4), an endothelial basement membrane component permissive for T cell infiltration. In patients with stage II colorectal cancer, SOD3 was associated with increased CD8+ TIL density and disease-free survival. SOD3 expression was also linked to a T cell–inflamed gene signature using the COAD cohort from The Cancer Genome Atlas program.
Conclusion Our findings suggest that SOD3-induced upregulation of LAMA4 in endothelial cells boosts selective tumor infiltration by T lymphocytes, thus transforming immunologically “cold” into “hot” tumors. High SOD3 levels are associated with human colon cancer infiltration by CD8+ T cells, with potential consequences for the clinical outcome of these patients. Our results also uncover a cell type–specific, distinct activity of the WNT pathway for the regulation of T cell infiltration into tumors.
- tumors
- immunology
This is an open access article distributed in accordance with the Creative Commons Attribution Non Commercial (CC BY-NC 4.0) license, which permits others to distribute, remix, adapt, build upon this work non-commercially, and license their derivative works on different terms, provided the original work is properly cited, appropriate credit is given, any changes made indicated, and the use is non-commercial. See http://creativecommons.org/licenses/by-nc/4.0/.
Statistics from Altmetric.com
Background
In many cancers, the density of tumor-infiltrating lymphocytes (TILs) determines immune-mediated control of tumor progression. The presence of TIL, mainly CD8+ cytotoxic T lymphocytes, correlates with disease outcome and response to immunotherapy.1–4 The lack of T cell–based tumor inflammation is nevertheless a frequent event in primary cancers,5 which suggests there are specific mechanisms that selectively restrict T cell entry into the tumor microenvironment (TME).
In some cases, T cells are excluded from tumors through neoplastic-cell-intrinsic mechanisms6; of these, the best characterized is the aberrant activation of the canonical WNT/β-catenin pathway.7 This pathway relies on WNT-induced stabilization and nuclear translocation of β-catenin (catenin beta-1, CTNNB1), a dual-function protein involved in cell–cell adhesion and transcriptional regulation.8 Many human cancers, particularly colorectal cancers (CRCs), show hyperactivation of the WNT pathway owing to WNT ligand production, or mutations of WNT regulatory elements such as adenomatous polyposis coli or other elements of the β-catenin “destruction complex”.7 In mouse models, β-catenin restricts TIL by impairing C-C motif chemokine ligand 4 (CCL4)–induced recruitment of CD103+ dendritic cells that produce C-X-C motif chemokine ligand 9 (CXCL9) and CXCL10, which are suggested to be dominant for T cell recruitment into tumors.9 Integrative analyses from TCGA datasets associated WNT/β-catenin pathway activation with a non-T cell–inflamed signature across many different human cancers.5 Nonetheless, tumor stroma production of a natural antagonist of the WNT pathway has been associated to enhanced infiltration by immune suppressor cells and tumor growth.10
In other cases, T cells are excluded from tumors by tumor cell-extrinsic mechanisms. Among these, the dysfunctional vasculature has emerged as an important factor in the generation of an immunosuppressive TME by multiple mechanisms.11 To enter the tumor, immune cells must cross an endothelial cell (EC) barrier, a process that requires a coordinated sequence of adhesive interactions involving selectins, integrins, various diapedesis receptors, and chemokines.12 They must also cross the endothelial basement membrane (BM), a largely overlooked obstacle, although BM crossing is a limiting step in leukocyte infiltration into tissues.13 14 The endothelial BM components include the laminins, a family of heterotrimeric T-shaped glycoproteins with a variety of adhesive and stimulatory functions.15 Laminins have overlapping as well as specific functions due to their alpha chains. This is exemplified by laminin-8 (α4β1γ1) and laminin-10 (α5β1γ1), the two predominant isoforms in vascular BM.15 Laminins bearing the α4 subunit (LAMA4) are associated to BM maturation and structural integrity of microvessels,16 and have been linked to permissive signals for transendothelial T cell migration17 18; in contrast, α5-containing laminins inhibit T cell transmigration.19 20 How these laminin α-subunits affect TIL density has not been studied.
Another intriguing question is whether vascular normalization induced by strategies other than blockade of angiogenic factors would trigger TIL in the TME. To address this issue, we took advantage of the recent finding that expression of extracellular superoxide dismutase (SOD3) in the TME improves tumor-associated vasculature function.21 SOD3 regulates the tissue redox balance by scavenging the ·O2 − anion,22 preventing oxidative damage of macromolecules and also preserving nitric oxide availability in the perivascular space. SOD3 normalizes tumor vasculature through specific stabilization of hypoxia-inducible factor (HIF)−2α, which then upregulates VE-cadherin (VEC) transcription, in turn reducing vascular leakage and increasing tumor perfusion.21 SOD3 is downregulated in a number of malignancies, including breast, lung, pancreas, and colorectal carcinomas.23–26 Whether SOD3 influences T cell trafficking into tumors is not known.
Here, we show that SOD3 induces a permissive signal in EC that selectively enhances transendothelial migration of effector T cells, but not of myeloid or regulatory T (Treg) cells into tumors. SOD3 levels are also associated with increased CD8+ TIL density and improved clinical outcome in patients with stage II CRC. SOD3 enhances T cell transmigration through an EC-autonomous mechanism that involves the HIF-2α-induced upregulation of specific WNT ligands. This in turn triggers the FoxM1-induced LAMA4 upregulation in EC, which supplies a permissive signal for T cell transmigration. These findings thus uncover a cell type–specific, distinct activity of the WNT pathway for the regulation of T cell infiltration into tumors, which could have clinical implications.
Methods
Detailed materials and methods are provided in online supplementary material.
Human samples
A tissue microarray was constructed using 1 mm cores from 95 tumor blocks of stage II infiltrating large bowel carcinomas from the surgical pathology database of the Hospital Fundación Jiménez Díaz (Madrid, Spain). Two pathologists independently selected the most representative areas and reviewed histopathological features. For mRNA analyses, we used freshly frozen stages I–IV tumor samples (cohort 1) and formalin-fixed paraffin-embedded tumor samples from patients with stage III CRC (cohort 2), both from the Hospital Clínico San Carlos Tumor Bank (Madrid, Spain).21 Appropriate informed consent was obtained from all patients and no personal data were registered.
Animals
C57BL/6J, Tg(TcraTcrb)1100Mjb/J (OT-I), Tg(TcraTcrb)425Cbn/J (OT-II), and B6.Cg-Tg(Tek-cre)1Ywa/J (Tie2-Cre) mice were from The Jackson Laboratory (Bar Harbor, ME). SOD3−/− mice were kindly provided by Tim D. Oury (University of Pittsburgh, Pittsburgh, PA). SOD3EC-Tg mice were generated by crossing loxP-SOD3KI (SOD3Cre−) mice21 with Tie2-Cre transgenic mice. HIF-2αEC-KO mice were generated as described.21
Cell lines, overexpression, and silencing
The Lewis lung carcinoma (LLC; ATCC), the EG7-SOD3 thymoma, and the murine microvascular 1G11-mock and 1G11-SOD3 cell lines were cultured as described.21 27 The OVA-expressing EG7-SOD3 thymoma (and the control EG7-mock) were generated by retroviral transduction and selected by cell sorting (MoFlo XDP; Beckman Coulter) using GFP fluorescent emission. HIF-2α was overexpressed and silenced in 1G11 cells as described.21 Stable β-catenin mutant Δ90βcat overexpression was achieved by transfection with pCAG-Δ90-GFP (a gift of Anjen Chenn; Addgene no. 26645) and cells selected by cell sorting. For FoxM1 overexpression, 1G11 cells were transfected with pCMV6-Entry/FoxM1-Myc-DDK (Origene, MR210493) and clones selected by limiting dilution with neomycin (750 µg/mL; Apollo Scientific). For LAMA4 silencing, 1G11-SOD3 cells were transfected with esiRNA targeting mouse LAMA4 (esiRNA1; Sigma-Aldrich; EMU083481) or a medium GC content siRNA duplex (Stealth RNAi siRNA Negative Control Med GC, 12935300; Invitrogen). For SOD3 overexpression in vivo, high-titer stocks of adenovirus expressing mouse SOD3 (Ad-SOD3) or β-galactosidase (Ad-C) were prepared as described.21
Syngeneic tumors and adoptive transfer
For all tumor models, female mice 2 to 5 months old were used. Exponentially growing LLC, EG7, or EG7-SOD3 cells were implanted subcutaneously in the indicated mice. In experiments involving Doxo treatment, mice received intratumor Ad-mSOD3 or Ad-C viruses (109 pfu/50 µL) injections on days 7, 9, 11, and 15 post-implantation, and Vhcl or Doxo (2.5 mg/kg, intraperitoneally; Farmitalia Carlo Erba, Italy) on days 7, 11, and 15. For in vivo WNT pathway inhibition, tumor-bearing mice were treated with XAV-939 or DMSO at days 5, 8, 11, 12, and 13. In experiments involving HIF-2αEC-KO mice, tamoxifen (Sigma-Aldrich) was diluted in ethanol and corn oil, heated (100°C) and injected (1 mg/mouse, intraperitoneally) on days 3, 4, and 5 post-LLC or post-EG7-SOD3 inoculation. For some experiments, naïve or activated OT-I cells (107 cells/mouse, intravenously) were adoptively transferred to tumor-bearing mice (see online supplementary methods). Tumors were measured blind to treatment or genotype, and tumor volume calculated using the formula V=(width2×length)/2. For Kaplan-Meier curves, mice were considered “dead” when tumor volume >700 mm3. OT-I cell number was estimated by FACS after staining with anti-Vα2-biotin, anti-Vβ5-PE, anti-CD45-BViolet570, and anti-CD8-eFluor450 antibodies, followed by streptavidin–APC. In the other tumor models, immune infiltration was determined by immunohistochemistry.
Adhesion and transmigration assays
Adhesion and migration assays were performed with primary CD3+, CD4+, CD8+ T cells and CD11b cells isolated from the spleen of OT-II and OT-I mice by negative selection, using 10% fetal calf serum, CCL19 (250 ng/mL; naïve T cells), CXCL10 (500 ng/mL; activated T cells), CCL2 (250 ng/mL; CD11b cells), or basal medium as chemoattractants.
mRNA quantification
Total RNA was extracted from mouse tumors and cell lines using TRI-Reagent (Sigma Aldrich) or RNeasy Mini or Micro Kit (Qiagen). RNA from human samples was extracted using TRIzol (Invitrogen) or RNeasy FFPE Kit (Qiagen), as described.21 mRNA levels were quantified by qPCR in an ABI PRISM 7900HT System (Applied Biosystems), using a SYBR EvaGreen-based reaction mix (5× PyroTaq EvaGreen qPCR Mix Plus ROX, Cmb-Bioline), with the primers listed in online supplementary table S1. β-Actin or CD31 (mouse samples) and RLP10A genes (human samples) were used for normalization. ChIP assays21 were performed with the Magna ChIP G (17-611; Merck Millipore). Each data point represented is the average of a technical triplicate in an independent experiment.
Supplemental material
Bioinformatic analyses
RSEM-normalized RNAseq expression data from 382 CRC tumor samples were obtained from TCGA through the Firebrowse repository (http://firebrowse.org/). A T cell inflammatory signature was computed as the average of the log expression values of 1346 genes.28
Statistical analyses
Qualitative data are represented with percentages and absolute numbers, quantitative data as mean±SEM, unless otherwise indicated; individual values are also shown and the number of replicates is given in figure legends. For mouse studies, sample size was estimated using the power method and values corrected for 20% attrition. For human samples, cases were divided into negative and positive for SOD3 or LAMA4 staining using a receiver operating characteristic (ROC) curve approach. For data with a Gaussian distribution and homogeneity of variances, statistical significance was calculated with a two-tailed Student’s t-test, with the Welch correction when the number of replicas was low, for comparison of two independent groups, and one-way or two-way ANOVA with Dunnett’s, Tukey’s, or Bonferroni’s post hoc test for multiple comparisons. When these requirements were not fulfilled, data were analyzed using non-parametric tests. The potential associations between qualitative variables were analyzed with the χ2 test. Correlation analyses were performed using the non-parametric Spearman’s rank correlation coefficient. The outcome measure used for the human stage II cohort study was disease-free survival, defined as the time elapsed between surgical resection of the tumor with a curative intent and recurrence of disease in months. In the univariate analysis, Kaplan-Meier survival curves were compared with log-rank tests. SOD3 expression values were compared between T cell–inflamed and non-inflamed TCGA signatures using Student’s t-test. Differences were considered significant when p value <0.05. Statistical analyses were performed using the statistical package SPSS V.20.0 for Windows, and Prism software. All statistical tests were two sided.
Results
SOD3 increases T cell transmigration in vitro and in vivo
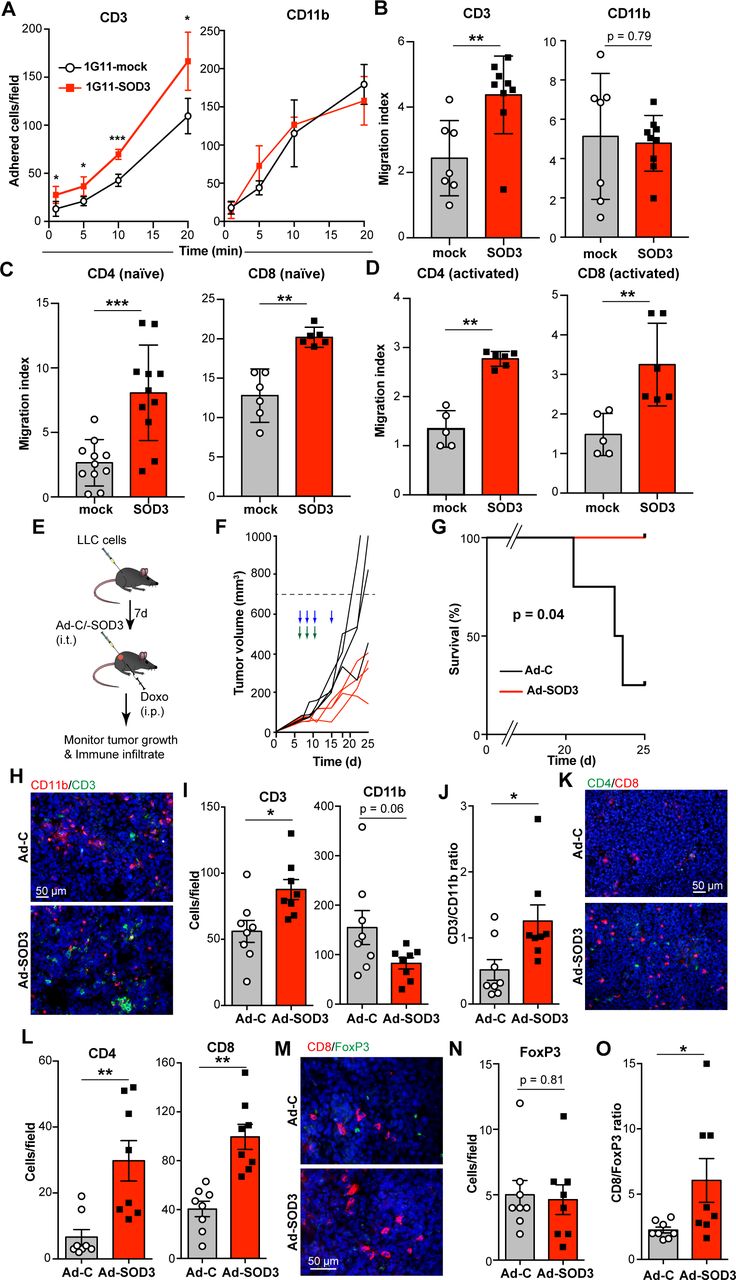
We analyzed the in vitro adhesion and transmigration of purified murine T (CD3+) and myeloid (CD11b+) cells through monolayers of mock- and SOD3-overexpressing 1G11 cells, a mouse microvascular EC line modified to overexpress SOD3 (for overexpression data see21). SOD3 overexpression in EC increased CD3+ T lymphocyte adhesion and transmigration (figure 1A,B). This SOD3 effect was T cell specific, as it was not observed for myeloid CD11b+ cells, and applied for both naïve and ex vivo–activated CD4+ and CD8+ T cells (figure 1C,D).

SOD3 selectively enhances T lymphocyte transmigration in vitro and in vivo. (A) Static adhesion of purified CD3+ T cells and CD11b+ myeloid cells to 1G11-mock and 1G11-SOD3 monolayers. Data shown as mean±SEM from a representative experiment (n=3). (B) CD3+ and CD11b+ cell transmigration through 1G11-mock or 1G11-SOD3 monolayers (n=7, 1G11-mock; n=9, 1G11-SOD3). (C) CCL19-induced transmigration of naïve CD4+ and CD8+ T cells through 1G11-mock or 1G11-SOD3 monolayers (n=11, CD4+ cells; n=6, CD8+ cells). (D) Transmigration of OVA-activated OT-II (CD4+) and OT-I (CD8+) cells through 1G11-mock or 1G11-SOD3 monolayers using CXCL10 as chemoattractant (n=5, 1G11-mock; n=6, 1G11-SOD3). (E) Scheme of the tumor model used; i.t., intratumor, i.p. intraperitoneal. (F) Growth kinetics of Ad-C-injected or Ad-SOD3-injected LLC tumors (n=4 mice/group). Arrows indicate treatment schedule with adenovirus (blue) and Doxo (green); a representative experiment is shown (n=2). (G) Kaplan-Meier survival curves for mice in (F). (H) CD3+ (green) and CD11b+ (red) cell infiltration into tumors from (F); nuclei were DAPI-stained (blue). (I) Quantification from (H) (n=8 fields; n=4 mice/group). (J) Ratio of tumor-infiltrating CD3+ and CD11b+ cells calculated from (H). (K) Ad-C-injected and Ad-SOD3-injected LLC tumor sections stained with anti-CD4+ (green) and anti-CD8+ (red) antibodies; nuclei were DAPI stained (blue). (L) Quantification from (K) (n=8 fields/condition; n=4 mice/group). (M) FoxP3+ (green) and CD8+ (red) infiltrating cells in Ad-C or Ad-SOD3 LLC tumors; nuclei (blue). (N) Quantification from (M) (n=8 fields; n=4 mice/group). (O) FoxP3+:CD8+ ratio calculated in each image from (M). Mean±SEM are shown; each data point represents an individual measurement from at least three independent experiments (B–D) or from each mouse (I–K, M, N); *p<0.05, **p<0.01, two-tailed Student’s t-test.
To explore this selective SOD3 effect in vivo, we injected LLC cells into syngeneic immunocompetent mice; once tumors engrafted, mice received injections of adenoviruses expressing SOD3 (Ad-SOD3) to overexpress SOD3 in the TME, or β-galactosidase (Ad-C) as control, as verified by immunohistochemistry (IHC). In these conditions, SOD3 overexpression had no effect on tumor growth or immune infiltrate (online supplementary figure S1).
We hypothesized that the absence of immunogenic stimulus in the aforementioned tumor model might limit T cell infiltration, precluding any SOD3 effect. To overcome this limitation, an immune response to LLC tumors was boosted by doxorubicin (Doxo) administration, which induces immunogenic cell death29; Ad-SOD3 or Ad-C were then injected (figure 1E). Ad-SOD3-treated tumors showed reduced growth kinetics (figure 1F), which extended mouse survival (figure 1G). This was predicted, as SOD3 increases Doxo delivery into tumors.21 Analysis of the immune infiltrate also indicated a specific increase in TIL number (CD3+) in Ad-SOD3-injected tumors compared with Ad-C controls (figure 1H,I), which resulted in an increased lymphoid:myeloid ratio (figure 1J). SOD3 enhanced both CD4+ and CD8+ TIL density (figure 1K,L), but not of FoxP3+ Treg cells (figure 1M,N), which led to a higher CD8+:FoxP3+ cell ratio in Ad-SOD3-injected than in Ad-C-injected tumors (figure 1O). Baseline T cell infiltration was comparable in Ad-C-injected, Doxo-treated (figure 1I) and untreated LLC tumors (online supplementary figure S1); this suggested that the Doxo-induced immune response is not sufficient to boost T cell extravasation in tumors in the absence of SOD3 overexpression.
As lovastatin (Lov) upregulates SOD3 in the TME,21 30 to further confirm the SOD3 effect on TIL density, we implanted LLC tumors in WT and SOD3−/− mice, followed by Doxo and Lov treatment. As predicted,21 Lov treatment induced SOD3 expression in LLC tumors implanted in WT mice (online supplementary figure S2B) and was associated with increased T cell but not CD11b+ cell infiltration (online supplementary figure S2C–F). Lov increased T cell infiltration only in WT-grafted tumors, which indicated that the effect was mediated by SOD3 expression. The extremely low SOD3 levels in LLC tumors implanted in vehicle-treated WT mice might explain the lack of differences in intratumor T cell number compared with tumors grafted in SOD3−/− mice. Genetic or pharmacological upregulation of SOD3 in the TME therefore promotes selective tumor infiltration by T cells.
SOD3 increases the effectiveness of anti-tumor T cell adoptive transfer
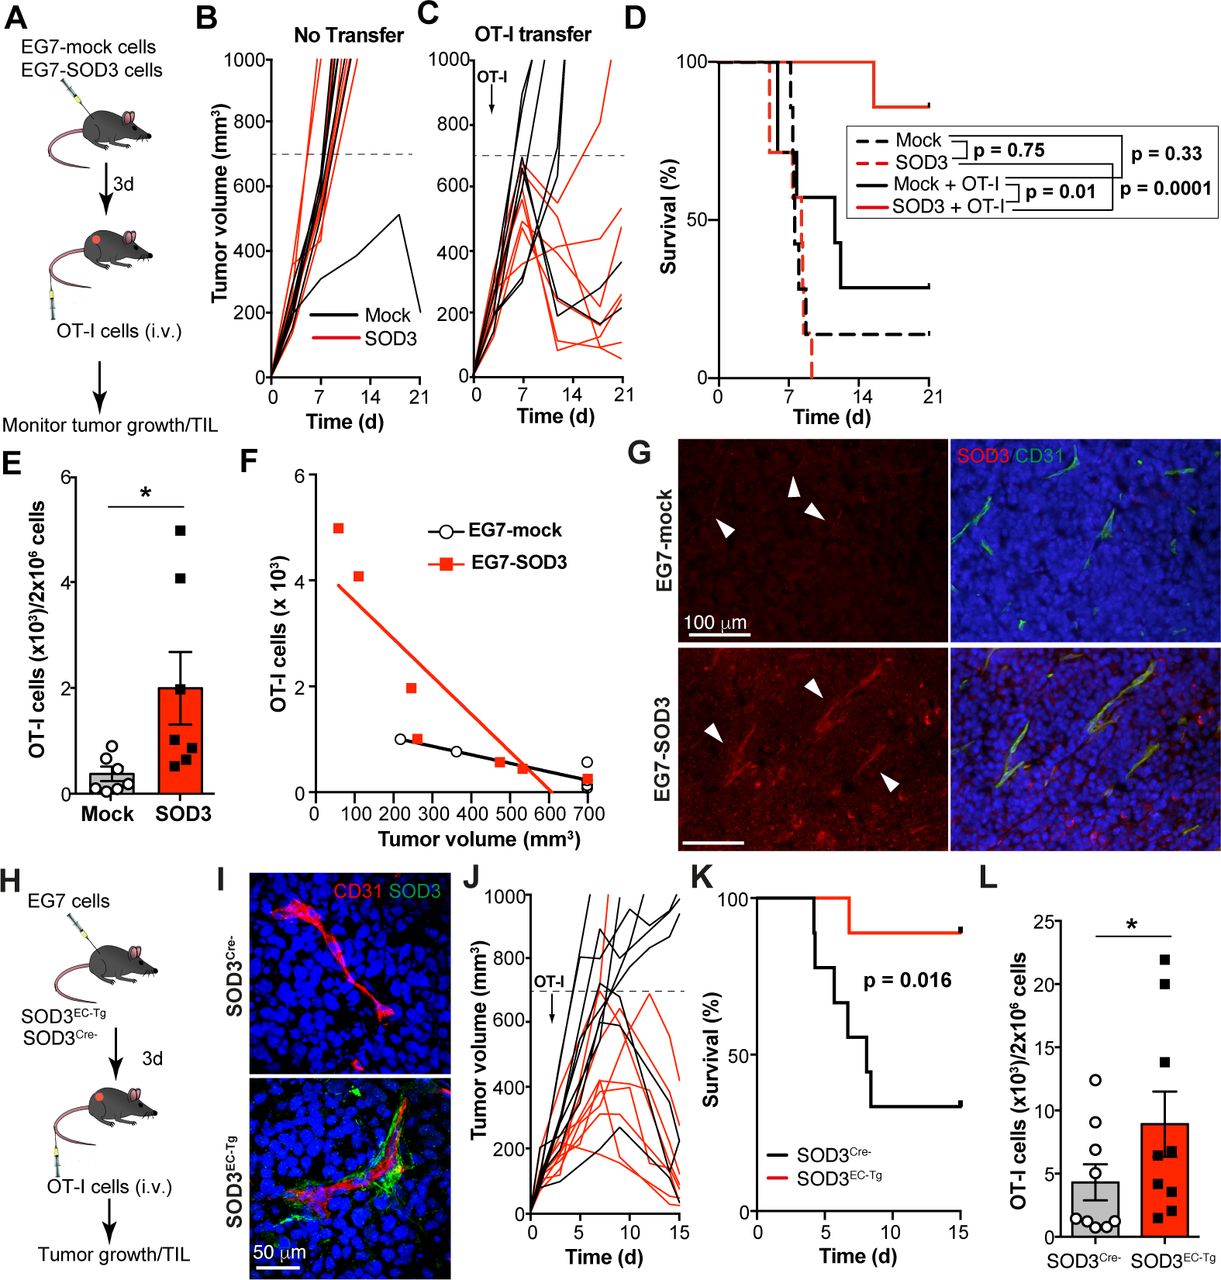
Since SOD3 overexpression or Lov treatment increases Doxo absorption into the tumor parenchyma,21 30 enhancement of TIL in SOD3-overexpressing tumors might be a collateral effect of boosted anti-tumor immune responses bound to Doxo treatment. To link SOD3 directly to enhanced T cell extravasation, we performed adoptive transfer of ovalbumin (OVA)−specific, naïve CD8+ (OT-I) transgenic T cells to mice engrafted with mock- or SOD3-overexpressing EG7 thymomas, which also express OVA (figure 2A). EG7-SOD3 and EG7-mock cells proliferated equally in vitro (online supplementary figure S3), and tumor growth kinetics were similar in mice that did not receive OT-I cells (figure 2B). Adoptive transfer of OT-I cells restricted EG7-SOD3 growth more efficiently than that of EG7-mock tumors (figure 2C,D). Indeed, OT-I cell transfer increased survival only in mice engrafted with EG7-SOD3 but not with EG7-mock cells (figure 2D), and this was associated with an increase in intratumor OT-I cells (figure 2E).

SOD3 fosters tumor-specific T lymphocyte infiltration. (A) Scheme of the tumor-specific CD8+ T cell adoptive transfer model; i.v., intravenous. (B, C) Growth kinetics of EG7-mock-induced or EG7-SOD3-induced tumors adoptively transferred with OT-I T-cells (C; arrow) or not (B) (n=7 mice/group). A representative experiment is shown (n=2). (D) Survival curves for the mice evaluated in (B, C). Curves of mice that did not receive OT-I cells are shown as dotted lines. The p values of the log-rank test for the comparisons are indicated. (E) Normalized number of OT-I cells infiltrating EG7-mock and EG7-SOD3 tumors, as determined by FACS. (F) Linear regression analyses showing the correlation between OT-I TIL and the volume for EG7-mock and EG7-SOD3 tumors. (G) SOD3 (red) and CD31 (green) staining from tumors in (A); nuclei were DAPI stained (blue). (H) Scheme of the OT-I adoptive transfer protocol in the EC-specific SOD3 transgenic (SOD3EC-Tg) mouse model. (I) Staining for SOD3 (red) and CD31 (green) in EG7 tumors; nuclei in blue (n=7/condition). (J) Growth kinetics of EG7-induced tumors implanted in control (SOD3Cre−) and SOD3EC-Tg mice. OT-I transfer is indicated (arrow) (n=9 mice/group). A representative experiment is shown (n=2). (K) Survival curves for the mice evaluated in (J). The p value of the log-rank test is indicated. (L) Normalized number of OT-I cells (×103) infiltrating EG7 tumors from mice in (J). Mean±SEM and individual values are shown; *p<0.05, two-tailed Student’s t-test.
The enhanced anti-tumor effect observed in SOD3-overexpressing tumors might be solely a result of increased OT-I infiltration, but could also due to improved cytolytic activity of OT-I TIL. To discriminate between these possibilities, we analyzed the correlation between intratumor OT-I cell number and tumor size. OT-I TIL numbers correlated inversely with tumor volume in both groups (EG7-mock: r2=0.808, p=0.006; EG7-SOD3: r2=0.773, p=0.009; figure 2F), which suggests that SOD3 overexpression did not alter OT-I effector activity, but only their arrival to the tumor.
Histochemical analyses showed higher SOD3 levels in EG7-SOD3 than in EG7-mock tumors (figure 2G); unexpectedly, this tumor-produced SOD3 accumulated near CD31+ structures. To determine the relevance of perivascular SOD3 accumulation for TIL density, we crossed loxP-SOD3KI mice21 with mice expressing Tie2-Cre, which drive SOD3 expression to the endothelium. Tie2-Cre+ (SOD3 overexpression in EC; SOD3EC-Tg) or negative (SOD3Cre−) littermates were inoculated with EG7 cells, after which OT-I cells were transferred to tumor-bearing mice (figure 2H). Perivascular SOD3 expression was found in ~55% of CD31+ structures in tumors implanted in SOD3EC-Tg mice, whereas SOD3 was almost undetectable in tumors from SOD3Cre− mice (figure 2I). OT-I transfer reduced tumor growth more efficiently in SOD3EC-Tg (8/9) than in SOD3Cre− mice (3/9; figure 2J), which increased the survival of the former (figure 2K). This anti-tumor effect was associated with enhanced OT-I cell infiltration in SOD3-expressing tumors (figure 2L). These results suggest that SOD3 abundance in the TME, and particularly in the perivascular region, directly determines TIL density and thus the efficacy of adoptively transferred tumoricidal T lymphocytes.
SOD3–HIF-2α pathway regulates T cell transmigration
Analysis of selected chemokines and cytokines in cultured 1G11-mock and 1G11-SOD3 cell supernatants showed no major differences, with the exception of a slight decrease in macrophage colony-stimulating factor (M-CSF) and CCL2 levels, and a slight increase in tissue inhibitor of metalloprotease (TIMP)−1 associated to SOD3 overexpression (online supplementary figure S4A,B). M-CSF and CCL2 might be implicated in myeloid cell migration and/or expansion,31 32 whereas TIMP-1 could inhibit lymphocyte infiltration.33 34 Of the CXCR3 ligands, only CXCL10 was slightly repressed in 1G11-SOD3 compared with 1G11-mock cells (online supplementary figure S4A); CXCL9 and CXCL11 were not detected. qPCR analyses confirmed downregulation of CXCL10 and CCL2 but upregulation of CXCL1 mRNA in SOD3-expressing cells (online supplementary figure S4C). Adhesion molecules necessary for leukocyte diapedesis, such as intercellular adhesion molecule-1 (ICAM-1) and vascular cell adhesion molecule-1 (VCAM-1), showed no differential expression between 1G11-mock and 1G11-SOD3 cells (online supplementary figure S4D).
We also analyzed CXCR3 ligand expression in tumor models in which SOD3 augmented T cell infiltration in vivo. In the LLC model (figure 1E), Ad-SOD3-injected tumors showed higher CXCL9 mRNA levels than those from Ad-C-injected tumors; CXCL10 and CXCL11 did not differ (online supplementary figure S4E). In contrast, none of the CXCR3 ligands changed significantly in OT-I-transferred tumors implanted in SOD3Cre− and SOD3EC-Tg mice (online supplementary figure S4F), although OT-I infiltration was significantly higher in the latter (figure 2L). These results could indicate that CXCR3 ligands are not necessary mediators of the SOD3 effect on TIL infiltration.
Since SOD3 triggers HIF-2α stabilization,21 we analyzed HIF-2α involvement in selective T cell transmigration. HIF-2α overexpression in EC enhanced (figure 3A–C), whereas HIF-2α silencing restrained transmigration of CD4+ and CD8+ T cells (figure 3D–F). These findings indicate an EC-autonomous SOD3 effect on T cell transmigration mediated by HIF-2α levels. To place HIF-2α unequivocally downstream of SOD3 in the regulation of T cell transmigration in vivo, we analyzed the infiltration of adoptively transferred, antigen-activated OT-I cells into EG7-SOD3 tumors implanted in mice with endothelial deletion of HIF-2α (HIF-2αEC-KO)21 or control (HIF-2αf/f) littermates (figure 3G). We found reduced infiltration of activated OT-I cell in tumors grafted in HIF-2αEC-KO mice compared with controls (figure 3H). In addition, we retrospectively analyzed TIL density in Ad-SOD3-injected, Doxo-treated LLC tumors grafted in HIF-2αEC-KO or HIF-2αf/f mice (figure 3I). In this model, Ad-SOD3 injection increases Doxo anti-tumor effectiveness in tumors implanted in HIF-2αf/f mice, but not when grafted in HIF-2αEC-KO mice.21 IHC analyses with anti-CD3, anti-CD4, and anti-CD8 antibodies showed reduced TIL density in tumors grafted in HIF-2αEC-KO mice compared with those grafted in HIF-2αf/f littermates (figure 3J–L). These data suggest that endothelial HIF-2α is a necessary mediator of SOD3 to increase TIL numbers.

SOD3 enhances T cell transmigration through HIF-2α. (A) HIF-2α staining in 1G11-mock and 1G11-HIF-2α-overexpressing cells (n=10/condition). (B) Representative immunoblots of cells as in (A), hybridized with anti-HIF-2α and anti-β-actin antibodies. The HIF-2α:β-actin ratio (mean±SEM) is shown at bottom (n=3). (C) CCL19-induced CD4+ and CD8+ T cell transmigration through mock- and HIF-2α-overexpressing 1G11 monolayers (n=6). (D) HIF-2α staining in shNT-transfected and shHIF-2α-transfected 1G11 cells (n=12/condition). (E) Determination of HIF-2α levels in total lysates from shNT-transfected and shHIF-2α-transfected 1G11 cells. The HIF-2α:actin ratio is shown at bottom (n=3). (F) CCL19-induced transmigration of CD4+ and CD8+ T cell through 1G11-shNT and HIF-2α-silenced 1G11 monolayers (n=6). (G) Scheme of the tumor-specific CD8+ T cell adoptive transfer model used in mice with tamoxifen-inducible HIF-2α deletion in EC (HIF-2αEC-KO). (H) Normalized number of OT-I cells infiltrating EG7 tumors from mice as in (G) (n=7 mice/group from two independent experiments). (I) Tumor model used for analysis of the immune infiltrate in HIF-2αEC-KO after induction of immunogenic cell death by Doxo injection. (J) Quantification of TIL (CD3+ cells) in LLC tumors grown in control (HIF-2αf/f) and HIF-2αEC-KO mice (n=12 fields/condition; n=4 mice/group). (K) Micrographs showing CD4+ (green) and CD8+ (red) infiltrating cells in LLC tumors from (J); nuclei were DAPI stained (blue). (L) Quantification of images from (K) (n=13 fields/condition; n=4 mice/group). *p<0.05, **p<0.01, ***p<0.001, two-tailed Student’s t-test.
SOD3–HIF-2α upregulates WNT ligands in EC
In normoxia, SOD3 stabilizes HIF-2α but not HIF-1α.21 A search for genes whose expression has been reported specifically regulated by HIF-2α identified six potential candidates (including VEC) by which SOD3 might regulate T cell transmigration. We focused on WNT1-inducible signaling pathway protein 2 (WISP2/CCN5), a non-conventional WNT ligand of the CCN (cysteine-rich 61 (Cyr61/CCN1)/connective tissue growth factor (CTGF/CCN2)/nephroblastoma overexpressed gene (NOV/CCN3)) family, since WISP2 modifies the perivascular environment through its interaction with the integrin αvβ3 35 36; WISP2 also modulates the immune cell infiltrate in breast tumors,37 although to our knowledge, specific effects on T cell migration have not been described.
WISP2 protein (figure 4A) and mRNA (figure 4B) levels were higher in 1G11-SOD3 than in 1G11-mock cells, which suggests transcriptional regulation by SOD3. HIF-2α overexpression increased (figure 4C), whereas HIF-2α silencing reduced (figure 4D) WISP2 mRNA levels in 1G11 cells. In silico analyses identified four putative hypoxia-responsive elements (HRE) in the mouse WISP2 promoter (figure 4E). Chromatin immunoprecipitation (ChIP) showed that SOD3 enhanced HIF-2α association to the WISP2 gene promoter −2000 region (figure 4F), compatible with binding to the HRE region; no enhancement was found when a distal promoter region was analyzed. Moreover, WISP2 mRNA levels were reduced in EG7-SOD3 tumors grown in HIF-2αEC-KO mice compared with those engrafted in control mice (figure 4G); Ad-SOD3-injected LLC tumors grown in HIF-2αEC-KO mice also showed reduced WISP2 mRNA levels than controls (figure 4H). These results suggest a HIF-2α-dependent, SOD3-induced transcriptional upregulation of WISP2 in vitro and in vivo.

SOD3 induces WNT ligand transcription in endothelial cells. (A) Time-dependent accumulation of WISP2 in the supernatant of 1G11-mock and 1G11-SOD3 cells as determined by ELISA (n=3). (B) Relative WISP2 mRNA levels in 1G11-mock and 1G11-SOD3 cells (n=6). (C) Relative WISP2 mRNA levels in 1G11-mock and HIF-2α-expressing 1G11 cells (n=3). (D) Relative WISP2 mRNA levels in control (shNT) and HIF-2α-silenced 1G11 cells (n=6). (E). Scheme of the WISP2 promoter with the four HIF-2α binding sites identified. Numbers indicate positions relative to the transcription start site; arrows indicate primers used for ChIP amplification. (F) ChIP analysis of WISP2 promoter in 1G11-mock and 1G11-SOD3 cells using anti-HIF-2α antibodies. Coprecipitated DNA fragments were quantified by PCR using the primers indicated (n=3). (G, H) Relative WISP2 mRNA levels in EG7-SOD3 tumors (G; n=7 mice/group from two independent experiments), and Ad-SOD3-injected LLC tumors (H; n=4 mice/group in a representative experiment) dissected from control (HIF-2αf/f) and HIF-2αEC-KO mice from the experiments described in figure 3G,I, respectively. (I) mRNA levels of the indicated WNT ligands in 1G11-mock and 1G11-SOD3 cells. Values in 1G11-mock cells were used as reference (n=3). (J, K) Relative WNT2 and WNT2b mRNA levels in HIF-2α-overexpressing (J) or HIF-2α-silenced (K) 1G11 cells (n=3). For RT-qPCR experiments, each data point represents the mean of a technical triplicate in an independent experiment or mouse. Data shown as mean±SEM; *p<0.05, **p<0.01, ***p<0.001, two-tailed Student’s t-test.
In addition to WISP2, overexpression of SOD3 in 1G11 cells upregulated WNT2 and WNT2b (also known as WNT13), whereas it downregulated WNT7a mRNA levels (figure 4I). WNT2 and WNT2b mRNA levels were increased by HIF-2α overexpression and reduced in HIF-2α-silenced cells (figure 4J,K). SOD3 appears to enhance specific WNT ligand transcription in a HIF-2α-dependent manner.
SOD3 activates the WNT pathway in EC
Stabilization of β-catenin is an indicator of WNT pathway activation.8 Whereas CTNNB1 mRNA levels were equivalent in 1G11-mock and 1G11-SOD3 cells (not shown), SOD3 overexpression increased protein levels of β-catenin, which localized mainly to the cytosolic and juxtamembrane region in 1G11-SOD3 cells (figure 5A); only a residual fraction colocalized with DAPI in the nucleus. Time-dependent β-catenin degradation in cycloheximide (CHX)–treated 1G11-mock and 1G11-SOD3 cells confirmed the higher β-catenin levels in SOD3-expressing cells, although these differences, significant only at initial time points, were lost progressively (figure 5B). β-catenin half-life was comparable between both cell types (3.9±0.9 hours, 1G11-mock; 5.3±1.2 hours, 1G11-SOD3; p=0.49, two-tailed Student’s t-test), which indicates that SOD3 does not affect the β-catenin degradation machinery directly. With the exception of AXIN2, we found no differences in the expression of well-known prototypic WNT/β-catenin-upregulated genes such as cyclin D1 (CCND1), MYC, and vascular endothelial growth factor-A (VEGFA)38 between 1G11-mock and 1G11-SOD3 cells (figure 5D). Transcription of all these genes was nonetheless readily induced in 1G11-SOD3 cells that overexpressed the nuclear N-terminal-truncated β-catenin mutant Δ90βcat (online supplementary figure S5). The lack of induction of canonical WNT/β-catenin genes in 1G11-SOD3 cells might not be an intrinsic defect, but linked to β-catenin retention outside the nucleus.
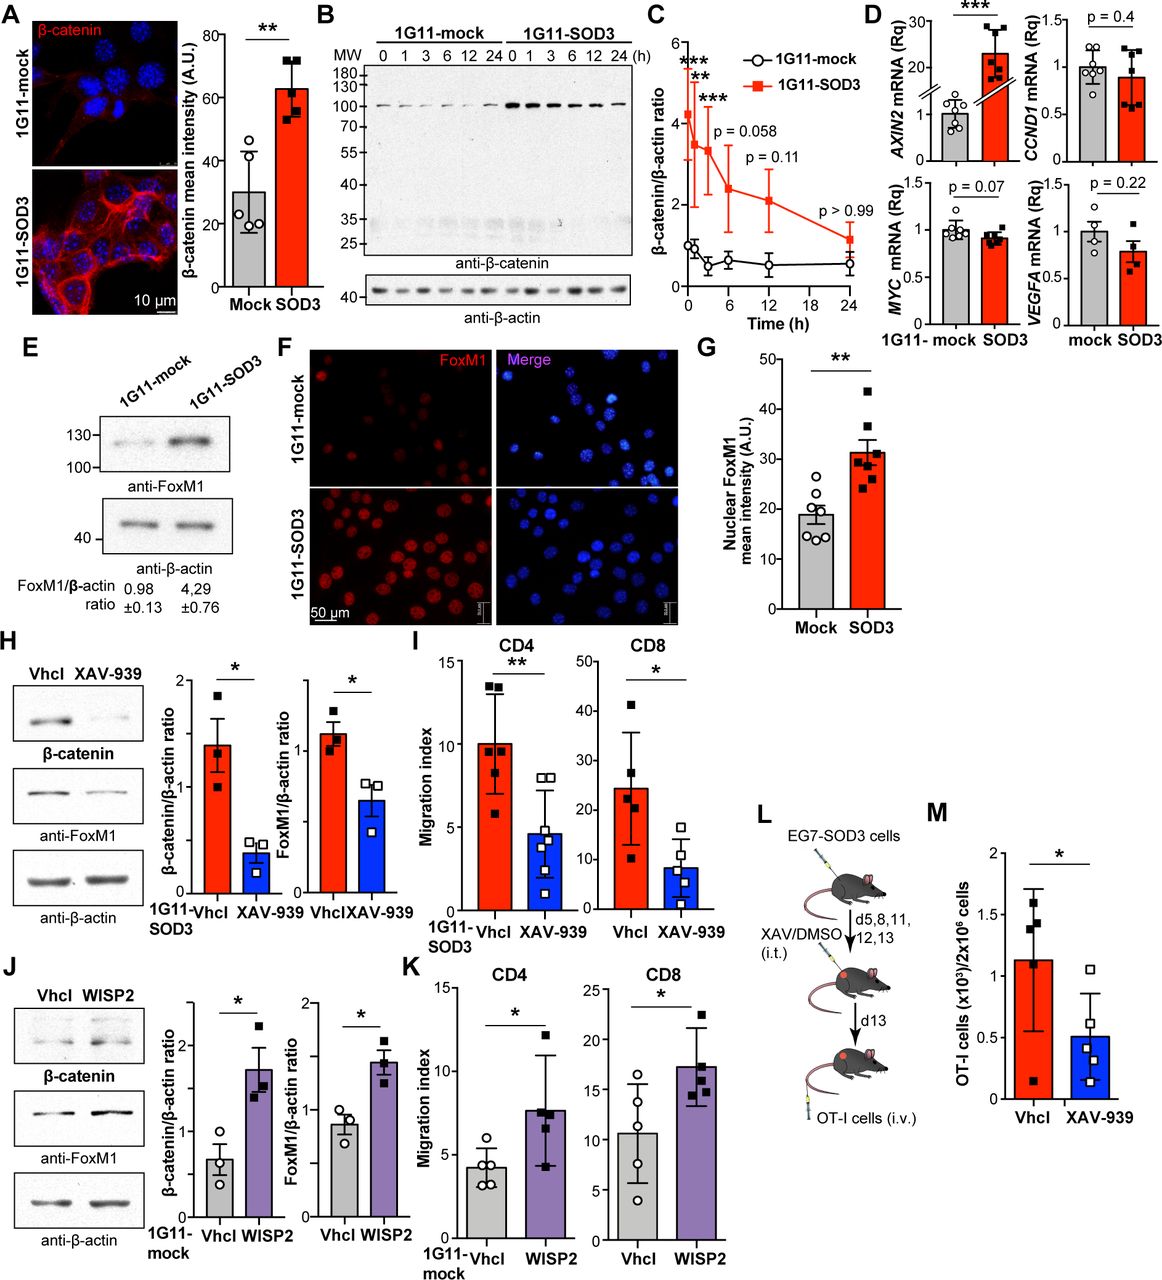
SOD3-induced WNT activation mediates enhanced T cell transmigration. (A) β-Catenin localization and fluorescence intensity in 1G11-mock and SOD3-expressing 1G11 cells (n=5 fields/condition). (B) Immunoblots of β-catenin (up) and β-actin (loading control) in cycloheximide-treated 1G11-mock and 1G11-SOD3 cells (n=4). (C) β-Catenin:actin densitometry ratio from (B). (D) Relative expression of the prototypic WNT-regulated genes in 1G11-mock and 1G11-SOD3 cells (n=4–7). (E) Immunoblots of FoxM1 and β-actin (loading control) in 1G11-mock and 1G11-SOD3 cells (n=4). The densitometric FoxM1:β-actin ratio is indicated (bottom). (F, G) Micrographs (F) and quantification (G) of nuclear FoxM1 fluorescence intensity in 1G11-mock and 1G11-SOD3 cells (n=7 fields/condition; >20 cells/field). Nuclei were DAPI stained (blue). (H) β-Catenin and FoxM1 levels in Vhcl-treated or XAV-939-treated 1G11-SOD3 cells. Quantification is shown at right, with β-actin as reference (n=3). (I) CCL19-induced CD4+ and CD8+ T cell transmigration through Vhcl-treated or XAV-939-treated 1G11-SOD3 monolayers (n=6). (J) β-Catenin and FoxM1 levels in 1G11-mock cells before and after stimulation with WISP2. Quantification using β-actin as reference (n=3). (K) CCL19-induced CD4+ and CD8+ T cell transmigration through 1G11 monolayers stimulated or not with WISP2 (n=5). (L) Tumor model used to test the XAV-939 effect on SOD3-induced T cell infiltration. (M) Number of OT-I cells (×103) infiltrating XAV-939-treated and Vhcl-treated EG7-SOD3 tumors (n=5 mice/group; n=2). Each data point represents an independent measurement (A, G–K, M); for (C), data are mean±SEM of four independent experiments. For (D), each data point represents the mean of a technical triplicate in an independent experiment; *p<0.05, **p<0.01, ***p<0.001, two-tailed Student’s t-test, or two-way ANOVA with Bonferroni post hoc test (C).
The WNT pathway also stabilizes the forkhead box M1 (FoxM1) transcription factor,39 whose deficiency causes severe abnormalities in lung vasculature during development.40 Total FoxM1 protein levels (figure 5E) and nuclear accumulation (figure 5F,G) were higher in 1G11-SOD3 than in 1G11-mock cells. SOD3 nonetheless did not alter FOXM1 mRNA levels (not shown), which suggests a posttranscriptional regulatory mechanism. These results thus indicate that SOD3 triggers some features of the WNT/β-catenin pathway in endothelial cells.
WNT pathway mediates SOD3-enhanced T cell transmigration
To analyze the importance of the SOD3-induced WNT pathway on T cell transmigration, WNT pathway was inhibited in 1G11-SOD3 cells by incubation with the pan-tankyrase inhibitor XAV-939. XAV-939 treatment reduced both β-catenin and FoxM1 protein levels (figure 5H), as well as the transmigration of CD4+ and CD8+ T cells (figure 5I). In contrast, WNT pathway agonism by WISP2 stimulation of 1G11-mock cells increased β-catenin and FoxM1 protein levels (figure 5J), and recapitulated the enhanced CD4+ and CD8+ T cell transmigration observed following SOD3 overexpression (figure 5K).
To determine whether the WNT pathway affects the enhanced TIL density associated to SOD3 overexpression, we adoptively transferred activated OT-I cells in EG7-SOD3 tumor-bearing mice pre-treated intratumorally with XAV-939 (figure 5L). SOD3 overexpression did not induce the WNT/β-catenin pathway in EG7 cells (online supplementary figure S6A); moreover, the short XAV-939 treatment caused no differences in tumor weight (online supplementary figure S6B). Compared with treatment with vehicle (Vhcl), XAV-939 significantly decreased OT-I infiltration of EG7-SOD3 tumors (figure 5M). These results place WNT pathway activation as a downstream mediator of SOD3 that enhances T cell transmigration in vitro and in vivo.
SOD3/HIF-2α/WNT pathway induces laminin α4
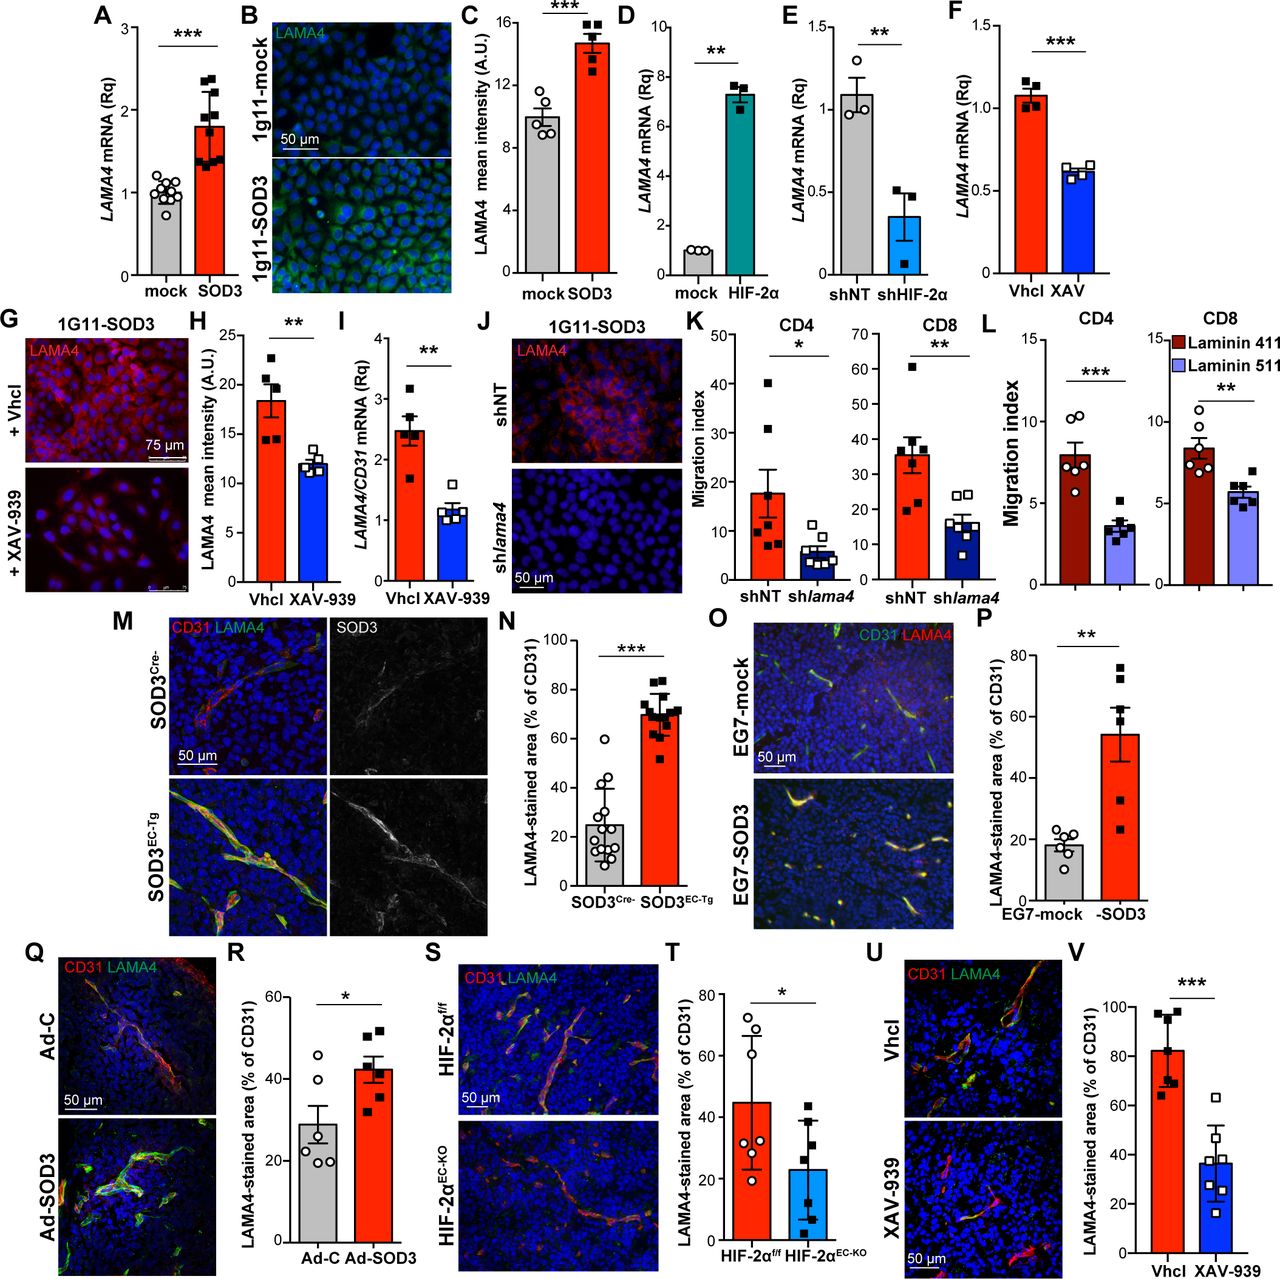
To search for potential WNT-regulated genes that could affect T cell transmigration, we focused on the BM component LAMA4, a transcriptional target of FoxM140 that provides permissive signals for T cell migration.17 18 FoxM1 overexpression also upregulated LAMA4 in 1G11 cells (online supplementary figure S7). LAMA4 mRNA and protein levels were higher in SOD3-expressing than in 1G11-mock cells (figure 6A–C). HIF-2α overexpression upregulated, whereas HIF-2α silencing reduced LAMA4 mRNA levels in these cells (figure 6D,E). 1G11-SOD3 cell treatment with XAV-399 reduced LAMA4 mRNA and protein levels compared with Vhcl-treated cells (figure 6F–H). Moreover, LAMA4 mRNA levels were reduced in XAV-939-treated tumors compared with controls (figure 6I). These data suggest that SOD3 triggers LAMA4 transcription in a HIF-2α-dependent and WNT-dependent manner.

SOD3 effect on T cell transmigration parallels LAMA4 levels. (A, B) LAMA4 mRNA (A; n=10) and protein levels (green, B) in 1G11-mock and 1G11-SOD3 cells; nuclei were DAPI counterstained (blue). (C) Mean fluorescence intensity from the images in (B) (n=7 fields/condition). (D, E) LAMA4 mRNA levels in HIF-2α-overexpressing 1G11 cells (D) and HIF-2α-silenced 1G11-SOD3 (E). (F) LAMA4 mRNA levels in Vhcl-treated and XAV-939-treated 1G11-SOD3 cells (n=4). (G, H) LAMA4 staining (red) in Vhcl-treated and XAV-939-treated 1G11-SOD3 cells; nuclei (blue); quantification in (H) (n=6 fields/condition). (I) LAMA4 mRNA levels in XAV-939-treated and Vhcl-treated tumors, normalized to CD31 mRNA (n=5/group). (J) LAMA4 staining (red) in 1G11-SOD3 cells at 48 hours post-transfection with non-target (shNT) or lama4-specific (shlama4) shRNA. (K) CD4+ and CD8+ T cell transmigration through shNT-transfected or shlama4-transfected 1G11-SOD3 (n=7). (L) Transmigration of naïve T cells through 1G11 cells seeded on laminin-411 or laminin-511 (n=6). (M, N) CD31 (red), LAMA4 (green), and SOD3 (pseudo-color gray) in EG7 tumors implanted in SOD3Cre− and SOD3EC-Tg mice; quantification of the LAMA4/CD31 area in (N) (n=14 fields/condition). (O, P) CD31 (green) and LAMA4 (red) in sections from EG7-mock and EG7-SOD3 tumors; LAMA4/CD31 quantification in (P) (n=6 fields/condition). (Q, R) CD31 (red) and LAMA4 (green) staining (Q) and quantification (R; n=6 fields/condition) in Ad-C-injected and Ad-SOD3-injected LLC tumors; nuclei (blue). (S, T) Staining of CD31 (red) and LAMA4 (green) in EG7-SOD3 tumors implanted in HIF-2αf/f and HIF-2αEC-KO mice; LAMA4/CD31 area quantification in (S) (n=7/condition). (U, V) CD31 (red) and LAMA4 (green) in XAV-939-treated and Vhcl-treated tumors; quantification of the LAMA4/CD31 area in (U) (n=7/condition). Images from tumors were quantified from at least three mice/experimental condition; *p<0.05, **p<0.01, ***p<0.001, two-tailed Student’s t-test.
This SOD3-induced LAMA4 expression is relevant for T cell transmigration since LAMA4 silencing in 1G11-SOD3 cells reduced CD4+ and CD8+ T cell transmigration compared with siNT-transfected cells (figure 6J,K). We also found that 1G11 monolayers seeded on laminin-411-coated inserts were more permissive to T cell chemotaxis than those on laminin-511-coated transwells (figure 6L). These experiments pinpoint LAMA4 as a potential SOD3 target in enhanced transendothelial T cell migration.
We then tested whether this SOD3/HIF-2α/WNT/LAMA4 hub correlated with TIL density in vivo by retrospective analysis of LAMA4 staining in some tumor models used during the study. Endothelial SOD3 overexpression in EG7 tumors implanted in SOD3EC-Tg mice boosted infiltration of OT-I transferred cells (figure 2L); these tumors also showed an increase in the number of CD31+ structures decorated with LAMA4 compared with those implanted in SOD3Cre− mice (figure 6M,N). We also observed an association between high TIL density, SOD3 overexpression, and strong endothelial LAMA4 staining in EG7-SOD3 (figure 6O,P) and Ad-SOD3-injected LLC tumors (figure 6Q,R), two conditions that enhanced TIL density (figures 2E,I). In contrast, perivascular LAMA4 levels were low in EG7-SOD3 tumors implanted in HIF-2αEC-KO or XAV-939-treated mice figure 6S–V), two models with decreased TIL density (figures 3H and 5M). These data not only suggest LAMA4 induction by SOD3 in vivo, but also implicate LAMA4 as a potential mediator of SOD3-enhanced T cell infiltration.
SOD3 correlates with CD8+ T cell infiltration in colorectal carcinomas
To study whether SOD3 levels influence TIL in human cancers, we used a tissue microarray (TMA) of 95 primary stage II colorectal carcinomas (online supplementary table S2) from patients diagnosed between January 2000 and December 2010. Based on ASCO and ESMO guidelines,41 the patients received neither neoadjuvant nor adjuvant chemotherapy until recurrence. Thirty patients relapsed (range 3–76 months), similar to recurrence in some studies for this tumor stage.42 We found no statistically significant association between age or gender and disease progression; although there was a tendency toward association between disease progression and tumor grade, the number of high-grade lesions was too small (8) to infer statistical significance.
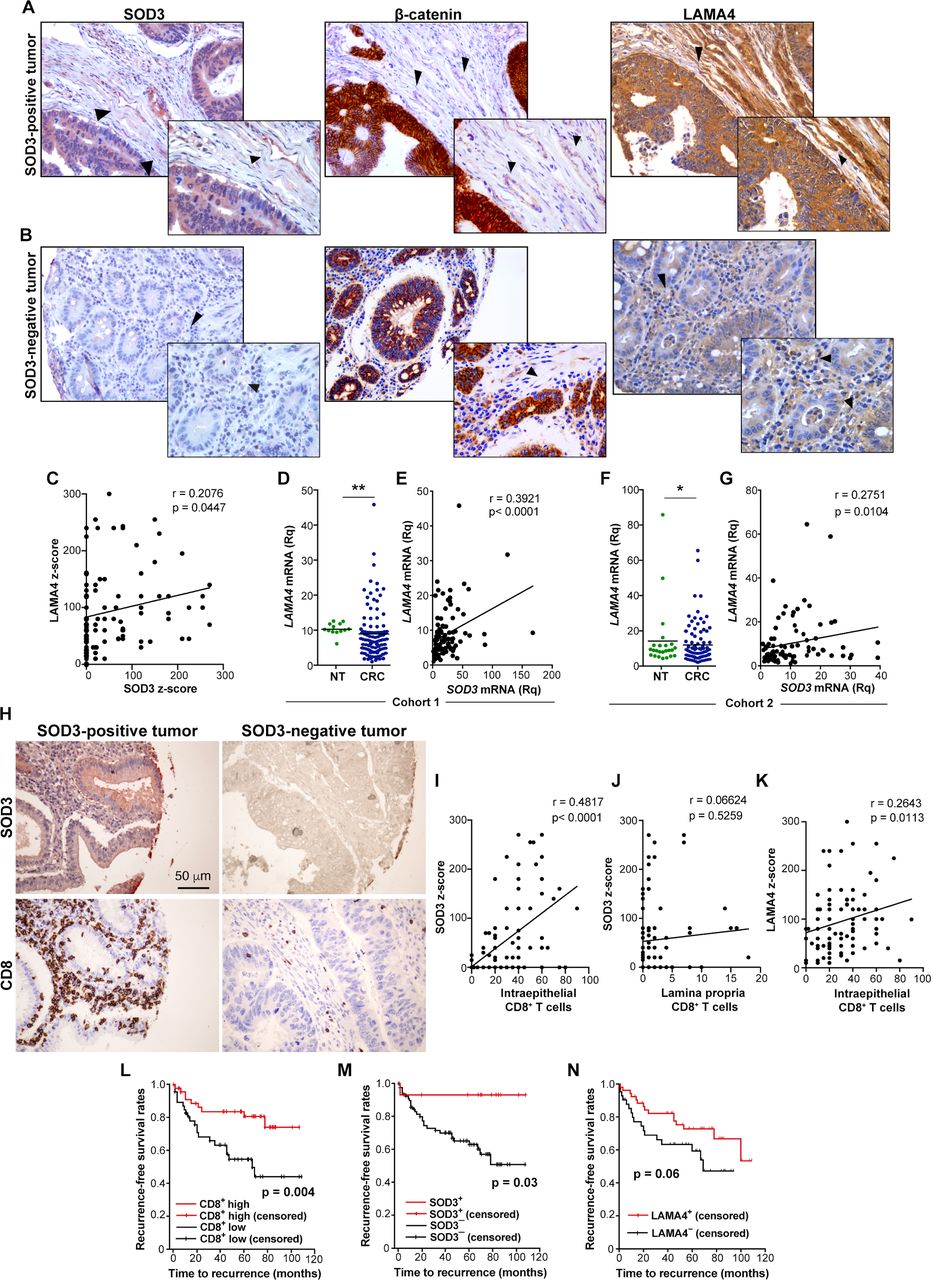
Although SOD3 is normally downregulated in CRC compared with healthy colon tissue,21 26 some tumors retain some SOD3 expression in the epithelial and stromal compartments. We determined the z-score43 for SOD3 staining in the TMA to classify tumors with negative (<140) or positive (>140) SOD3 expression, according to the cut-off obtained with a ROC curve. Immunohistochemical analyses showed that SOD3 positivity was associated to enhanced endothelial WNT signaling, using β-catenin as a readout, compared with SOD3− tumors (figure 7A,B). The percentage of β-catenin-stained EC was also higher in SOD3+ than in SOD3− tumors (n=94; p=0.04, Pearson’s χ2). β-catenin staining was usually intense in the epithelium and weak in the endothelium (figure 7A,B). Most tumors with high SOD3 levels showed intense β-catenin staining in the juxtamembrane region, but not in the nucleus of the tumor cells (figure 7A,B).
SOD3 associates with increased CD8+ TIL and recurrence-free survival in human colorectal cancer (CRC). (A, B) Representative images (×200; insets ×400) of tissue microarray (TMA) samples stained for SOD3, β-catenin, and LAMA4 in SOD3-positive (A) and SOD3-negative (B) tumors. Panoramic views of the TMA samples (×50) are provided in online supplementary figure S9. (C) Correlation of estimated z-scores for SOD3 and LAMA4 in images from (A) and (B). (D) Scatter plot showing individual data points and mean for LAMA4 mRNA levels in non-tumor (NT; n=13) and CRC samples (n=106) from cohort 1. (E) Correlation of SOD3 and LAMA4 mRNA levels in the CRC cohort 1. (F) Scatter plot as above for LAMA4 mRNA levels in the cohort 2 of 24 non-tumor and 90 CRC samples. (G) Correlation of SOD3 and LAMA4 mRNA levels in the CRC cohort 2. (H) Images of TMA samples stained for SOD3 and CD8, representative of SOD3-positive and negative tumors. (I, J) Correlation of estimated z-score for SOD3 and the number of CD8+ T cell in the epithelium (I) and the lamina propria (J). (K) Correlation of the LAMA4 z-score and the number of intraepithelial CD8+ TIL. (L–N) Kaplan-Meier curves for cumulative recurrence-free survival between patients with CRC based on intratumor CD8+ T cell counts (L), SOD3 positivity (M), or LAMA4 staining (N). The p value of the difference for each comparison was obtained using the log-rank test. (C, E, G, I, J, K) Pearson’s r correlation test; (D, F) *p<0.05, **p<0.01, two-tailed Student’s t-test.
Analysis of the TMA also showed increased LAMA4 staining in SOD3+ compared with SOD3− tumors (figure 7A). The association of SOD3 and LAMA4 staining involved both neoplastic and stromal cells. We found a median z-score value for LAMA4 of 85 (range 0–300). The ROC curve indicated a cut-off value of 70 to best discriminate sample weighing sensitivity and specificity; based on this value, 48.6% of the cases were negative for LAMA4 expression. We found a significant association between LAMA4+ and SOD3+ tumors (p=0.04, Pearson’s χ2), as well as a significant correlation between the z-scores for LAMA4 and SOD3 (figure 7C). In support of this association, LAMA4 mRNA was quantified in a cohort of 106 patients with CRC (stages I–IV) for which SOD3 mRNA was previously determined.21 In contrast to published data,44 we found that LAMA4 mRNA was downregulated in CRC compared with non-tumor samples (>10 cm from the primary tumor; figure 7D). In this cohort, we found a positive correlation between LAMA4 and SOD3 mRNA levels in CRC samples (figure 7E). Both downregulation of LAMA4 mRNA and correlation with SOD3 mRNA levels were further validated in a second cohort comprising 90 CRC stage III and 24 non-tumor samples (figure 7F,G). These results support a role for SOD3 in the transcriptional regulation of LAMA4.
In the stage II CRC cohort, we observed a clear association between SOD3 positivity and CD8+ T cell density (figure 7H; online supplementary figure S8). The average number of intraepithelial CD8+ T cells differed between SOD3-positive and SOD3-negative tumors (48.57 and 26.74, respectively; p<0.0001, two-tailed Student’s t-test). There was also a significant correlation between SOD3 z-score and intraepithelial CD8+ T cell counts (figure 7I), but not with CD8+ T cell density in the colon lamina propria (figure 7J), which suggests a specific role for SOD3 in intratumor T cell infiltration. The LAMA4 z-score also correlated with intraepithelial CD8+ TIL counts (figure 7K), suggesting a correlation between LAMA4 induction and effector T cell infiltration. To validate this observation, we correlated SOD3 mRNA levels with a T cell inflammatory signature28 in 382 CRC tumor samples from the TCGA. Mean SOD3 expression values were increased in CRC samples with high versus low T cell infiltration (10.17 vs 9.61; p=0.23×10⁻³), with a correlation coefficient of 0.19.
In accordance with published data,45 our stage II CRC cohort also showed an association of high density of intraepithelial CD8+ T lymphocytes with less relapse rate (n=95; p=0.01, Pearson’s χ2; OR 0.3 for CD8 (95% CI 0.1 to 0.7), p=0.05) and with extended recurrence-free survival (figure 7L). Extended recurrence-free survival was also linked to SOD3 positivity (figure 7M), consistent with the SOD3/CD8+ TIL correlation (figure 7I). Of the 14 patients with SOD3+ tumors, only one showed recurrence during the follow-up period, whereas malignancy recurred in 29/80 patients from the SOD3− group (median time to recurrence 16 months; p=0.031, Pearson’s χ2; OR 0.14 (95% CI 0.02 to 0.98), p=0.06). High LAMA4 levels tended to be associated with reduced relapse rate (OR 0.6 (95% CI 0.3 to 1)) and extended relapse-free survival (figure 7N), consistent with its association to high CD8+ T cell density (figure 7K).
Discussion
Identification of the endothelial determinants that dictate the trafficking of specific immune cell subtypes into the TME are central to the development of effective immunotherapies. Our data suggest that SOD3 downmodulation in the TME, as occurs in many human cancers,23–26 constitutes an immune evasion mechanism that selectively hampers T lymphocyte infiltration into tumors. Reversion of this situation by SOD3 re-expression in the TME boosted infiltration of effector T cells (but not of Treg or myeloid cells) and improved immunotherapy after adoptive transfer of tumor-specific CD8+ T cells. SOD3 levels correlated positively with CD8+ TIL numbers and extended recurrence-free survival in a cohort of patients with primary stage II colorectal carcinoma. SOD3 might thus be part of a regulatory network conserved between murine and human tumors that controls intratumor T cell trafficking.
We propose that the SOD3 effect on TIL trafficking is intrinsic to the tumor-associated endothelium. In support of this idea, SOD3 overexpression in EC was sufficient to boost specific T cell transmigration in vitro, and TILs were reduced in SOD3-expressing tumors engrafted in HIF-2αEC-KO mice. Although these data imply an EC-autonomous effect, the source of SOD3 nonetheless seems irrelevant, as SOD3 overexpression in neoplastic cells or EC increased CD4+ and CD8+ TIL equally. In both models, SOD3 was accumulated near CD31+ structures, which could indicate a bias for SOD3 binding to extracellular matrix components of the endothelial BM. It is also remarkable that SOD3 did not increase CD4+ and CD8+ TIL in immunologically unboosted tumors (untreated LLC tumors). SOD3 would thus provide not an instructive but rather a permissive signal in the tumor endothelium for transmigration of effector T cells.
Our mouse and cell models pinpoint activation of a SOD3-induced, HIF-2α-dependent WNT pathway in EC as central to the enhanced transendothelial T cell migration. Blockade of the WNT pathway or deletion of HIF-2α in EC reduced both SOD3 enhancement of T cell transmigration in vitro and TIL density in SOD3-expressing tumors. SOD3/HIF-2α appears to trigger WNT activation through the autocrine secretion of specific WNT ligands. HIF-2α also transactivates the WISP2 promoter in human EC,37 which suggests a common regulatory mechanism in humans. Analyses in human CRC support this hypothesis, as SOD3 levels correlated with the percentage of β-catenin-stained EC.
Consistent with SOD3-induced WNT pathway activation, β-catenin protein levels were higher in 1G11-SOD3 than in 1G11-mock cells. Nevertheless, β-catenin stabilization in 1G11-SOD3 cells did not induce its massive nuclear translocation or a full canonical WNT/β-catenin transcription program. In EC, SOD3 overexpression increased FoxM1—another WNT target—but not β-catenin nuclear accumulation; this differs from reports for transformed cells in which β-catenin translocates to the nucleus after binding to FoxM1.46 We propose that β-catenin is sequestered in the junctional contacts between EC by VEC, which is also upregulated by SOD3/HIF-2α.21 High VEC levels in 1G11-SOD3 would act similarly to E-cadherin in other cell systems,47 that is, sequestering β-catenin in the membrane and preventing its nuclear translocation. VEC might be a central regulator to the outcome of WNT activation in the endothelium, in a clear parallel to E-cadherin function in epithelial cells.48 Activation of the canonical WNT/β-catenin pathway is associated to TIL exclusion in several human cancers,5 but in CRC this occurs only in tumors with nuclear β-catenin accumulation.28 In our stage II CRC cohort, high SOD3 levels usually coincided with strong β-catenin staining in tumor cells, but it was largely excluded from the nucleus (figure 7A). SOD3 might boost TIL entry only in those tumors that have intact cytosolic β-catenin retention mechanisms in neoplastic and endothelial cells, thus preventing β-catenin signaling.48
Whereas SOD3/HIF-2α-induced VEC upregulation and β-catenin stabilization fit well with the reduction of tumor vessel leakage associated with SOD3 overexpression,21 it is intriguing that stabilization of the vascular adherens junctions matches increased transendothelial T cell migration. Redistribution and stabilization of VEC at the cell–cell junctions is one of the mechanisms by which LAMA5 restricts paracellular transmigration of leukocytes.20 Transient release of VEC, p120, and β-catenin interactions to allow transmigration is nonetheless regulated by a complex network of phosphatases, kinases, and adherens junction components.49 Moreover, leukocyte extravasation and vascular permeability are controlled by phosphorylation in specific tyrosine residues of VEC.50 Future research should determine whether EC binding to a LAMA4-enriched BM triggers a VEC phosphorylation pattern compatible with transendothelial migration while maintaining reduced leakage. As an alternative, SOD3 might bias transcellular over paracellular T cell diapedesis, as reported in some circumstances.51
Our results suggest that the endothelial SOD3/HIF-2α/WNT pathway selectively boosts T cell transmigration through the induction of LAMA4 expression. LAMA4 silencing impaired T cell transmigration through 1G11-SOD3 monolayers, whereas LAMA4 supplementation increased transmigration through 1G11-mock cells. In vivo LAMA4 protein levels correlated positively with TIL density after SOD3 overexpression, but negatively after endothelial HIF-2α deletion or WNT pathway inhibition; this SOD3/LAMA4 association was also observed in three CRC cohorts.
The precise mechanism by which SOD3 boosts specific T cell entry merits, however, further research. The initial concept of a differential effect of LAMA4 and LAMA5 on T cell transmigration17 is not supported by inflammatory mouse models, in which T cells, neutrophils, and monocytes extravasate preferentially at LAMA5-low sites.18 19 52 53 It therefore seems that the LAMA4/LAMA5 balance is not the main cause of selective extravasation/exclusion of T cells. The G domains of both LAMA4 and LAMA5 act as ligands for T cell integrins such as α6β1.54 However, neither the specificity pattern of laminin–integrin interactions nor the integrin expression pattern in leukocyte subsets comprehensibly explain specific transmigration of effector T cells into tumors. The idea that SOD3 boosts T cell infiltration through the upregulation of CXCR3 ligands, proposed to be dominant for T cell infiltration into tumors,9 does not match well with all data; although CXCL9 was associated with increased TIL infiltration in the LLC tumor model, this was not general to other tumor models. Moreover, SOD3 enhanced T cell transmigration in vitro without CXCR3 ligand induction. We propose that TIL specificity is achieved by the combination of different signals. On the one hand, LAMA4 might provide a permissive signal used by T cells and perhaps by other leukocytes to enter tumors. This initial signal, with the associated immune response to the tumor cells, would cause on the other hand upregulation of an instructive signal (CXCR3 ligands or another T cell chemoattractant), establishing a feed-forward loop that further enhances selective tumor infiltration by effector T cells.
SOD3 levels were associated with enhanced TIL numbers in a small cohort of patients with stage II CRC and with a T cell inflammatory signature in CRC samples from the TCGA. SOD3 positivity was also associated with lower recurrence rates in our CRC cohort, although caution should be exercised due to the small sample size. TIL density has prognostic value for clinical stratification of patients with CRC,1 55 including those in stage II,45 as was also observed in our stage II cohort. The SOD3 effect on recurrence-free survival is thus consistent with a SOD3-induced increase in intraepithelial CD8+ TIL in these tumors. High LAMA4 levels also correlated with enhanced CD8+ T cell counts and reduced recurrence rates, but the association of LAMA4 positivity with these clinical parameters was less marked than that for SOD3. The relationship of LAMA4 expression with CRC outcome is inconsistent; whereas one study found a negative association with overall survival in advanced CRC,56 another did not.44 LAMA4 induces proliferation and migration in some cancer cell types,57 and our IHC analyses showed that LAMA4 was also abundant in cancer cells and their underlying BM. It is possible that the LAMA4 anti-tumor signal associated to TIL entry could be counteracted by its pro-tumor activity in the neoplastic cells.
Our study raises new questions that deserve future research. Given the compensatory expression of LAMA4 and LAMA5,15 it would be interesting to determine whether SOD3 levels also downregulate LAMA5 expression in the tumor vasculature. This is particularly relevant, since LAMA4/LAMA5 balance is a molecular switch that drives immunity or tolerance in allograft transplants.18 In the therapeutic sphere, it is needed to identify treatments that increase SOD3 levels in established tumors. Some statins upregulate SOD3 gene expression (21 30 and this report), but these drugs might have immunomodulatory effects incompatible with robust immunotherapeutic regimens.58 It remains to be explored how SOD3 potentiates other immunotherapies, including immune checkpoint blockers or vaccination, in addition to its synergism with adoptive T cell transfer reported here. Finally, the contrasting tumor-specific and EC-specific WNT activities on TIL entry determined here reveals an intricate network by which this pathway regulates immune function in the TME and also might allow the design of WNT-based immunotherapeutic strategies by targeting WNT inhibitors to specific tumor compartments.
Conclusion
Our results identify the perivascular activity of the anti-oxidant enzyme SOD3 as a permissive signal for selective infiltration of effector T cells into the TME, both in murine and in human tumors. This SOD3 effect relies on HIF-2α-induced WNT pathway activation in EC, which modifies the endothelial BM by inducing LAMA4, known to be involved in the maturation and structural integrity of microvessels.17 18 Our results identify a cell type–specific function of the WNT pathway in intratumor T cell infiltration and also highlight the endothelial BM, and particularly LAMA4 levels in this BM, as a potential target for effective boosting of anti-tumor immune responses.
Acknowledgments
We thank T D Oury (University of Pittsburgh), S Martín-Puig and M Torres (Centro Nacional de Investigaciones Cardiovasculares), and A Chenn for reagents; RM Peregil (technical assistance), MC Moreno, and S Escudero (flow cytometry service) for technical help; and C Mark for excellent editorial assistance.
References
Footnotes
LC-R and DM-R contributed equally.
Contributors SM and EM conceived the study. LC-R, DM-R, and EM designed and performed most of the experiments. AG-M performed initial adoptive transfer experiments. NR-R performed adhesion assays. MP-C, BP-V, and ED-R provided samples. MES carried out bioinformatic analyses. MJF-A analyzed and quantified TMA. LC-R, DM-R, MJF-A, EM, and SM interpreted experimental data. SM wrote the manuscript. All authors read and discussed the manuscript.
Funding This work was funded by grants from the Spanish Ministerio de Economía y Competitividad (MINECO) (SAF2017-83732-R to SM; AEI/FEDER, EU) and the Comunidad de Madrid (B2017/BMD-3733; Inmunothercan-CM, to SM, MJF-A, and BP-V). LC-R was partially supported by the Fundación CRIS Contra el Cáncer; DM-R is supported by a predoctoral fellowship from the Spanish Ministry of Science, Innovation and Universities and the EU European Social Fund (PRE2018-084023).
Competing interests None declared.
Patient consent for publication Not required.
Ethics approval The research presented here with human samples has been approved by Ethical Review Boards from the Hospital Fundación Jiménez Díaz and the Hospital Clínico San Carlos, Spain. Mouse experiments were approved by the Comunidad de Madrid (PROEX 399/15) and the CNB Ethics Committees in strict accordance with the Spanish and European Union laws and regulations concerning care and use of laboratory animals.
Provenance and peer review Not commissioned; externally peer reviewed.
Data availability statement All data relevant to the study are included in the article or uploaded as online supplementary information. Data and materials are available from the corresponding author on reasonable request. Materials obtained from third partners might require additional transfer agreements.