Article Text

Abstract
Background Increasing evidence has elucidated the clinical significance of tumor infiltrating immune cells in predicting outcomes and therapeutic efficacy. In this study, we comprehensively analyze the tumor microenvironment (TME) immune cell infiltrations in clear cell renal cell carcinoma (ccRCC) and correlated the infiltration patterns with anti-tumor immunity and clinical outcomes.
Methods We analyzed immune cell infiltrations in four independent cohorts, including the KIRC cohort of 533 patients, the Zhongshan ccRCC cohorts of 259 patients, the Zhongshan fresh tumor sample cohorts of 20 patients and the Zhongshan metastatic ccRCC cohorts of 87 patients. Intrinsic patterns of immune cell infiltrations were evaluated for associations with clinicopathological characteristics, underlying biological pathways, genetic changes, oncological outcomes and treatment responses.
Results Unsupervised clustering of tumor infiltrating immune cells identified two microenvironment subtypes, TMEcluster-A and TMEcluster-B. Gene markers and biological pathways referring to immune evasion were upregulated in TMEcluster-B. TMEcluster-B associated with poor overall survival (p<0.001; HR 2.629) and recurrence free survival (p=0.012; HR 1.870) in ccRCC validation cohort. TMEcluster-B cases had worse treatment response (p=0.009), overall survival (p<0.001; HR 2.223) and progression free survival (p=0.015; HR 2.7762) in metastatic ccRCC cohort. The predictive accuracy of International Metastatic Database Consortium risk score was improved after incorporation of TME clusters.
Conclusions TMEcluster-A featured increased mast cells infiltration, prolonged survival and better treatment response. TMEcluster-B was a heavily infiltrated but immunosuppressed phenotype enriched for macrophages, CD4+ T cells, Tregs, CD8+ T cells and B cells. TMEcluster-B predicted dismal survival and worse treatment response in clear cell renal cell carcinoma patients.
- urology
- oncology
- immunology
This is an open access article distributed in accordance with the Creative Commons Attribution Non Commercial (CC BY-NC 4.0) license, which permits others to distribute, remix, adapt, build upon this work non-commercially, and license their derivative works on different terms, provided the original work is properly cited, appropriate credit is given, any changes made indicated, and the use is non-commercial. See http://creativecommons.org/licenses/by-nc/4.0/.
Statistics from Altmetric.com
Introduction
Renal cell carcinoma (RCC) afflicts around 300,000 individuals worldwide and leads to over 100,000 deaths annually.1 Clear cell renal cell carcinoma (ccRCC) is the most common and lethal histological subtype.2 It features an increased immune signature and high immune infiltration.3 Interactions between tumor infiltrating immune cells and cancer cells in tumor microenvironment (TME) are critical to cancer progression.4 Tumor infiltrating cells can demonstrate pro-tumor or anti-tumor effects depending on cancer types. In ccRCC, CD8+ T cells,5 Tregs,5 macrophages5 and neutrophils6 are associated with dismal prognosis while mast cells7 are associated with prolonged survival.
Up to 25% localized RCC patients would develop metastasis with dismal outcomes after curative nephrectomy.8 The advent of targeted therapies especially tyrosine kinase inhibitors (TKIs) has been a major breakthrough in metastatic RCC, which exerted therapeutic effect on metastatic renal cell carcinoma (mRCC) by antagonizing the vascular endothelial growth factor (VEGF) receptor.9 Unfortunately, many patients display intrinsic resistance or develop resistance sometime after treatment.10 Several molecular mechanisms for resistance are proposed including immune escape.9 Recently, researchers identified increased macrophage infiltration and a more immunosuppressed TME in molecular subgroups resistant to TKIs treatment, which further confirmed the impact of tumor infiltrating immune cells on TKI resistance.11
Therefore, there is great interest in understanding the immune microenvironment of ccRCC. The comprehensive landscape of immune cells infiltrating TME and its impact on prognosis as well as TKI treatment response have not been elucidated. In this study, we demonstrated the intrinsic patterns of TME infiltrations and systematically correlated TME clusters with underlying biological processes, genetic characteristics, prognosis and response to TKI treatments.
Materials and methods
Clinical cohorts
TCGA KIRC cohort. For TCGA KIRC cohort, data were abstracted from 533 patients with both RNA-seq data and clinical information in TCGA kidney clear cell renal cell carcinoma (KIRC) cohort. Clinical data were downloaded from cBioPortal12 and the TCGA Pan-cancer Clinical Data Resource, a database that provides processed high-quality clinical data.13 RNA-seq data were downloaded from the UCSC Xena. Mutational and arm somatic copy number alteration (SCNA) data were obtained from cBioPortal.
Zhongshan ccRCC cohort. The Zhongshan ccRCC cohort included patients with ccRCC who underwent nephrectomy at Zhongshan Hospital between January 2005 to June 2007. Data were censored until June 2017. Inclusion criteria were patients with pathologically proven ccRCC treated with nephrectomy and with available Formalin Fixed Paraffin Embedded (FFPE) specimens. Exclusion criteria were neoadjuvant or adjuvant systemic therapy, synchronous or metachronous bilateral RCC or histories of other malignant tumors. A total of 249 patients were included for further analyses.
Zhongshan fresh tumor sample cohort. Fresh tumor samples in the Zhongshan fresh tumor sample cohort were collected from 20 ccRCC patients between October 2017 and November 2018. The same inclusion and exclusion criteria of Zhongshan ccRCC cohort were applied, except that fresh tumor sample cohort did not need FFPE specimen.
Zhongshan metastatic ccRCC cohort. We retrospectively enrolled a cohort of 87 pathologically proved metastatic ccRCC patients treated with first-line sunitinib or sorafenib between March 2005 and June 2014 as the Zhongshan metastatic ccRCC cohort. The last follow-up time was January 2015. For inclusion criteria, patients had to have developed metastases, received sunitinib or sorafenib as first-line treatment in the metastatic setting, undergone their first CT scan assessment and processed available FFPE specimen. Exclusion criteria were the same as previously described. Response to treatment was assessed with RECIST 1.1.14
Computational analysis of immune cell infiltration, microarray and RNA-Seq data
Immune cell compositions and pathway analysis. We evaluated the absolute and relative cell fractions of major types of tumor infiltrating immune cells with CIBERORT, a computational approach for inferring leukocyte representation in bulk tumor transcriptomes.15 Single sample Gene Set Enrichment analysis (ssGSEA) was chosen for immune deconvolution analyses of Immune Score16 and immune suppression score.17 Comparison of gene expression profiles were carried out with Gene Ontology (GO) analysis and Gene Set Enrichment Analysis (GSEA).18
Clustering and classifier construction. Unsupervised hierarchical clustering of normalized immune cell fractions with K-median identified the intrinsic pattern of immune cell infiltration, TMEcluster-A and TMEcluster-B. The optimal number of clusters was determined by Nbclust testing. To develop a robust immune cell composition classifier for assessing TME subtype, we applied prediction analysis for microarray (PAM),19 a centroid-based classification algorithm. PAM was widely used because of its reproducibility in subtype classification compared with other centroid-based prediction method.20 For example, the establishment of the well-recognized simplified version of ccA/ccB gene signature, ClearCode 34, was based on PAM.21 The Zhongshan ccRCC cohort, fresh tumor sample cohort and metastatic ccRCC cohort were classified into TMEcluster-A and TMEcluster-B with normalized immune cell densities obtained from immunohistochemistry using PAM model in this study.
Immunohistochemistry and flow-cytometry for clinical samples
Immunohistochemistry. We performed immunohistochemistry on Zhongshan ccRCC cohort, fresh tumor sample cohort and metastatic ccRCC cohort to evaluate infiltrations of macrophages (CD68, clone KP1, Dako), CD4+ T cells (CD4, ab213215, Abcam), Tregs (FOXP3, ab22510, Abcam), CD8+ T cells (CD8, clone C8/144B, Dako), B cells (CD19, ab31947, Abcam) and mast cells (tryptase, ab134932, Abcam) for further subtype classification with PAM model. SETD2 was stained with primary anti-SETD2 (HPA04245, Sigma-Aldrich Corp) antibody. The densities of each type of immune cells were evaluated in two representative areas at ×200 magnification. The mean value was adopted, changed into density as cells/mm2 and normalized. The PAM model was performed with normalized densities of each immune cell type in all three Zhongshan validation cohorts to assign the TME clusters. Two independent shots of SETD2 expression with the strongest staining at ×200 magnification were recorded and evaluated via the semi-quantitative immunoreactivity score (IRS) algorithm.
Flow cytometry. Cell suspensions were stained with fluorochrome-labeled antibodies specific for human CD3 (344 818 Biolegend), CD8 (301 006 Biolegend), PD1 (560 795 BD), CTLA4 (369610, Biolegend), TIM3 (345032, Biolegend) and TIGIT (372710, Biolegend). Cell suspensions were collected from tumors in Zhongshan fresh tumor sample cohort. We analyzed the stained cells on a flow cytometer using Flowjo software.22
Statistical analysis
Differences in continuous variables between two groups were analyzed by Student’s t-test or t’-test according to Levene’s test. Pearson’s χ2 test, Cochran-Mantel-Haenszel χ2 test or Fisher’s exact test were used for categorical variables. Survival analyses were carried out with Kaplan-Meier method and Cox proportional hazards regression model. All statistical tests were two-sided and statistical significance was set at p<0.05. For TCGA KIRC cohort and Zhongshan ccRCC cohort, overall survival (OS) was defined as the length of time from the data of diagnosis to date of death or last follow-up time. Recurrence free survival (RFS) was defined as time from surgery to loss of follow-up or deaths from other causes without recurrence. Disease specific survival (DSS) was censored at deaths from ccRCC. Metastatic ccRCC patients were excluded from RFS analysis in both KIRC and Zhongshan ccRCC cohort. Overall survival was calculated from the time of therapy initiation to the time of death or last follow-up. Progression free survival (PFS) was defined as the time from therapy initiation to the time of disease progression or the last follow-up time. Four patients were excluded from PFS analysis for lack of progression information. Prognostic capabilities of different risk models were compared using time dependent receiver operating characteristic (ROC) analysis and Harrell’s concordance index (C-index).The R package ‘limma’ was used for analysis of differentially expressed genes. Statistical analyses were carried out with SPSS Statistics 21.0 and R software 3.51.
Results
Immune landscape in ccRCC and clinical characteristics of TME clusters
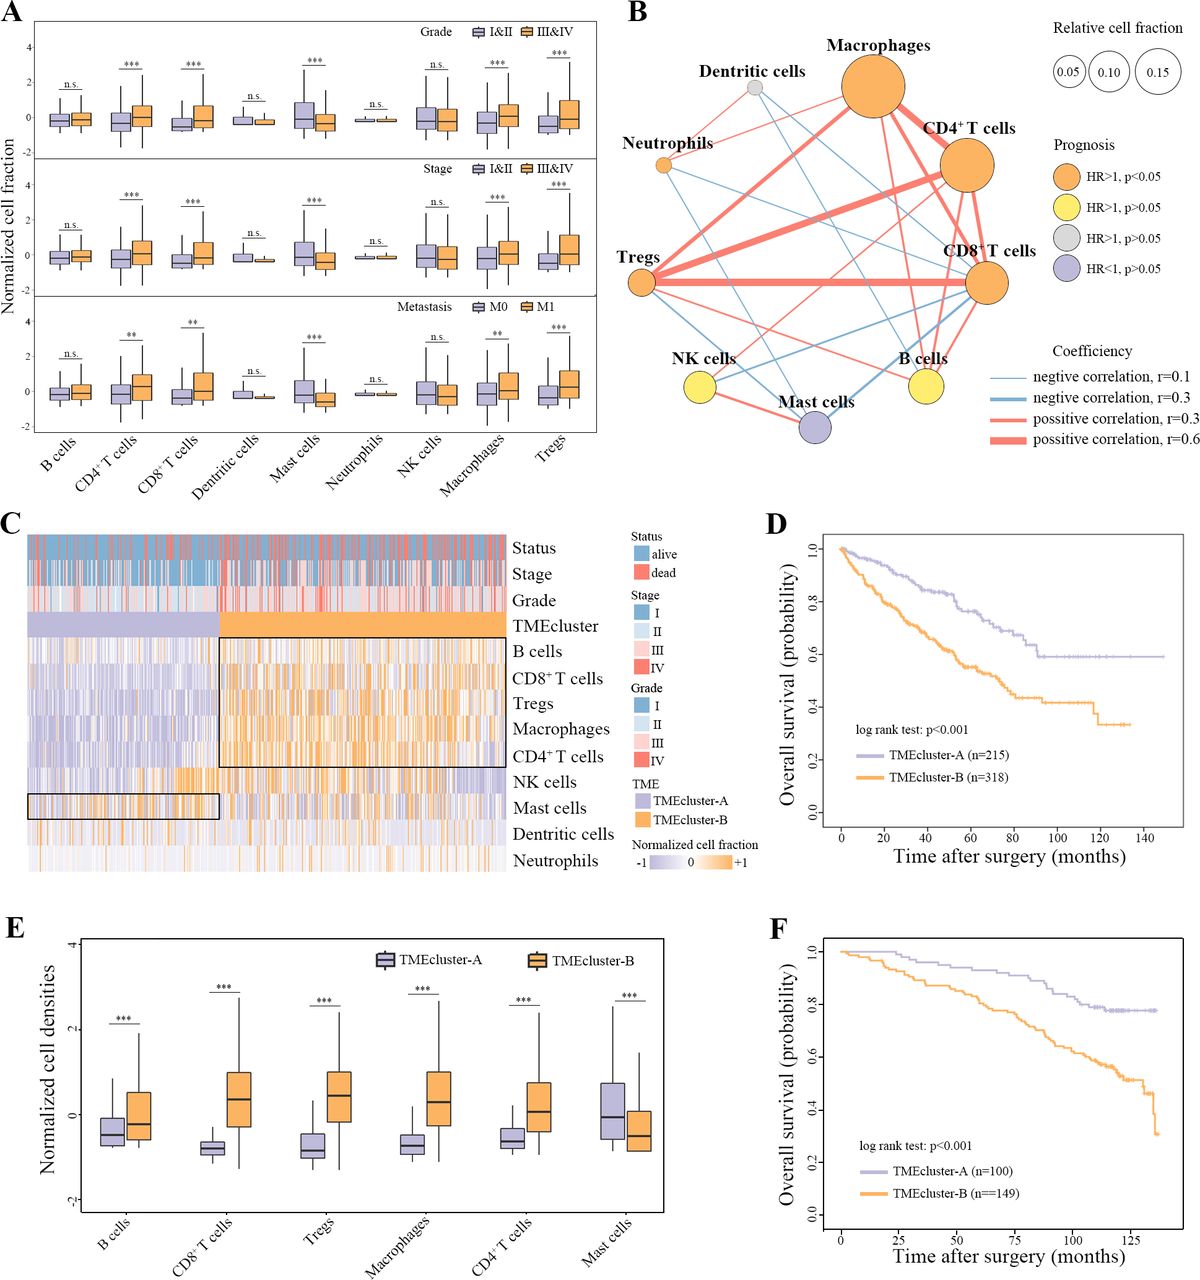
Analyses of major immune cell composition in KIRC cohort revealed that CD4+ T cells, CD8+ T cells, macrophages and Tregs increased while mast cells decreased with disease progression (Figure 1A, online supplementary figure 1A). The TME cell network demonstrated that macrophages, CD4+ T cells, CD8+ T cells, Tregs and B cells were positively correlated with each other. Moreover, macrophages, CD4+ T cells, CD8+ T cells, Tregs and neutrophils associated with shortened OS while mast cells associated with prolonged OS (Figure 1B, online supplementary table 1). Unsupervised hierarchical clustering of normalized immune cell fractions was performed and two major TME clusters with different clinical characteristics were identified (Figure 1C, online supplementary table 2). TMEcluster-A exhibited higher infiltration of mast cells. TMEcluster-B was characterized by increases in the infiltration of B cells, CD8+ T cells, Tregs, Macrophages and CD4+ T cells. TMEcluster-B correlated with higher stages and grades. The two TME subtypes showed significant differences in OS (p<0.001; HR 2.162, 95% CI: 1.546 to 3.023), RFS (p<0.001; HR 2.018, 95% CI: 1.373 to 2.967) and DSS (p<0.001; HR 2.907, 95% CI: 1.834 to 4.609) (Figure 1D, online supplementary figure 1B,C). After adjustment of stage and grade as binary variables, TME clusters remained an independent risk factor for OS (HR 1.482, 95% CI: 1.048 to 2.095, p=0.026).
Supplemental material
Supplemental material
Supplemental material
Prognostic value of TME clusters in the validation cohort
Immune cell infiltrations in the KIRC cohort were taken as the training set in the PAM model. Macrophages, CD4+ T cells, Tregs, CD8+ T cells and B cells were extracted as phenotype signatures of TMEcluster-B while mast cells were extracted as phenotype signatures of TMEcluster-A (online supplementary figure 2A). We performed immunohistochemistry in Zhongshan RCC cohort to quantify densities of the phenotype signature immune cells (online supplementary figure 2B, online supplementary table 3). Applying the classifier to normalized immune cell density in Zhongshan ccRCC cohort, 100 samples were assigned as TMEcluster-A and 149 as TMEcluster-B. There were increased B cells, CD8+ T cells, Tregs, macrophages, CD4+ T cells and reduced mast cells in TMEcluster-B (Figure 1E, online supplementary figure 1D). TMEcluster-B associated with higher tumor stage (p=0.036) but not tumor grades (p=0.202) (online supplementary figure 1E), and experienced recurrence more frequently (p=0.012; HR 1.870, 95% CI: 1.141 to 3.066) (online supplementary figure 1F). TMEcluster-B cases had higher risk of overall mortality compared with TMEcluster-A (p<0.001; HR 2.629, 95% CI: 1.630 to 4.241) (figure 1F). In addition, overall deaths (HR 2.304, 95% CI: 1.401 to 3.790, p<0.001) remained significant between clusters after adjustment of stage, grade, Eastern Cooperative Oncology Group Performance Status (ECOG PS) and necrosis (online supplementary table 4).
Supplemental material
Supplemental material
Supplemental material

Immune landscape in ccRCC and prognostic value of TME clusters. (A) Immune landscape of major immune cell types in clear cell renal cell carcinoma (ccRCC). (B) Cellular interactions and prognostic values of tumor microenvironment cell types. The color of each cell type represents the survival impact and the color of each cell represents relative cell fractions. The lines connecting each cell type represent cellular interactions, red for positive correlation and blue for negative correlation. The thickness of the line represents coefficients calculated by Spearman correlation analysis. (C) Unsupervised clustering of TME cells for 533 patients in the KIRC cohort. TME clusters, survival status, TNM stage and tumor nucleus grade are shown as annotations. (D) Kaplan-Meier curves for overall survival in KIRC cohort. (E) Normalized densities of phenotype signature cell types in Zhongshan RCC cohort. (F) Kaplan-Meier curves for overall survival in Zhongshan RCC cohort. **p<0.01, ***p<0.001. RCC,renal cell carcinoma; TME, tumormicroenvironment.
Highly immune infiltrated but immunosuppressed microenvironment in TMEcluster-B
We noticed that there were plenty of immune-related genes among the top 50 upregulated genes in TMEcluster-B in KIRC cohort, such as genes encoding components of CD8+ T receptor (CD8A, CD8B, CD27, CD3D), related to cytotoxic activities mediated by CD8+ T (IFNG, GZMK), suggesting a cytokine-rich microenvironment (CXCR3, IL20RB, CXCL13, CCL19) and associated with immune suppression (FOXP3, TGFB1, PDCD1, CTLA4, LAG3, TIGIT) (figure 2A). GO analysis of the most upregulated 200 genes in TMEcluster-B revealed enrichment of both pathways of immune activation and immune suppression among the 10 most significantly enriched biological pathways (figure 2B). GSEA analyses revealed that a large part of upregulated pathways were associated with immune parameters in classic pathway database REACTOME, BIOCARTA and KEGG (figure 2C). In particular, pathways representing immune evasion were upregulated in each of the database, including CTLA4 inhibitory signaling, immunoregulatory interactions between a lymphoid and a non-lymphoid cell, IL10 pathway and TGF-β signaling pathway (figure 2D). Using ESTIMATE,16 we found that TMEcluster-B had higher Immune Score (p<0.001), a marker of total immune infiltration (figure 2E). Immune deconvolution analysis via ssGSEA showed TMEcluster-B had higher immune suppression (p<0.001) score17 (figure 2F). T cell exhaustion markers unanimously increased in TMEcluster-B (online supplementary figure 3A). On the contrary, CD8 T cell/Treg ratio (p<0.001)3 and GZMB/CD8A ratio (p<0.001),23 ratio markers of anti-tumor immunity, significantly decreased in TMEcluster-B (online supplementary figure 3B,C). Our findings suggested a highly immune infiltrated but immunosuppressed tumor microenvironment in TMEcluster-B. We performed flow cytometry in Zhongshan fresh ccRCC cohort and observed higher expression of exhaustion markers on CD8+ T cells in TMEcluster-B including PD-1 (p=0.017), CTLA-4 (p=0.116) and TIM-3 (p=0.005) as expected (Figure 2G, online supplementary figure 2C). There were higher percentage of PD1+CD8+T cells (p=0.007), CTLA4+CD8+T cells (p=0.021) and TIM3+CD8+ T cells (p=0.004) in TMEcluster-B (online supplementary figure 2D).
Supplemental material

Highly immune infiltrated but immunosuppressed microenvironment in TMEcluster-B. (A) Volcano plots of differentially expressed genes between TMEcluster-A and TMEcluster-B. (B) Gene ontology (GO) analysis of top 200 differentially expressed genes between TME clusters. (C) Gene set enrichment analysis (GSEA) (REACTOME, BIOCARTA and KEGG) pathway distribution for TMEcluster-A versus TMEcluster-B. (D) Immunosuppressive GSEA pathways upregulated in TMEcluster-B. (E) Immune score estimated by single sample GSEA (ssGSEA) in TMEcluster-A and TMEcluster-B. (F) Immune suppression score estimated by ssGSEA in TMEcluster-A and TMEcluster-B. (H) Flow cytometry detection of PD-1, CTLA-4 and TIM-3 expression on CD8+ T cells in TMEcluster-A and TMEcluster-B. *p<0.05, **p<0.01, ***p<0.001. TME,tumor microenvironment.
Genetic characterization of TME clusters
Next, we explored differences in the frequency of mutations in common ccRCC cancer driver genes between the two clusters. Somatic SETD2 mutations were more frequent in TMEcluster-B with borderline statistical significance (p=0.054) (figure 3A). Low SETD2 protein expression previously demonstrated poor prognostic effects among TKI treated ccRCC patients.24 We analyzed SETD2 expression in Zhongshan metastatic ccRCC cohort and found that tumors in TMEcluster-B had lower SETD2 expression (p=0.027) (Figure 3B, online supplementary figure 2E). TMEcluster-B had lower overall tumor mutation burden compared with TMEcluster-A (p=0.008) (figure 3A), in accordance with a previous study showing that most immune signatures were upregulated in low-TMB subtype in ccRCC.25 We then analyzed the associations between TME clusters and prevalent arm level SCNAs (present in over 10% patients) with poor prognosis in a previous study.26 The heatmap showed that amplifications of 8q, 12, 20 and deletions of 9 p, 14q were enriched in TMEcluster-B. Total number of poor prognosis SCNAs (amplifications of 8q, 12, 20 and deletions of 4 p, 9 p, 14q, 19, 22q) was higher in TMEcluster-B as well (p<0.001) (figure 3A). TME clusters and ccA/ccB27 signature were positively correlated (p<0.001). Cell cycle proliferation score28 and 16-gene recurrence score,29 two well established molecular risk models, were both higher in TMEcluster-B (p<0.001 and p=0.055, respectively) (figure 3A).
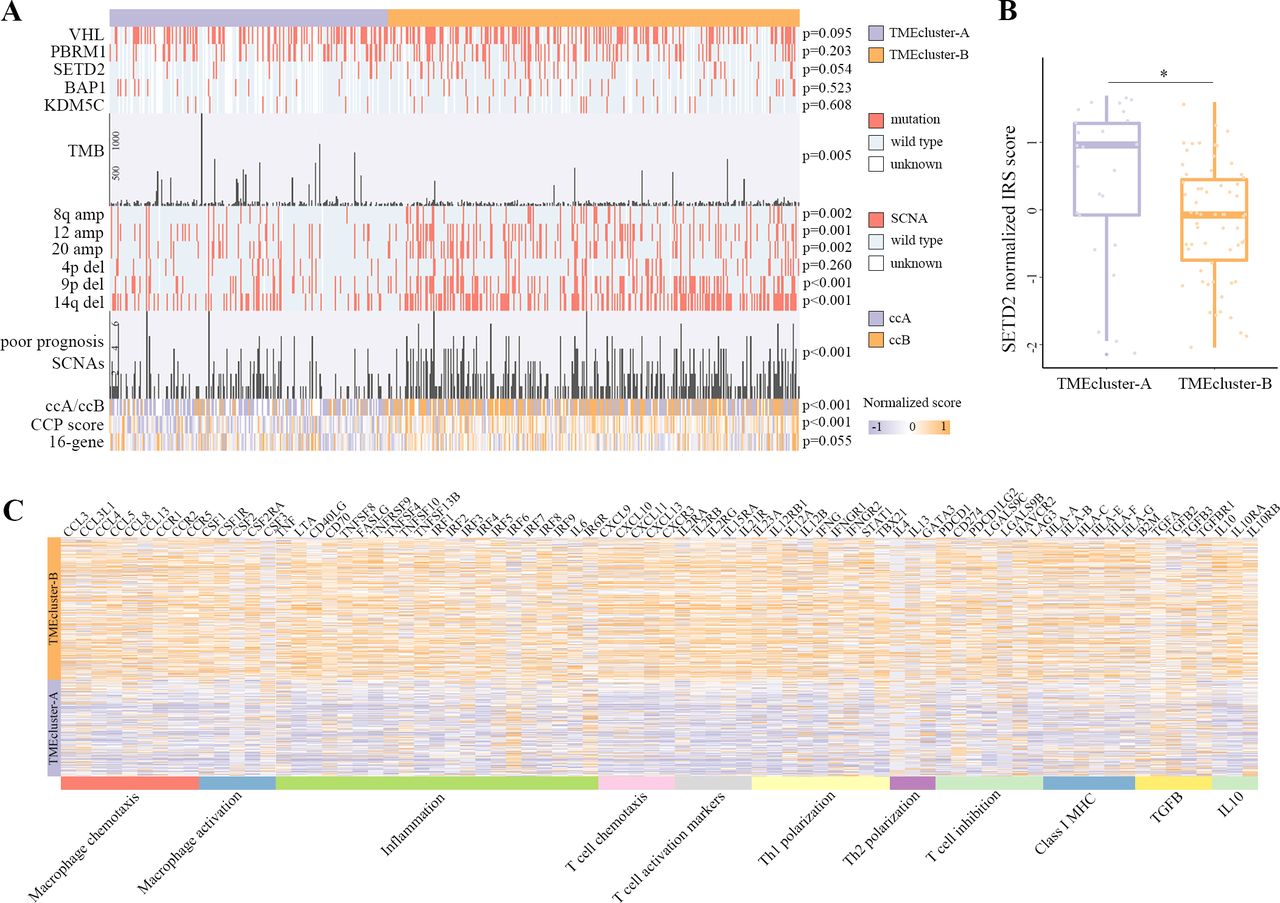
Genetic characterization and resemblance of TMEcluster-B to molecular subtypes resistant to TKI treatment. (A) Distribution of driver genes mutation, tumor mutation burden, arm somatic copy number alterations (SCNA) with poor prognosis, ccA/ccB subtype, cell cycle proliferation score and 16-gene signature in TMEcluster-A and TMEcluster-B. (B) SETD2 expression in TMEcluster-A and TMEcluster-B. (C) Heatmap displaying gene clusters of macrophage chemotaxis, macrophage activation, inflammation, T cell chemotaxis, T cell activation markers, Th1 polarization, Th2 polarization, T cell inhibition, ClassⅠMHC, TGFβ signaling and IL10 signaling in TME subtypes.*p<0.05. TKI,tyrosine kinase inhibitor; TME, tumormicroenvironment.
Resemblance of TMEcluster-B to molecular subtypes resistant to TKI treatment
Hakimi et al reported that TKI non-responders had higher macrophage infiltration.11 Macrophage infiltrations determined by CIBERSORT, immunohistochemistry and metagene value30 all elevated in TMEcluster-B (figure 1C and E, online supplementary figure 3D). Markers of macrophage chemotaxis and activation also increased in TMEcluster-B (figure 3C). They identified four distinct molecular subgroups in COMPARZ phase III patients significantly differed in response and survival, among which cluster 4 showed the worst TKI treatment response.11 Cluster 4 tumors had more frequent PD-L1 positivity and TMEcluster-B had higher PD-L1 mRNA expression (p<0.001) (online supplementary figure 3E). The hallmark inflammation signatures enriched in cluster 4 were upregulated in TMEcluster-B as well (online supplementary figure 3F). Another molecular subgroup with poor response to sunitinib, ccrcc4 identified by Beuselinck et al, was characterized by a strong inflammatory, Th1-orineted but suppressive immune microenvironment.31 TMEcluster-B displayed the same TME characterization as shown in heatmap (figure 3C).
Associations between TME clusters and TKI treatment response in mRCC patients
Our previous findings suggested a highly potential correlation between TME clusters and TKI treatment response. We further explored the correlation in Zhongshan metastatic ccRCC validation cohort and found that TMEcluster-B had significant worse treatment response compared with TMEcluster-A (p=0.009) (figure 4A). The objective response rate was 50.0% for TMEcluster-A and 16.9% for TMEcluster-B. Clinical benefit rate was 87.5% for TMEcluster-A and 78.0% for TMEcluster-B. Kaplan-Meier analysis and univariate analysis revealed that TMEcluster-B cases experienced earlier disease progression (p=0.015; HR 2.7762, 95% CI: 1.530 to 4.986) and overall death (p<0.001; HR 2.223, 95% CI: 1.150 to 4.229) (figure 4B,C). Utilizing IMDC risk scores alone predicted 2-year PFS and OS with an area under the curve (AUC) of 0.74 and 0.76, respectively. IMDC risk scores incorporating TME clusters reached an AUC of 0.80 and 0.82 for PFS and OS (figure 4D,E). Integration of IMDC variables and TME clusters improved the C-index for PFS from 0.61 to 0.66 and OS from 0.67 to 0.71 (figure 4F,G).

Associations between TME clusters and TKI treatment response in mRCC patients. (A) Distribution of tyrosine kinase inhibitor (TKI) treatment response in TMEcluster-A and TMEcluster-B. P values were estimated by χ2 test. (B) Kaplan-Meier curves for progression-free survival (PFS) in Zhongshan metastatic ccRCC cohort. (C) Kaplan-Meier curves for OS in Zhongshan metastatic ccRCC cohort. (D) ROC analysis for PFS at 2 years. (E) ROC analysis for OS at 2 years. (F) Predictive accuracy of IMDC risk score with the addition of TME clusters for PFS in terms of Harrell’s C-index. (G) Predictive accuracy of IMDC risk score with the addition of TME clusters for OS in terms of Harrell’s C-index. AUC,area under the curve; ccRCC, clear cell renal cell carcinoma; mRCC, metastatic renal cell carcinoma; OS, overall survival;PFS, progression free survival; ROC, receiveroperating characteristic; TME, tumor microenvironment.
Discussion
We report a comprehensive evaluation of tumor-intrinsic immune cell infiltrations in KIRC cohort and validate its predictive value for outcomes and treatment response in three independent Zhongshan ccRCC cohorts. The prognostic landscape of infiltrating immune cells displayed in our study was mostly in accordance with previous studies.5 In contrast to majority of tumors, high densities of CD8+ T cells associated with poor prognosis in ccRCC. The TME immune cell network (figure 1B) may partly explain this phenomenon. Patients with high CD8+ T cell infiltration also tend to have high densities of Tregs and macrophages. The anti-tumor effects of CD8+ T cells were offset by these immunosuppressive immune cells. In Zhongshan ccRCC validation cohort, TMEcluster-A associated with favorable prognosis in multivariate analysis, consistent with a previous study suggesting a positive correlation between mast cells infiltration and prolonged survival.7
To understand the biological mechanisms underlying TMEcluster-B, we performed various bioinformatics analyses and discovered upregulation of both immunosuppressive and immunostimulatory pathways in TMEcluster-B. Immune Score,16 a marker of total infiltration, were significantly higher in TMEcluster-B, which may contribute to the upregulation of immunostimulatory pathways. In addition, CD8/Treg3 and GZMB/CD8A,23 markers of immune activation that taking both immune evasion and stimulation into account, were both downregulated in TMEcluster-B, consistent with an immunosuppressed TME for which a poor outcome would be expected. Flow cytometry analyses further confirmed an immunosuppressed TME in TMEcluster-B with higher infiltrations of exhausted CD8+ T cells.
Critically, TME characterization of TMEcluster-B demonstrated notable overlap with cluster 4, a TKI resistant molecular subtype in a recent report by Hakimi et al.11 Cluster 4 tumors showed composite signatures of higher macrophage infiltrations, upregulation of hallmark inflammatory pathways and stronger PD-L1 expression, all of which were observed in TMEcluster-B. Further, TMEcluster-B was similar to ccrcc4 group identified by Beuselinck et al.31 (figure 3C). Ccrcc4 had poor treatment response to TKIs and exhibited a strong inflammatory, Th1-oriented but suppressive immune microenvironment. Notably, in cluster 4, ssGSEA scores of macrophages, T helper cells, CD8 T cells and B cells increased while mast cells decreased. In ccrcc4, metagene values for B cells, T cells and macrophages were elevated. In summary, both molecular subtypes resistant to TKI treatment displayed an immune-infiltrated but immunosuppressed TME, which is the same for TMEcluster-B we identified in our study with unsupervised clustering of immune cell infiltrations. Besides, TMEcluster-B had lower SETD2 expression, another TKI resistant characteristic.24 These insight into the role of TME clusters suggested that immune cell composition might be relevant for cancer management. Thus we analyzed the associations between TME clusters and TKI treatment response in the Zhongshan metastatic ccRCC cohort. TMEcluster-B tumors were more resistant to TKI treatment response and conferred with shorter PFS and OS. Accumulating evidence suggests that targeted agents could alter the immune contexture of tumor, such as stimulating T cell or Natural Killer (NK) cell mediated anticancer immune responses, depleting numbers of infiltrating MDSCs, etc.5 Immune evasion in TMEcluster-B might contribute to TKI resistance by eliminating the immunostimulatory functions of TKIs.
A high number of tumor mutations are expected to drive tumor immune-infiltration. However, we found higher TMB in the more immune-infiltrated subtype, TMEcluster-B, in accordance with a previous study showing that most immune signatures were upregulated in low-TMB subtype in ccRCC,25 which is different from other immunotherapy responsive solid tumors. High TMB has been identified as a predictive biomarker for immunotherapy,32 our findings also suggested a potential link between TMB and TKI treatment response in ccRCC.
There were some major limitations in our study. First, this is a retrospective study in nature. Furthermore, the metastatic ccRCC cohort were small, despite these small validation cohorts still reached the consistent conclusion with statistical significance. Third, ccRCC demonstrated significant intra-tumor heterogeneity, which made it necessary to analyze regional differences.
Conclusion
In conclusion, we identified two TME subtypes based on clustering of immune cell infiltrations. TMEcluster-B was characterized by a dominance of macrophages, CD4+ T cells, Tregs, CD8+ T cells and B cells, heavily infiltrated but immunosuppressed phenotype. It is associated with dismal survival and worse treatment response to TKIs. TMEcluster-A featured mast cells accumulation, prolonged survival and better treatment response. With increasing understanding of the importance of TME, immune subtype may play a fundamental role in predicting outcomes and treatment responses as opposed to relying solely on clinicopathological characteristics or single biomarkers.
Acknowledgments
We thank Dr Lingli Chen (Department of Pathology, Zhongshan Hospital, Fudan University, Shanghai, China) and Dr Peipei Zhang (Department of Pathology, Ruijin Hospital, Shanghai Jiao Tong University School of Medicine, Shanghai, China) for their excellent pathological technology help.
References
Footnotes
YX, ZW, QZ and HZ contributed equally.
Contributors YXio, ZW, QZ and HZ for acquisition of data, analysis and interpretation of data, statistical analysis and drafting of the manuscript; HZ, ZL, QH, JW, YC, YXia, YW, LL, Y.Z, LX and BD for technical and material support; QB, JG and JX for study concept and design, analysis and interpretation of data, drafting of the manuscript, obtained funding and study supervision. All authors read and approved the final manuscript.
Funding This study was funded by grants from National Natural Science Foundation of China (31770851, 81702496, 81702497, 81702805, 81772696, 81872082, 81902556, 81902563, 81902898, 81974393), National Key R&D Program of China (2017YFC0114303), Shanghai Municipal Natural Science Foundation (16ZR1406500, 17ZR1405100, 19ZR1431800), Guide Project of Science and Technology Commission of Shanghai Municipality (17411963100), Shanghai Sailing Program (18YF1404500, 19YF1407900, 19YF1427200), Shanghai Municipal Commission of Health and Family Planning Program (20174Y0042, 201840168, 20184Y0151), Fudan University Shanghai Cancer Center for Outstanding Youth Scholars Foundation (YJYQ201802) and Shanghai Cancer Research Charity Center.
Competing interests No, there are no competing interests.
Patient consent for publication Not required.
Ethics approval The study followed the Declaration of Helsinki and was approved by the Clinical Research Ethics Committee of Zhongshan Hospital, Fudan University with the approval number B2015-030.
Provenance and peer review Not commissioned; externally peer reviewed.
Data availability statement Data are available upon reasonable request.