Article Text

Abstract
Background Immunogenic cell death (ICD) is a peculiar modality of cellular demise that elicits adaptive immune responses and triggers T cell-dependent immunity.
Methods Fluorescent biosensors were employed for an unbiased drug screen approach aiming at the identification of ICD enhancers.
Results Here, we discovered thiostrepton as an enhancer of ICD able to boost chemotherapy-induced ATP release, calreticulin exposure and high-mobility group box 1 exodus. Moreover, thiostrepton enhanced anticancer immune responses of oxaliplatin (OXA) in vivo in immunocompetent mice, yet failed to do so in immunodeficient animals. Consistently, thiostrepton combined with OXA altered the ratio of cytotoxic T lymphocytes to regulatory T cells, thus overcoming immunosuppression and reinstating anticancer immunosurveillance.
Conclusion Altogether, these results indicate that thiostrepton can be advantageously combined with chemotherapy to enhance anticancer immunogenicity.
- adaptive immunity
- immunomodulation
This is an open access article distributed in accordance with the Creative Commons Attribution Non Commercial (CC BY-NC 4.0) license, which permits others to distribute, remix, adapt, build upon this work non-commercially, and license their derivative works on different terms, provided the original work is properly cited, appropriate credit is given, any changes made indicated, and the use is non-commercial. See http://creativecommons.org/licenses/by-nc/4.0/.
Statistics from Altmetric.com
Introduction
Although it was thought for more than 50 years that anticancer cytotoxicants would kill tumor cells, thus yielding a direct antineoplastic effect,1 it has become clear over the past 15 years that some particularly successful chemotherapeutics do not act in such a direct fashion but rather stress and kill a fraction of the tumor cells in a way that they elicit an immune response against tumor-associated antigens.2 Thus, immunogenic cell death (ICD)3 causes tumor growth control via the induction of antitumor immunity requiring the implication of dendritic cells and interferon-γ producing cytotoxic T lymphocytes (CTLs). This implies that some chemotherapeutics can be advantageously combined with immune checkpoint blockers targeting the programmed cell death death 1/programmed death ligand 1 (PD-1/PD-L1) interaction.4–7
Only a fraction of cytotoxicants are able to stimulate ICD, which requires the premortem induction of specific stress pathways, in particular, autophagy and partial endoplasmic reticulum (ER) stress response with the phosphorylation of eukaryotic initiation factor 2α (eIF2α).8–10 Autophagy is required for the lysosomal secretion of ATP, a chemotactic factor that is released from stressed/dying cancer cells and attracts dendritic cell precursors into the tumor bed via the action on purinergic receptors and may contribute to local inflammasome activation as well.11 12 ER stress facilitates the surface exposure of the most abundant ER luminal protein, calreticulin (CALR).9 10 13 14 Once present at the surface of the plasma membrane of stressed/dying cancer cells, CALR serves as a potent ‘eat-me’ signal to facilitate the uptake of tumor antigens by immature dendritic cells.15 High-mobility group box 1 (HMGB1), which is the most abundant non-histone chromatin-binding protein, is released from dying/dead cells to reach toll-like receptor 4 (TLR4) on dendritic cells, stimulating their maturation for the cross-presentation of tumor antigens to CTL.16 17 Hence, this cascade (ATP, CALR, HMGB1)2 18 contributes to the stepwise initiation of the anticancer immune response within the tumor bed and composes the triad of ICD.
Materials and methods
Cell culture and chemicals
Culture media and supplements for cell culture were obtained from Life Technologies (Carlsbad, California, USA) and plasticware came from Greiner BioOne (Kremsmünster, Austria). PC12 cells stably expressing doxycycline-inducible Q74-GFP were cultured in Roswell Park Memorial Institute (RPMI)-1640 containing 5% fetal bovine serum and 10% horse serum.19 Human osteosarcoma U2OS TFE-/-cells carrying a knockout for TFE3 and TFEB,20 MCA205 murine fibrosarcoma stably expressing shRNAs interfering with the expression of TFE3 and TFEB,20 and all the other cells were maintained in Dulbecco’s modified Eagle’s medium, supplemented with 10% fetal bovine serum and both containing 100 units/mL penicillin G sodium and 100 mg/mL streptomycin sulfate. All cells were cultured at 37°C under 5% CO2. The Prestwick Chemical Library was obtained from Prestwick Chemical (Illkirch, France), flavonoids were purchased from Extrasynthese (Genay, France), fatty acids came from Larodan (Malmö, Sweden); known calorie restriction mimetics, cisplatin, dactinomycin, cycloheximide, staurosporine, thapsigargin, tunicamycin, bafilomycin A1, and cycloheximide were from Sigma-Aldrich (St. Louis, Missouri, USA).
High-content microscopy
Human osteosarcoma U2OS cells wild type or stably expressing GFP-LC3; GFP-TFEB; mRFP-GFP-LC3; mCherry-GFP-p62, HMGB1-GFP and CALR-RFP, or human glioma H4 cells stably expressing GFP-LC3 or PC12 cells expressing GFP-Q74 were seeded in 384-well black microplates. After treatment, cells were fixed with 4% paraformaldehyde (PFA, w/v in phosphate buffered saline (PBS)) overnight at 4°C and stained with 10 µg/mL Hoechst 33 342 in PBS. Images were acquired using an ImageXpress micro XL automated microscope (Molecular Devices, San Jose, California, USA) with a ×20 PlanApo objective (Nikon, Tokyo, Japan). A minimum of four view fields was acquired per well, and experiments involved at least triplicate assessments. Quantitation was done on 1000–2400 cells per condition. Following images were analyzed using the Custom Module Editor of the MetaXpress software (Molecular Devices). Briefly, cells were segmented and divided into nuclear and cytoplasmic regions based on the nuclear Hoechst staining and cytoplasmic GFP or RFP signal. GFP-LC3 dots were measured in the cytoplasmic compartment. For quinacrine assays, cells were incubated with Krebs-Ringer solution containing 5 µM quinacrine and 20 µg/mL Hoechst 33 342 at 37°C for 30 min, then cells were washed and imaged alive. Quinacrine dots were measured in the cytoplasmic compartment. GFP-TFEB or HMGB1 fluorescence intensities were measured in the nuclear compartment. CALR-RFP aggregation was measured perimembranous while excluding perinuclear signal. Data processing and statistical analyses were performed using the R software (http://www.r-project.org/).
In vivo experimentation
All mice were kept in an environmental-controlled and pathogen-free facility with 12 hours light/dark cycles and food and water ad libitum. Female wild-type C57BL/6 mice and athymic female nude mice (nu/nu) at the age of 6–8 weeks were obtained from Envigo, France (Envigo, Huntingdon, UK). For immunoblotting assessment of LC3, wild-type C57BL/6 mice were treated with thiostrepton, liver were thereafter collected and processed. For the GFP-LC3 assessment, 8-week-old GFP-LC3 transgenic (Tg-GFP-LC3) mice, containing a rat LC3-EGFP fusion protein under the control of the chicken b-actin, were treated with thiostrepton with or without 40 mg/kg of the autophagic flux inhibitor leupeptin 2 hours before the organs were collected and processed. For tumor growth experiments, MCA205 or TC-1 tumors were established in C57BL/6 hosts by subcutaneously inoculating 3×10⁵ cells. Thiostrepton was dissolved in 3.34% dimethylsulfoxide (DMSO), 10.02 % PG400 (Sigma-Aldrich), 10.02% TWEEN80 (Sigma-Aldrich) and 76.6% corn oil (Sigma-Aldrich).
When tumors became palpable, mice were treated with thiostrepton in 200 mg/kg 1 day before, on, and 1 day after the chemotherapy (10 mg/kg oxaliplatin, Sigma-Aldrich) by intraperitoneal injection. On the following days, thiostrepton were given 40 mg/kg alone three times per week, and mice well-being and tumor growth were monitored and documented. Animals were sacrificed when tumor size reached endpoint or signs of obvious discomfort were observed following the EU Directive 63/2010 and our Ethical Committee advice.
Detection of protein deacetylation
U2OS-GFP-LC3 stable cells were seeded in 384-well microplates for 24 hours. After experimental treatments, cells were fixed with 4% PFA for 20 min at room temperature. Thereafter, cells were incubated with an antibody specific for acetyl-alpha-tubulin (#5335, 1:500, Cell Signaling Technology) in 5% bovine serum albumin (BSA, w/v in PBS) for 1 hour to block non-specific binding sites and acetylated tubulins, followed by overnight incubation at 4°C with specific antibody to detect acetylated proteins at lysines (#623402, 1:400, BioLegend, San Diego, California, USA). After washing several times with PBS, cells were incubated with Alexa Fluor conjugates (Life Technologies) against the primary antibody for 2 hours at room temperature. Nuclei were stained by incubating the cells with 10 µg/mL Hoechst 33 342 in PBS. Fluorescent images were acquired and analyzed as described before.
Determination of extracellular HMGB1 concentration
Cell culture supernatants were collected and centrifuge to remove debris. The concentration of HMGB1 was detected by ELISA (HMGB1 ELISA kit II; Shino Test Corporation, Tokyo, Japan) according to the manufacturer's instructions. The positive control was from the same kit. Absorbance was analyzed by means of an Paradigm I3 multimode plate reader (Molecular Devices).
Immunoblotting
After treatment, cells were collected and lysed in cold RIPA lysis and extraction buffer (Thermo Fisher Scientific, Carlsbad, California, USA) containing Pierce Protease and Phosphatase Inhibitor Mini Tablet (Thermo Fisher Scientific) on ice for 40 min. After centrifugation at 12 000g for 15 min, supernatants were heated in sample buffer (Thermo Fisher Scientific) at 100°C for 10 min. Protein samples were separated on precast 4%–12% polyacrylamide NuPAGE Bis–Tris gels (Thermo Fisher Scientific) and electrotransferred to Polyvinylidene difluoride (PVDF) membranes (Millipore Corporation, Burlington, Massachusetts, USA). Membranes were probed overnight at 4°C with primary antibodies specific to LC3 (#2775, 1:1000, Cell Signaling Technology), p62 (#ab56416, 1:10 000, Abcam, Cambridge, UK), Atg5 (#A2859, 1:1000, Sigma-Aldrich, St. Louis, Missouri, USA), GAPDH (#ab8245, 1:10 000, Abcam), TFEB (#4240, 1:1000, Cell Signaling Technology, Danvers, Massachusetts, USA), TFE3 (ab93808, 1:2000, Abcam), and β-actin (#ab49900, 1:10 000, Abcam) followed by incubation with appropriate horseradish peroxidase–conjugated secondary antibodies (Southern Biotech, 1:5000, Birmingham, Alabama, USA). Immunoreactive bands were visualized with ECL prime western blotting detection reagent (Sigma-Aldrich). Equal loading was controlled for all blots and one representative loading control is depicted, as indicated in the figure legends.
Immunofluorescence
Cells were incubated with 3.7% PFA for 20 min at room temperature. For TFE3 staining, fixed cells were then permeabilized with 0.1% Triton X100 on ice, and blocked with 5% bovine serum albumin (BSA, w/v in PBS) for 1 hour. For phospho-eIF2 alpha (Ser51) staining, fixed cells were directly blocked with 5% BSA for 1 hour. Then cells were incubated with antibodies specific to TFE3 (#PA5-54909, 1:500, Invitrogen) or phospho-eIF2 alpha (Ser51) (#ab32157, 1:500, Abcam) overnight (ON) incubation at 4°C. Thereafter, Alexa Fluor 647 nm conjugates (Thermo Fisher Scientific) against the primary antibody were applied for 2 hours at RT. Cells were then washed and imaged by high-content microscopy as described above. The nuclear intensity of TFE3 and cytoplasmic intensity of phospho-eIF2 alpha (Ser51) were measured and normalized on Ctrl.
Autophagy measurement on tissue sections
Liver tissues were fixed with 10% neutral buffered formalin at overnight at 4°C and then transferred into 30% sucrose diluted in PBS for 24 hours at 4°C. Thereafter, the organs were embedded in optimal cutting temperature (OCT) solution, and consecutive tissue sections were cut by cryostat. Samples were stained with 4′,6-diamidino-2-phenylindole (DAPI) to detect nuclei, and images were acquired by confocal microscopy. GFP-LC3 dot area was measured by ImageJ.
Extracellular ATP level
Cellular supernatants were collected and processed with the ENLITEN ATP Assay System Bioluminescence Detection Kit (Promega, Madison, Michigan, USA; #FF2000) following the manufacturer’s methods. Fluorescence was detected by means of a Paradigm I3 multimode plate reader (Molecular Devices).
Flow cytometry analysis of CALR surface exposure
Cells were detached and collected and sequentially incubated with Zombie UV (#423114; Biolegend), anti-CALR rabbit monoclonal antibody (#ab2907; Abcam, Cambridge, UK) for 30 min at 4°C, followed by Alexa Fluor 488, 546 or 647 goat anti-rabbit IgGs (#A11034, Thermo Fisher Scientific) for 30 min at 4°C, then fixed with 4% PFA in PBS for flow cytometric assessment.
Flow cytometric analysis of annexin V and DAPI
Cells were detached and collected and incubated with annexin V (Biolegende #640943) and DAPI according to the manufacturer’s advice. Following cells were assessed by flow cytometry.
Reactive oxygen species detection
Cells were treated as indicated and menadione was used for 1 hour at 100 µM as a positive control. CellROX deep red (#C10422, Thermo Fisher Scientific) was added for 30 min at a final concentration of 5 µM. Then cells were fixed and stained with 4% PFA containing Hoechst for 30 min at room temperature and images were acquired and analyzed by automated microscopy.
Ex vivo–phenotyping of the tumor immune infiltrate
Tumors were harvested, weighed and transferred on ice into gentleMACS C tubes (Miltenyi Biotec, Bergisch Gladbach, Germany) containing 1 mL of RPMI medium. Tumors were dissociated first mechanically with scissors, then enzymatically using Miltenyi Biotec mouse tumor dissociation kit and a GentleMACS Octo Dissociator following the manufacturer’s instructions. Tumor homogenates were filtered through 70 µm MACS SmartStrainer (Miltenyi Biotec) and washed twice with PBS. Finally, bulk tumor cells were homogenized in PBS at a concentration corresponding to 250 mg of the initial tumor weight per millilitre. Bulk tumor cell homogenates, each corresponding to 50 mg of the initial tumor sample, were stained with LIVE/DEAD Fixable Yellow dye (Thermo Fisher Scientific). Fc receptors were blocked with anti-mouse CD16/CD32 (clone 2.4G2, Mouse BD Fc Block, BD Pharmingen). Surface staining of murine immune cell populations infiltrating the tumor was performed with the following fluorochrome-conjugated antibodies: (1) ‘Neutrophils’ panel: anti-CD45 APC-Fire750 (clone 30 F-11, BioLegend), anti-Ly-6G PE (clone 1A8, BD Pharmingen), anti-Ly-6C FITC (clone AL-21, BD Pharmingen), anti-CD11b V450 (clone M1/70, BD Pharmingen); (2) ‘T-cell activation/exhaustion’ panel: anti-CD3 APC (clone 145–2 C11, BioLegend), anti-CD8 PE (clone 53–6.7, BD Pharmingen), anti-CD4 PerCP-Cy5.5 (clone RM4-5, Thermo Fisher Scientific), anti-CD25 PE-Cy7 (clone PC61.5, Thermo Fisher Scientific). Then, cells were fixed and permeabilized in eBioscience Foxp3/Transcription Factor Staining Buffer (Thermo Fisher Scientific). To complete the ‘T-cell activation/exhaustion ’ panel, an intranuclear staining was performed with anti-FoxP3 FITC (clone FJK-16s, Thermo Fisher Scientific). Finally, stained samples were run through a BD LSR II flow cytometer. Data were acquired using BD FACSDiva software (BD Biosciences) and analyzed using FlowJo software (TreeStar). Absolute counts of leukocytes and tumor cells were normalized considering the following parameters: weight of the harvested tumor and total volume of the dissociated tumor cell suspension (cell concentration typically set to 250 mg/mL in PBS), proportion of the whole cell suspension and proportion of the cell suspension used for cytometry. (Representative gating strategies are depicted in online supplementary figure S5 and S6.)
Supplemental material
Statistical analysis
Data are reported as means±SD of triplicate determinations and experiments were repeated at least twice, yielding similar results if not otherwise reported. Statistical significance was assessed by Student’s t-test. TumGrowth and GraphPad were used to analyze in vivo data arising from murine models.21
Results and discussion
A pharmacologic screen identifies thiostrepton as an autophagy inducer
To identify bona fide autophagy inducers, we screened a total of 1560 compounds contained in the Prestwick library, as well as home-made libraries containing flavonoids18 20 and a range of saturated and unsaturated fatty acids22 for their capacity to induce the formation of autophagic puncta in human H4 neuroblastoma cells that express a green fluorescent protein (GFP) fused to microtubule-associated proteins 1A/1B light chain 3B (best known as LC3) (figure 1A,B; online supplementary table S1). The 175 compounds that were most efficient at one of the chosen concentrations were re-tested on another cell line, namely, human U2OS osteosarcoma cells stably expressing the monomeric red fluorescent protein (mRFP)-GFP-LC3 tandem reporter23 for their capacity to induce autophagic flux (meaning that they increase the ratio of RFP-positive over GFP-positive puncta) (figure 1C,D; online supplementary table S2). The 34 most effective candidate compounds (online supplementary table 1) were finally investigated for their capacity to reduce intracellular ATP concentrations measured with the fluorochrome quinacrine in combination with the prototypic ICD inducers mitoxantrone, using 3,4-dimethoxychalcone20 as a positive control (figure 1E,F; online supplementary table S3). This approach led to the identification of thiostrepton, an antibiotic produced by Streptomyces azureus and Streptomyces laurentii,24–26 as a potential ICD enhancer.
Supplemental material
Supplemental material
Supplemental material

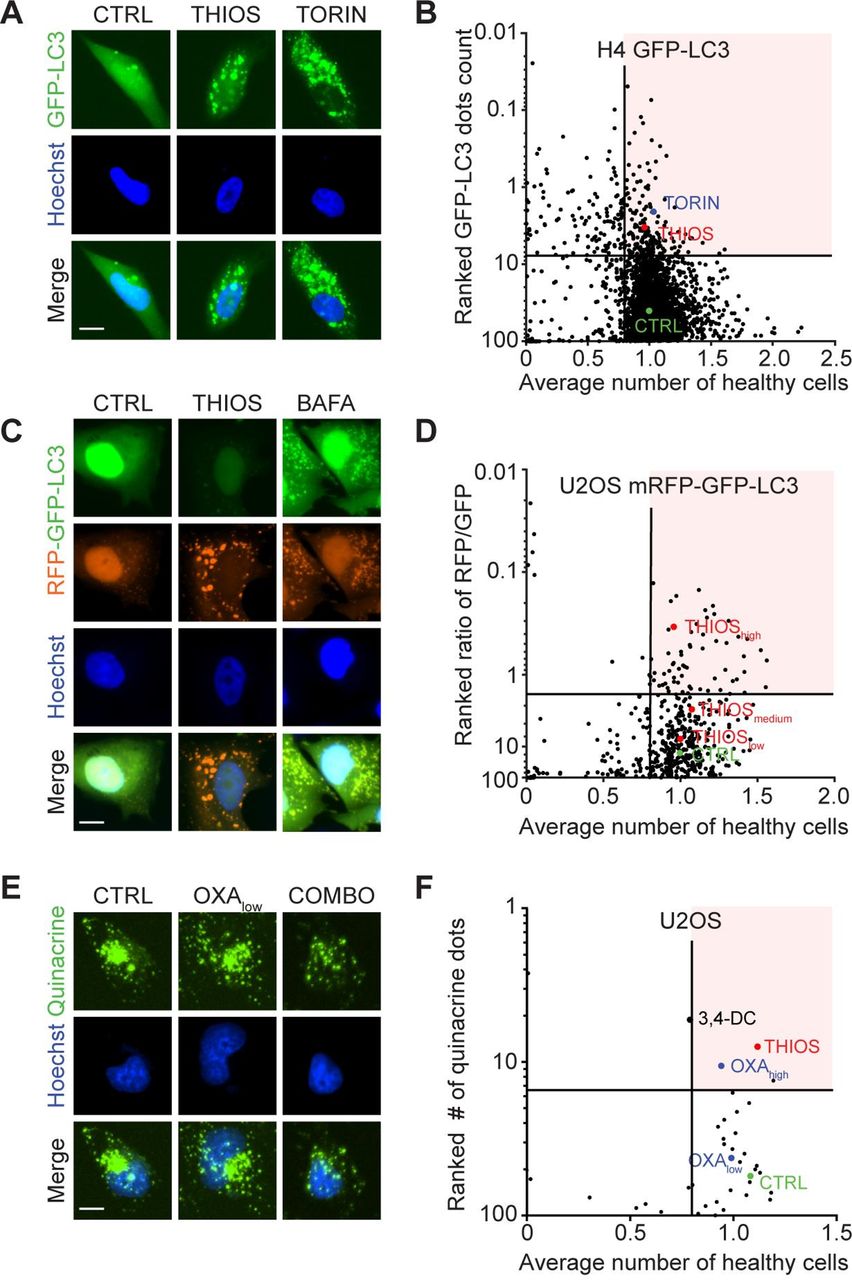
Identification of thiostrepton as autophagy inducer and immunogenic cell death enhancer. (A,B) Human neuroglioma H4 stably expressing GFP-LC3 were treated for 6 hours at two to five concentrations with 1428 chemical compounds originating from a selection of the Prestwick library (at 0.5, 5 and 50 µM), a flavonoids library (at 10, 30, and 90 µM) and a fatty acid library (at 31.25, 62.5, 125, 250 and 500 µM), together with their respective control vehicles (complete medium, DMSO or ethanol). This resulted in 4147 tested conditions in total. Torin 1 at 300 nM was used as positive control for autophagy induction. The number of GFP-LC3 positive puncta was measured as a proxy for autophagy and the number of cells that confer a regular nuclear phenotype was assessed as an indicator for viability. Data were normalized to controls and are depicted as ranked percentage of the normalized GFP-LC3 dots. A total of 175 compounds with increased GFP-LC3 dots count (and number of healthy cells >0.8) were selected for further experiments. Normalized data are shown as a dot plot in (A) and representative images are depicted in (B). (C, D) Human osteosarcoma U2OS cells stably expressing a tandem mRFP-GFP-LC3 biosensor were treated with the selected compounds to assess autophagic flux. Bafilomycin A1 (BAFA1) at 100 nM was used as a prototype flux inhibitor. The number of GFP positive and RFP positive dots was assessed and normalized to untreated controls. Cellular viability was assessed and normalized as described above. Data are depicted as ranked percentage of the ratio of RFP/GFP dots. A total of 34 autophagic flux inducing compounds (with numbers of healthy cells >0.8) were selected for further experiments. Normalized data are shown as a dot plot in (C) and representative images are depicted in (D). (E,F) U2OS wild-type cells were tested with the selected hit compounds at 50 µM in the presence of low-dose oxaliplatin (OXA at 60 µM) for 6 hours. High-dose OXA (400 µM) was used as positive control for ATP release. Quinacrine positive dots were assessed by microscopy and then values were normalized to controls. Normalized data are shown as a dot plot in (E) and representative images are depicted in (F). Scale bar equals 10 nm.
Validation of autophagy induction by thiostrepton
When used at micromolar concentrations for 6 hours, thiostrepton had little or no cytotoxic activity on cultured cells and reduced cytoplasmic protein acetylation, as measured by immunofluorescence staining, as it induced cytoplasmic GFP-LC3 puncta in human and murine biosensor cells (figure 2A–D, online supplementary figure S1A,B). In the presence of bafilomycin A1, thiostrepton continued to increase the number of cytoplasmic GFP-LC3 puncta per cell (figure 2E,F, online supplementary figure S1A,B). Moreover, the autophagy-associated lipidation of LC3 was enhanced by thiostrepton, more so in the presence of bafilomycin A1 (figure 2G,H, online supplementary figure S1C,D), indicating that thiostrepton truly induced autophagy. Accordingly, thiostrepton acted on another biosensor that measures autophagic flux, namely, a mCherry-GFP-sequestosome-1 (SQSTM1, best known as p62) to preferentially reduce the GFP-dependent fluorescence, indicating an increase in autophagy (figure 2I,J).27 Moreover, thiostrepton stimulated the degradation of a Q74-huntingtin-GFP fusion protein indicative of an increase of autophagic flux28 (figure 2K,L). When systemically injected into mice, thiostrepton also caused increased LC3 lipidation in the liver, suggesting that it is active in vivo (figure 2M–P). Of note, thiostrepton lost its capacity to induce GFP-LC3 puncta in U2OS cells that lack the essential autophagy gene ATG5 or the two proautophagic transcription factors TFEB and TFE3 (figure 3A–D). Indeed, thiostrepton induced the translocation of TFEB and TFE3 from the cytoplasm to the nucleus, as did the positive control torin (figure 3E,F). Moreover, thiostrepton induced the phosphorylation of eIF2α, an event that is often associated with autophagy.29 However, thiostrepton did inhibit transcription and translation in human cells cultured in vitro (see online supplementary figure S2A–D), indicating that it can interfere with protein synthesis in eukaryotes as it does in bacteria.30 Thiostrepton did not lead to an overproduction of reactive oxygen species (see online supplementary figure S2E,F), yet had (limited) cytotoxic effects when cells were exposed to the drug for an extended amount of time (24 hours) (see online supplementary figure S2G–J). This effect was further increased when thiostrepton was combined with low-dose oxaliplatin. Altogether, these results confirm that thiostrepton is a potent autophagy-inducing and cell stress-inducing agent.

Thiostrepton induces autophagic flux. (A–D) Human osteosarcoma U2OS cells stably expressing GFP-LC3 were treated with thiostrepton (THIOS; 1, 3, 9 µM), spermidine (SPDN; 200 µM), or vehicle (CTRL) for 6 hours. The cells were fixed and acetylated tubulin was blocked by means of a specific antibody. Thereafter, cytoplasmic fluorescence intensity of acetylated lysine residues was assessed by appropriate Alexa Fluor 568-conjugated secondary antibodies (A). All data were normalized to controls (CTRL). Viable cells with regular nuclear phenotype are shown in (B). Protein acetylation are shown in (C), and GFP-LC3 dots were counted as a proxy for autophagic activity in (D). Representative images of acetylation and GFP-LC3 are shown in (A). Scale bar equals 10 µm. Data are means±SD of four replicates (**p<0.01, ***p<0.001; Student’s t-test). (E,F) Human glioma H4 cells stably expressing GFP-LC3 were treated with thiostrepton (1.9, 5.6, 16.7 and 50 µM), torin 1 (TORIN, 300 nM), or vehicle (CTRL), with or without bafilomyicn A1 (BAFA1) for 6 hours. GFP-LC3 dots were counted to assess autophagic activity. Representative images of GFP-LC3 are shown in (E). Data are means±SD of four replicates (***p<0.001; Student’s t-test). (G,H) H4 wild-type cells were treated with thiostrepton (5 µM) or vehicle (CTRL), with or without BafA1 for 6 hours. Then cells were processed to measure LC3 and p62 protein levels by SDS–PAGE and immunoblot. GAPDH was used as a loading control. The experiments were repeated at least three times. Band intensities of p62, GAPDH, and LC3-II were measured, and ratios of p62 or LC3-II versus GAPDH (LC3-II/GAPDH, p62/GAPDH) were calculated in (H). Data are means±SEM of three independent experiments (*p<0.05 compared with untreated CTRL; #p<0.05, ##p<0.01, compared with no BAFA1; paired Student’s t-test). (H–I) U2OS cells stably expressing RFP-GFP-p62 tandem reporter were treated with thiostrepton (15, 30, 60 µM), vehicle (CTRL), or torin 1 (TORIN, 300 nM). GFP and RFP intensity were measured. The ratio of GFP/RFP intensity indicated p62 degradation (I). Representative images of RFP-GFP-p62 are shown in (I). Data are means±SD of four replicates (*p<0.05, ***p<0.001; Student’s t-test) (J). (K,L) Rat adrenal gland PC12 cells expressing inducible variant of Q74-GFP cells were treated with doxycycline (1 µg/mL) for 8 hours for the induction of Q74 expression. Then the medium was changed and thiostrepton (0.25, 0.5, 1, 2 µM), torin 1 (TORIN, 300 nM), or vehicle (CTRL) were added for 24 hours. The cells were fixed and GFP-Q74 dots were counted to assess Q74 degradation (L). Representative images of GFP-Q74 are shown in (K) (*p<0.05, ***p<0.001; Student’s t-test). (M,N) C57BL/6 mice were injected intraperitoneally with thiostrepton (200 mg/kg) or vehicle for 24 hours every day for 3 days, and tissues were collected 6 hours after the last injection. Then the tissue was subjected to SDS–PAGE and immunoblot (M). GAPDH was measured as a loading control. Band intensities of GAPDH and LC3-II were measured, and the ratio of LC3-II versus GAPDH (LC3-II/GAPDH) was calculated in (N). Data are means±SEM of 6 mice per group (***p<0.001; Student’s t-test). (O–P) GFP-LC3-expressing mice were i.p. injected with thiostrepton for three times (same as the first three times in tumor growth experiments). Leupeptin (Leu) was used to test autophagic flux in vivo, and GFP-LC3 dots were measured in liver tissue. Data are means±SEM of at least three mice (*p<0.05 vs CTRL without Leu; #p<0.05 vs CTRL with Leu; Student’s t-test).
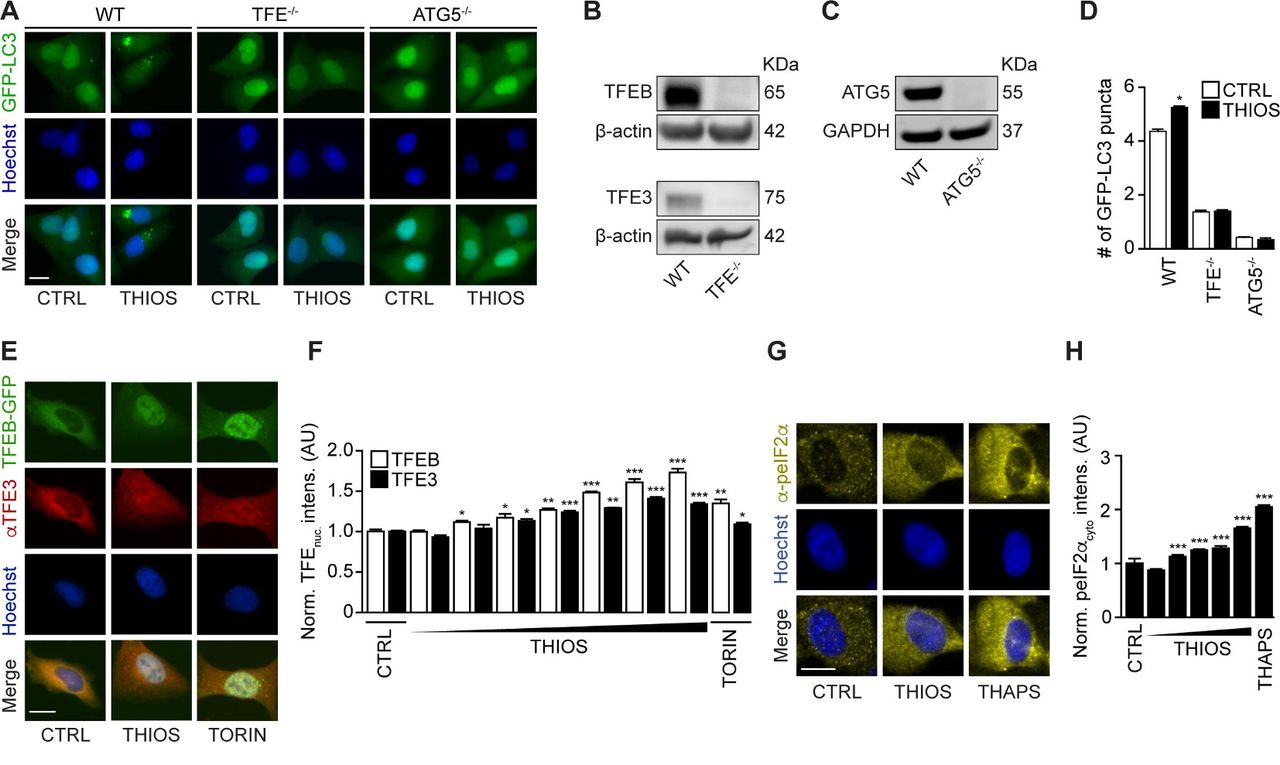
Thiostrepton-induced autophagy is TFE-dependent. (A–D) Human osteosarcoma U2OS cells wild type, TFEB-TFE3 double knockout (B) or ATG5 knockout (C) cells expressing GFP-LC3 were treated with thiostrepton (2 µM) for 6 hour. GFP-LC3 dots were counted to measure autophagy activity (D). Representative images of GFP-LC3 are shown in (A). Data are means±SD of four replicates (*p<0.05; Student’s t-test). (E–F) U2OS cells stably expressing TFEB-GFP fusion protein were treated with indicated concentrations of thiostrepton (THIOS; 2, 5, 8, 10 µM) or torin 1 (TORIN, 300 nM) for 6 hours. Immunofluorescence staining was conducted with antibodies against TFE3 and appropriate Alexa Fluor 647-conjugated secondary antibody before the assessment of nuclear fluorescence intensity. GFP-TFEB nuclear intensities and Alexa Fluor 647(cy5)-TFE3 nuclear intensities were assessed (F). Data are means±SD of four replicates (**p<0.01;***p<0.001; Student’s t-test). Representative images are shown in (E). Scale bar equals 10 µm. (G,H) U2OS wild-type cells were treated with thiostrepton (0.1, 0.5, 1, 5, 10 µM), thapsgargin (3 µM), or vehicle for 6 hours. Immunofluorescence staining was conducted with antibodies against phospho-eIF2 alpha (Ser51) and appropriate Alexa Fluor 647-conjugated secondary antibody before the assessment of cytoplasmic fluorescence intensity (H). Representative images of phospho-eIF2 alpha (Ser51) are shown in (G). Data are means±SD of four replicates (*p<0.05; Student’s t-test).
Thiostrepton amplifies ICD surrogate markers
Mitoxantrone (MTX) and oxaliplatin (OXA) are potent ICD inducers.31 As such, they elicit the ICD hallmarks in vitro, in cultured cancer cells, including the autophagy-dependent ATP release into the supernatant, calreticulin (CALR) exposure on the cell surface, as well as nuclear exodus of HMGB1.32–34 We determined the capacity of thiostrepton to enhance these stigmata of ICD in a series of in vitro assays. The importance of thiostrepton-induced ATP release needs to be further validated in vivo. Nevertheless, it appears clear that thiostrepton reduced the abundance of quinacrine-detectable ATP in the cytoplasm of cultured cells, more so if combined with low concentrations of MTX or OXA, suggesting additive interactions (figure 4A,B). Accordingly, ATP concentrations in the supernatant increased with the thiostrepton/MTX or thiostrepton/OXA concentration, and this ATP release was inhibited in cells in which ATG5 or both TFEB and TFE3 had been knocked down (figure 4C–I) even after extended incubation for 24 hours (see online supplementary figure S3A,B). Thiostrepton was able to cause the relocation of an RFP-CALR fusion protein to the periphery of the cells either alone or in the presence of MTX or OXA (figure 5A,B), and this effect did not require TFEB plus TFE3 (see online supplementary figure S4A). The capacity of thiostrepton to cause CALR exposure was validated by surface immunofluorescence staining (figure 5C,D). Finally, protracted incubation (48–72 hours) with thiostrepton could cause HMGB1 release, more so when it was combined with low-dose MTX or OXA (figure 5E–G), which was reduced when TFEB plus TFE3 was knocked down (see online supplementary figure S4B). Hence, thiostrepton can amplify ICD surrogate markers in the context of low-dose MTX or OXA.

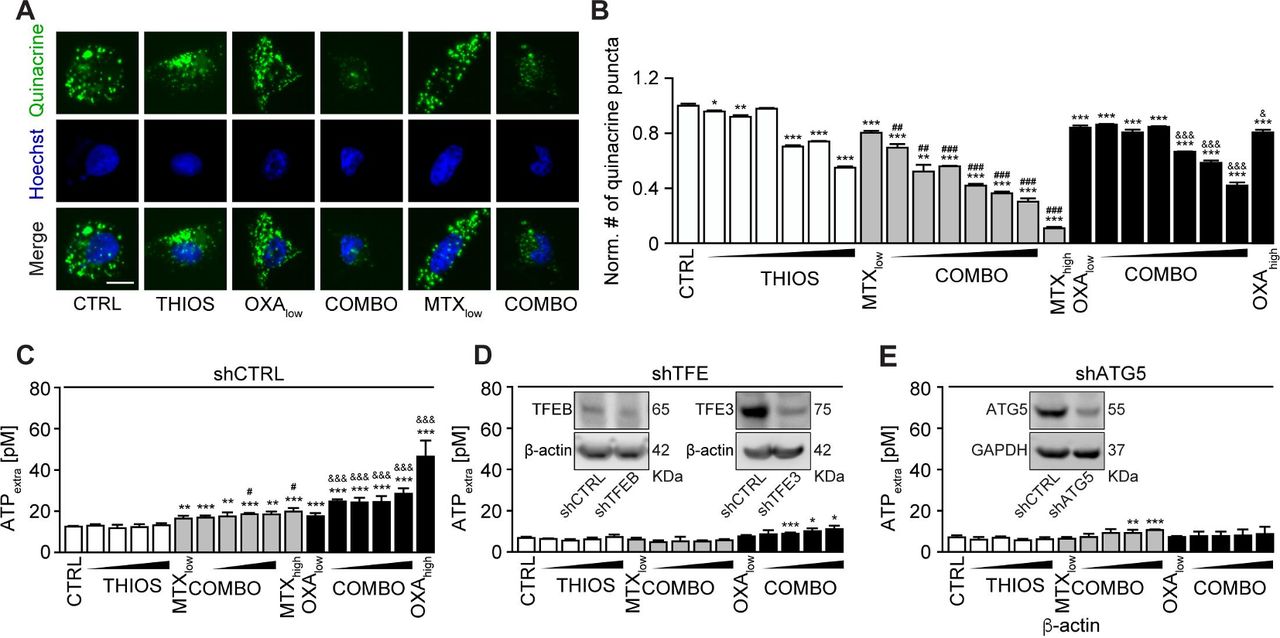
Validation of thiostrepton facilitated ATP release with mitoxantrone (MTX) and oxaliplatin (OXA). (A,B) Thiostrepton (THIOS; 0.5, 1, 2, 3, 4, 6 µM) decreased intracellular ATP content in human osteosarcoma U2OS wild-type cells within 6 hours in the presence of low doses of the ICD inducers mitoxantrone (MTX, 1 µM) and oxaliplatin (OXA; 200 µM) detected by quinacrine. High-dose MTX (5 µM) and OXA (400 µM) were used as positive controls. Representative images are shown in (A). Scale bar equals 10 µm. Data are means±SD of four replicates (compared with vehicle control (CTRL), *p<0.05, **p<0.01, ***p<0.001 compared with CTRL; ##p<0.01, ###p<0.001 compared with cells treated with low-dose MTX; &p<0.05, &&&p<0.01 compared with cells treated with low-dose OXA; unpaired Student’s t-test). (C–E) Thiostrepton increased extracellular ATP levels in murine fibrosarcoma MCA205 wild-type cells in the presence of low doses of the ICD inducers MTX (0.5 µM) and OXA (150 µM), but much less efficient in MCA205-TFE knockdown or ATG5 knockdown cells. Cells were treated with THIOS (1.56, 3.12, 6.25, 12.5 µM) alone or in combination with low-dose MTX or OXA for 6 hours as described above. Data are means±SD of at least three replicates (*p<0.05, **p<0.01, ***p<0.001 compared with thiostrepton single treatment; #p<0.05 compared with cells treated with low-dose MTX alone, &&&p<0.01 compared with cells treated with low-dose OXA alone; unpaired Student’s t-test).
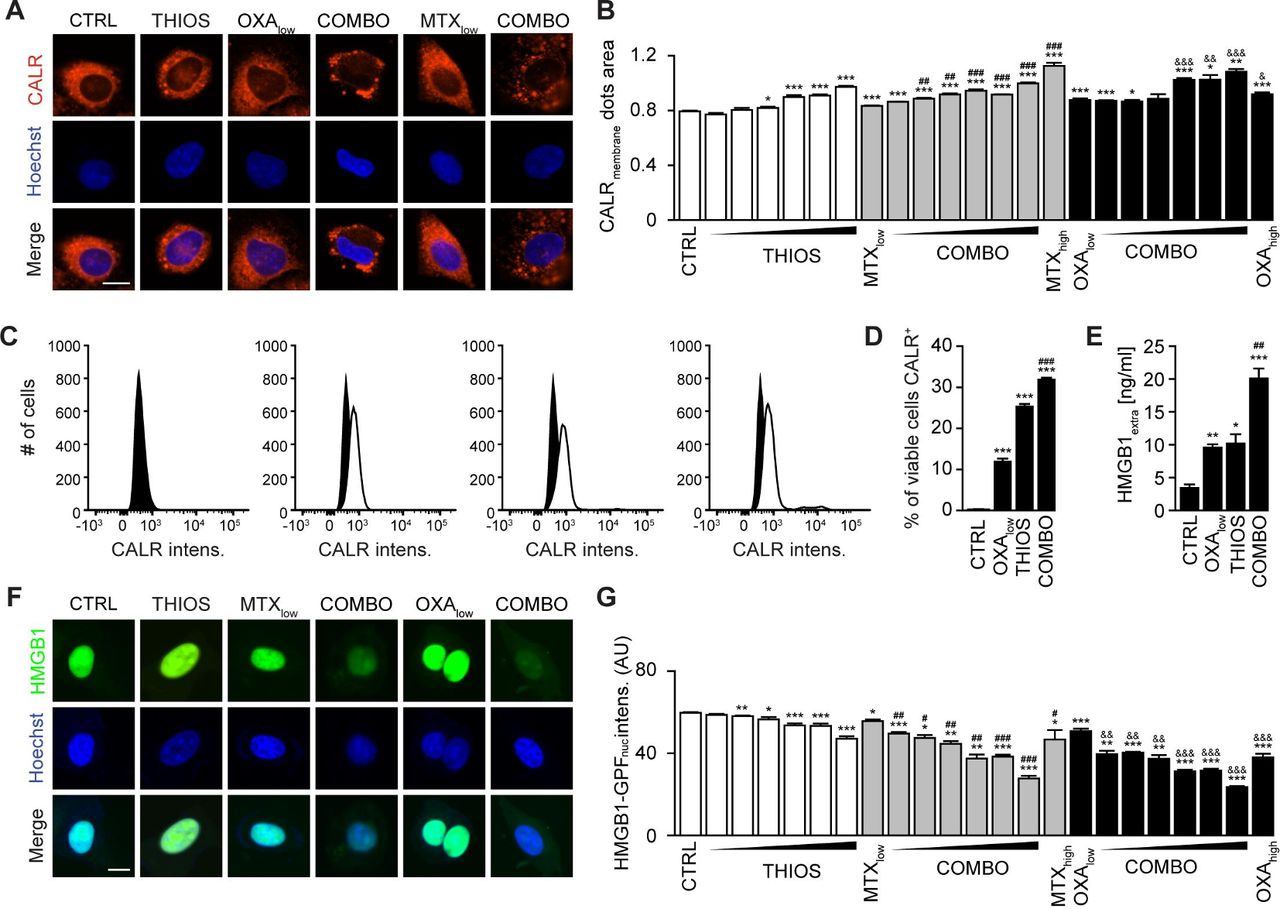
Thiostrepton facilitates calreticulin (CALR) exposure and high-mobility group box 1 (HMGB1) release in the presence of immunogenic cell death (ICD) inducer. (A,B) Thiostrepton increased CALR exposure in human osteosarcoma U2OS cells stably expressing CALR-RFP. Thiostrepton (THIOS: 0.5, 1, 2, 3, 4, 6 µM) was employed in the presence of low-dose mitoxantrone (MTX, 1 µM) and oxaliplatin (OXA, 200 µM). High-dose MTX (5 µM) and OXA (400 µM) were used as positive controls for 18 hours. Representative images are shown in (A). Scale bar equals 10 µm. Data are means±SD of four replicates (*p<0.05, **p<0.01, ***p<0.001; Student’s t-test; compared with vehicle control (CTRL)). (C,D) Thiostrepton increased CALR exposure in MCA205 wild-type cells detected by flow cytometry. Cells were treated with THIOS (12.5 µM) alone or in combination with OXA (150 µM) cells for 6 hours. Representative histograms are shown in (L). Data are means±SEM of at least three replicates (***p<0.001, compared with CTRL; ###p<0.001, compared with OXA: Student’s unpaired t-test). (E) THIOS alone or in combination (COMB) at the same concentration as in (A–B) increased extracellular HMGB1 after 48 hours in MCA205 wild-type cells monitored by ELISA. Data are means±SEM of at least three replicates ((*p<0.05, **p<0.01, ***p<0.001, compared with CTRL; ##p<0.01, compared with OXA: unpaired Student’s t-test). (F–G) Thiostrepton increased extracellular HMGB1 in U2OS cells and decreased HMGB1 content in U2OS HMGB1-GFP biosensor cells. Cells were treated as in (A,B) for 72 hours. Representative images are shown in (F). Scale bar equals 10 µm. Data are means±SD of four replicates (*p<0.05, **p<0.01, ***p<0.001, compared with CTRL; Student’s t-test).
Thiostrepton enhances the efficacy of immunogenic chemotherapy
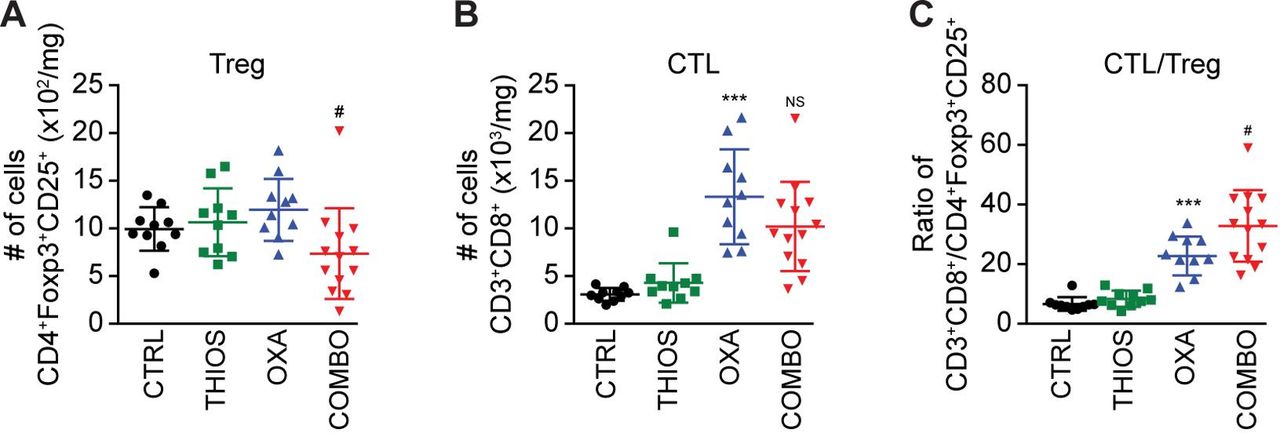
Although thiostrepton alone had no tumor growth reducing effect against TC1 non-small cell lung cancers or MCA205 fibrosarcomas established in immunocompetent C57/BL6 mice, it did increase the anticancer activity of the ICD inducer OXA (but not cis-diamminedichloridoplatinum(II), abbreviated CDDP, best known as cisplatin, which is unable to trigger ICD see online supplementary figure S5),7 further diminishing tumor size and extending the survival of the animals (figure 6A,B). This thiostrepton/OXA combination effect depended on T lymphocytes because tumor developing in athymic nu/nu mice failed to reduce their growth in response to the treatment (figure 6C). Moreover, tumors formed by cancer cells lacking TFEB and TFE3 expression that were implanted in immunocompetent C57/BL6 mice, failed to exhibit the combination effect as well (although they responded to OXA) (figure 6D), supporting the idea that TFEB/TFE3-dependent autophagy induction is critical for the anticancer action of thiostrepton. Analysis of the leukocyte infiltrate by immunophenotyping and cytofluorimetry (see online supplementary figure S6) revealed that thiostrepton had no significant effect on the abundance of CD8+ CTLs (figure 7A) but reduced the number of CD4+ CD25+ Foxp3 regulatory T cells (Tregs) if combined with OXA (figure 7B), thus improving the CTL/Treg ratio (figure 7C). Moreover, the combination treatment was particularly efficient in increasing the number of tumor infiltrating neutrophils (see online supplementary figure S7 and S8). In conclusion, thiostrepton can synergize with OXA to improve tumor control in an immune-dependent fashion, correlating with reprogramming of the tumor microenvironment.

Thiostrepton improves the efficacy of anticancer chemotherapy in vivo. (A,B) Effects of thiostrepton (THIOS) on tumor growth of TC-1 murine lung cancers (A) and MCA205 mouse fibrosarcomas cancers (B) in syngeneic immunocompetent C57Bl/6 mice. From left to right: (i) growth curves (mean±SEM); (ii) tumor size distributions at day 21 for TC1 tumor or day 25 for murine MCA205 fibrosarcoma of the data shown in (i); (iii) individual tumor growth curves of mice treated with oxaliplatin (OXA) alone or in combination with THIOS of the data shown in (i); (iv) Kaplan-Meier curves with tumor size exceeding 250 mm2 as an endpoint. (B) n=8 for mice treated with OXA and n=6 without OXA), (C) n=10 for single treatments or untreated animals, n=13 for the group receiving combination treatment). (C,D) Effects of THIOS on the growth of MCA205 fibrosarcomas in immunodeficient nu/nu mice (C) and MCA205-TFE knockdown cells in immunocompetent C57Bl/6 mice (D). From left to right: (i) growth curves (mean±SEM); (ii) tumor size distributions at day 19 on nude mice or day 37 on C57Bl/6 mice of data shown in (i); (iii) individual tumor growth curves of mice treated with OXA alone or in combination with THIOS of data shown in (i); (iv) Kaplan-Meier curves tumor size exceeding 300 mm2 (nude mice) or 250 mm2 (C57Bl/6 mice) as an endpoint. (C): n=7 for untreated controls and the groups receiving single treatments, n=10 for the group receiving the combination treatment); (D) n=6 for each group.

Cytofluorometric characterization of tumor-infiltrating lymphocytes (TIL). The number of CD3+ CD8+ cytotoxic T lymphocytes (A), CD4+ FOXP3+ CD25+ regulatory T cells (Treg) (B), the ratio of CD3+ CD8+ T lymphocytes over Treg (C), (compared with CTRL: ***p<0.001; compared with OXA: #p<0.05, NS, not statistically significant; Student’s t-test) (n=10 for the untreated controls and the groups receiving single treatments, n=13 for the group receiving the combination treatment).
Concluding remarks
Thiostrepton is a fully synthetic oligothiopeptide antibiotic that has been approved for veterinary but not human use, for the treatment of superficial infections including dermatitis and mastitis.35 Preclinical experiment suggest that it may inhibit human breast cancer growth and overcome cisplatin resistance.36 Here, we identified thiostrepton in an unbiased screen designed to identify autophagy inducers, and subsequently discovered that this agent can enhance the stigmata of ICD in cultured cells, thus enhancing ATP release, CALR exposure and HMGB1 exodus. Although thiostrepton had some activities on these ICD hallmarks when used alone, it was particularly active when combined with low doses of established ICD inducers such as MTX and OXA. Moreover, thiostrepton enhanced the anticancer activity of OXA in vivo. This adjuvant effect required the expression of proautophagic transcription factors by the cancer cells and was fully lost in the absence of T lymphocytes. Indeed, thiostrepton combined with OXA stimulated a major change in the tumor immune infiltrate, enhancing the density of CTL, but reducing that of Tregs and G-MDSC. Thiostrepton is an antibiotic,24 and the intestinal microbiota has been shown to contribute to anticancer immune responses elicited by some immunogenic chemotherapies37 38 or immunotherapy, meaning that broad-spectrum antibiotics causing sterilization of the intestinal tract reduce the efficacy of anticancer treatments.39 40 For this reason, it appears unlikely that the immune-dependent anticancer effects of thiostrepton would be related to its antibiotic activity. Thus, thiostrepton could be repurposed as an enhancer of immunogenic chemotherapies, independent of its antibiotic activity.
Acknowledgments
We thank David Rubinstein for the PC12-Q74-GFP cell line.
References
Footnotes
YW and WX are joint first authors.
ZZ, OK and GK are joint senior authors.
YW and WX contributed equally.
Contributors YW, WX and JH conducted experiments and analyzed data. GC, PL and JP assisted with experimental design. ZZ, OK and GK conceived the study and wrote the manuscript.
Funding YW and WX are supported by the China Scholarship Council. YW and ZZ were supported by the National Nature Science Foundation of China (81502049 for YW, 81572955 and 81773357 for ZZ). GK is supported by the Ligue contre le Cancer (équipe labellisée); Agence National de la Recherche (ANR) – Projets blancs; ANR under the frame of E-Rare-2, the ERA-Net for Research on Rare Diseases; AMMICa US23/CNRS UMS3655; Association pour la recherche sur le cancer (ARC); Association “Le Cancer du Sein, Parlons-en!”; Cancéropôle Ile-de-France; Chancelerie des universités de Paris (Legs Poix), Fondation pour la Recherche Médicale (FRM); a donation by Elior; European Research Area Network on Cardiovascular Diseases (ERA-CVD, MINOTAUR); Gustave Roussy Odyssea, the European Union Horizon 2020 Project Oncobiome; Fondation Carrefour; High-end Foreign Expert Program in China (GDW20171100085), Institut National du Cancer (INCa); Inserm (HTE); Institut Universitaire de France; LeDucq Foundation; the LabEx Immuno-Oncology (ANR-18-IDEX-0001); the RHU Torino Lumière; the Seerave Foundation; the SIRIC Stratified Oncology Cell DNA Repair and Tumor Immune Elimination (SOCRATE); and the SIRIC Cancer Research and Personalized Medicine (CARPEM).
Competing interests OK and GK are scientific co-founders of Samsara Therapeutics.
Patient consent for publication Not required.
Ethics approval Animal experiments were conducted in compliance with the EU Directive 63/2010).
Provenance and peer review Not commissioned; externally peer reviewed.
Data availability statement Data are available on reasonable request. All data relevant to the study are included in the article or uploaded as supplementary information.