Article Text

Abstract
Background Peritoneal carcinomatosis is a hallmark of advanced peritoneal tumor progression, particularly for tubal/ovarian high-grade serous carcinomas (HGSCs). Patients with peritoneal carcinomatosis have poor survival rates and are difficult to treat clinically due to widespread tumor dissemination in the peritoneal cavity.
Methods We developed a clinically relevant, genetically induced, peritoneal carcinomatosis model that recapitulates the histological morphology and immunosuppressive state of the tumor microenvironment of metastatic peritoneal HGSCs by intraperitoneally injecting shp53, AKT, c-Myc, luciferase and sleeping beauty transposase, followed by electroporation (EP) in the peritoneal cavity of immunocompetent mice (intraperitoneal (IP)/EP mice).
Results Similar to the spread of human ovarian cancers, IP/EP mice displayed multiple tumor nodules attached to the surface of the abdomen. Histopathological analysis indicated that these tumors were epithelial in origin. These IP/EP mice also displayed a loss of CD3+ T cell infiltration in tumors, highly expressed inhibitory checkpoint molecules in tumor-infiltrating and global CD4+ and CD8+ T cells, and increased levels of transforming growth factor-β in the ascites, all of which contribute to the promotion of tumor growth.
Conclusions Overall, our tumor model recapitulates clinical peritoneal HGSC metastasis, which makes it ideal for preclinical drug screening, testing of immunotherapy-based therapeutics and studying of the tumor biology of peritoneal carcinomatosis.
- translational medical research
- vaccination
- immunotherapy
This is an open access article distributed in accordance with the Creative Commons Attribution Non Commercial (CC BY-NC 4.0) license, which permits others to distribute, remix, adapt, build upon this work non-commercially, and license their derivative works on different terms, provided the original work is properly cited, appropriate credit is given, any changes made indicated, and the use is non-commercial. See http://creativecommons.org/licenses/by-nc/4.0/.
Statistics from Altmetric.com
Background
Although accounting for only 3%–5% of all cancers in women, ovarian cancer is a leading cause of cancer death in the female genital tract. In the USA, approximately 22 530 new cases of ovarian cancer were diagnosed in 2019, with roughly 13 980 deaths.1 Different from certain malignancies such as endometrial endometrioid carcinoma that have physical barriers preventing tumor spread, tubal and ovarian carcinomas, especially high-grade serous carcinoma (HGSC), exhibit a distinct pattern of dissemination by intraperitoneal (IP) spread. In fact, approximately 75% of patients with ovarian cancer have advanced stage disease by the time the symptoms become apparent.2 Involving both pelvic and abdominal peritoneum, these tumors commonly spread along peritoneal surfaces including the mesentery, diaphragm, omentum and surfaces of solid organs such as liver and spleen. It has been reported that less than 25% of patients with stage III/IV HGSCs will be cured by current therapies and the median survival for stage IV is 23 months.2 Thus, there is a great need for novel approaches to treat this tumor.
A genome-wide analysis of HGSC by The Cancer Genome Atlas project revealed TP53 mutations in nearly all tumors (96%).3 As a caretaker tumor suppressor gene, mutations of TP53 gene will lead to genomic instability, aberrant regulation of DNA damage response and apoptosis, and eventually carcinogenesis. We reason that, additional driving events, especially genetic alterations of gatekeeper oncogenes and other caretaker tumor suppressor genes, facilitate the progression of TP53 mutated precursor lesions, serous tubal intraepithelial carcinoma, to invasive carcinoma.3 In fact, overexpression of c-Myc and dysregulation of PI3K/AKT pathway have been reported to actively involve development and progression of HGSCs.4–6 To better understand the oncogenesis of ovarian cancer, we have previously developed a genetic defined murine ovarian cancer model system that recapitulates initiation and development of human epithelial ovarian cancer.7–10 These genetically defined mouse ovarian epithelial tumor cell lines contain various combinations of genetic alterations in the p53, BRCA1, c-Myc, K-ras and AKT genes. While this system allows us to define the minimal requirement for tumor development and has been widely used to test molecule-based and/or pathway-based target therapy and immunotherapy, an ex vivo manipulation is thought to be different from a physiological tumorigenic microenvironment. More recently, recognition of fallopian tube epithelium as the origin of most, if not all, HGSCs allow us to reconsider the pathobiology of this disease.11 12 Importantly, mouse models based on transformation of tubal epithelium have recently been reported.13–15 Nevertheless, a model system that recapitulates tumor initiation and progression in a natural environment, easy to manipulate and encompasses diverse and flexible genetic combination, is still lacking.
The sleeping beauty (SB) transposon-based mutagenesis system is a synthetic transposable element composed of a transposon DNA substrate and a transposase enzyme, offering an approach to target mutagenesis to somatic cells of a given tissue.16–18 This system uses a conditionally expressed transposase to insert transposon DNA into a TA-dinucleotide of the host genomic DNA in a cut-and-paste manner. In fact, SB-based mouse models of cancer have provided an ideal system in which to test the molecular mechanisms of tumor initiation and sensitivity to pathway-targeted therapy.19–21 We have developed a preclinical, spontaneous, HPV16 buccal tumor model using submucosal injection of oncogenic plasmids expressing HPV16 E6/E7, NRas G12V , luciferase and SB transposase, followed by electroporation (EP) in the buccal mucosa.22 In this study, we describe a clinical relevance, genetically induced, peritoneal carcinomatosis model that recapitulates the histological morphology and immunosuppressive tumor microenvironment (TME) of metastatic peritoneal cancers with features consistent with HGSC. We further demonstrated that these mice develop immunosuppressive TME but maintain the systemic immunity.
Methods
Mice
A 6-week-old female C57BL/6 (B6) and athymic nude mice (CrTac:NCr-Foxn1nu) were purchased from Taconic Biosciences (Derwood, Maryland, USA). NSG mice (NOD.Cg-Prkdcscid Il2rgtm1Wjl /SzJ) were purchased from the Jackson Laboratory (Bar Harbor, Maine, USA). All mice were maintained under specific pathogen-free conditions at the Johns Hopkins University School of Medicine Animal Facility (Baltimore, Maryland, USA).
EP tumor model
To induce tumor formation in the peritoneal cavities of immunodeficient and immunocompetent mice, oncogenes and the SB transposase (10 µg/plasmid) were diluted in 500 µL of PBS and IP injected to the mice. The mice were anesthetized by intramuscular injection of ketamine. The plasmids injected mice were EP by the BTX ECM 830 square wave EP generator (BTX) (5 pulses, 200 V for 100 ms/pulse, 100 ms intervals between each pulse), the caliper electrode (BTX) was held on the waist of mouse. The mice were followed by IVIS imaging weekly for tracking tumor growth. To ensure the mice were not suffering from the later stages of tumor growth, the mice were sacrificed when the bioluminescence signal either reached 109 p/s/cm2/sr or had enlarged abdomens due to the production of ascites.
In vivo bioluminescence image
To track genetically induced peritoneal tumor growth, in vivo bioluminescence imaging was performed by the IVIS Series 2000 (PerkinElmer). The plasmid of SB transposase also harbored the luciferase gene, which could be detected in transfected cells. Briefly, the mice were IP injected with D-luciferin (GoldBio). After 10 mins of D-luciferin administration, the mice were anesthetized by isoflurane, and imaged by the IVIS Spectrum under the autoexposure mode. To quantify the luminescence signals, the peritoneal region in the displayed images were quantified as total photon counts using Living Image 3.0 Software (Xenogen).
Histological analysis and immunohistochemistry
Harvested tumor tissues were rinsed with PBS and fixed in 10% neutral-buffered formalin overnight at 4°C. Fixed sections (4 µm) were then sent to the Johns Hopkins University Oncology Tissue Services (Baltimore, Maryland, USA) and made into paraffin-embedded tissue blocks. H&E and Ki67 (D3B5; Cell Signaling Technology; Cat # 12202) staining of tissue sections were performed by the Johns Hopkins University Oncology Tissue Services. To characterize tumor histology, immunohistochemistry was performed with the following staining markers: antimouse CK14 (Proteintech, Cat #10 143–1-AP), p53 (Proteintech, Cat #21 891–1-AP), AKT (Proteintech, Cat #10 176–2-AP), c-Myc (clone: Y69, Abcam, Cat #ab32073) and secondary antibody (1:1000, poly-HRP Goat antirabbit IgG (H+L), Invitrogen, Cat #65–6120). The histology slides were reviewed by a board-certified gynecologic pathologist (DX) of the Pathology Department in the Johns Hopkins University School of Medicine.
Immunofluorescence
For immunofluorescence staining of tumor sections, formalin-fixed, paraffin-embedded tissue sections were stained to Alexa Fluor 488 antimouse CD3 antibodies (clone: 17A2, Biolegend, Cat # 100201). Nuclei were counterstained with 1 µM SYTOX Green (Thermo Fisher Scientific). Pictures were captured with the Nikon TE200E inverted microscope, and analyzed with the NIS-Elements V.5.0 software (Nikon).
Quantitative real-time PCR
Total RNA extraction was performed by the Direct-zol RNA Kits (Zymo Research) following the manufacturer’s instructions. 1 µL of RNA was converted to cDNA by the iScript Reverse Transcription Supermix (Bio-Rad Laboratories). One µL of cDNA was used as template for quantitative real-time PCR (qRT-PCR) using SsoAdvanced Universal SYBR Green Supermix (Bio-Rad Laboratories), and qRT-PCR was performed using CFX96 Touch Real-Time PCR Detection System (Bio-Rad Laboratories). Primer for RT-PCR experiments to detect mouse cancer antigen 125 (CA125) expression, forward 5'-TGCCACCTACCAGTTGAAAG-3'; reverse 5'-GTACCGCCAAGCAGATGAG-3', mouse mesothelin, forward 5'-ACCGACGAGGAACTGAATGCTCTT-3'; reverse 5'-ACGATGGACTCATCCAACACTGCT-3', mouse folate receptor 1 (FOLR1), forward 5'-AGCTGAGCACACACTTGGAG-3; reverse 5'-GACAACTGAAGGTAAAACAGG
AAC-3', WT-1, forward 5’-GGTATGAGAGTGAGAACCACACG-3’ reverse 5’-AGATGCTGACCGGACAAGAG-3’, PAX-8, forward 5’-GTTTGAGCGGCAGCATT
AC-3’; reverse 5’-GTAAGGGCAGTGGGTACAGC-3’, 18S rRNA, forward 5’- GTAACCCGTTGAACCCCATT-3’; reverse 5’- CCATCCAATCGGTAGTAGCG-3’ (Integrated DNA Technologies).
Flow cytometry
Peripheral blood was collected into EDTA-contained Eppendorf tubes from the facial vein. The red blood cells were lysed by the RBC lysis buffer (Biolegend), and peripheral blood mononuclear cells (PBMCs) were stained with the Zombie Aqua dye (Biolegend) for exclusion of dead cells. To determine the ratio of CD4 and CD8 T cells between naïve and triple oncogenic IP/EP mice, PBMCs were stained with Alexa Fluor 488 antimouse CD3 (clone: 17A2; Biolegend; Cat # 100201), PE anti-mouse CD4 (clone: RM4-5; BD; Cat #553049) and APC-R700 anti-mouse CD8 (clone: 53–6.7; BD; Cat #564983) antibodies. For T cell exhaustion staining, tumor-infiltrating lymphocytes (TILs) and splenic lymphocytes were isolated from the tumors and spleens of shp53, AKT, c-Myc and SB transposase IP/EP mice 30 days after plasmid EP. TILs and splenic lymphocytes were preincubated with antimouse CD16/CD32 antibodies (clone: 2.4G2: Bio X Cell, Cat # BE0307), then stained with FITC antimouse PD-1, PE-antimouse TIGIT, PE-Dazz594 antimouse CD44, PE-Cy5 antimouse NK1.1, PE-Cy7 antimouse LAG-3, APC antimouse CTLA-4, APC-R700 antimouse CD45, APC-Fire750 antimouse CD3, BV421 antimouse TIM-3, BV650 antimouse CD8 and BV785 antimouse CD4 (all the antibodies purchased form Biolegend). For T regulatory (Tregs) staining, Fc blocked TILs and splenic lymphocytes were stained with Alexa 488 antimouse CD3, PE-Cy7 antimouse CD25, BV421 antimouse CD45, BV785 antimouse CD4 antibody. After surface marker, cells were fixed and followed by permeabilization using eBioscience Foxp3/Transcription Factor Staining Buffer Set (Thermo Fisher). After permeabilization, cells were stained with APC antimouse Foxp3. For PD-L1 staining, PACS-1 cells were stimulated with 1 µg/mL of interferon-γ (IFNγ) (Prospec-Tany Technogene) or PBS as control overnight. The cells were washed and subsequently stained with antimouse PD-L1 (clone: 10F.9G2; Biolegend; Cat # 124311) antibodies. Flow cytometry was performed by the CytoFLEX S Flow Cytometer (Beckman Coulter), and analyzed using the FlowJo V.10.6 software (TreeStar).
ELISA
For the detection of transforming growth factor-β (TGFβ), IL-10 and IL-35, ascites was collected from tumor-bearing triple oncogene IP/EP mice by 18-gauge needles before they were sacrificed. For the double oncogene IP/EP and naïve mice, 3 mL of PBS was IP injected to the mice and mix gently for 1 min, followed by removal of the peritoneal washed fluid by 18-gauge needles. TGFβ levels were measured from the cell-free ascites using LEGEND MAX Total TGF-β1 ELISA Kit (Biolegend), IL-10 levels were measured by the Mouse IL-10 ELISA Kit (Thermo Fisher), and IL-35 levels were measured by the LEGEND MAX Mouse IL-35 Heterodimer ELISA Kit (Biolegend) following the manufacturers’ instructions.
Generation of primary cultures tumor cell line
Tumor nodules were excised from IP/EP mice with shRNA-p53 and two oncogenes. These noduls were then minced into 1–2 mm pieces, digested with serum-free RPMI-1640 medium containing collagenase I (0.8 mg/mL; Sigma-Aldrich, Cat #C9891), collagenase IV (0.8 mg/mL; Sigma-Aldrich, Cat #C5138), DNase I (100 µg/mL; Sigma-Aldrich, Cat #DN25-g), incubated at 37°C for 20 min and dissociated by gentleMACS Dissociator (Miltenyi Biotec). The tumor digest was washed with 10% FBS, 1% penicillin (100 U/mL), streptomycin (100 mg/mL), 1% MEM non-essential amino acids and 1% sodium pyruvate-containing DMEM medium (Thermo Fisher). Washed tumor cells were cultured in complete DMEM medium and passaged every 2–3 days. To test the tumorigenicity of primary cultured cells, 5×10⁵ cells PBS-washed PACS-1 cells were resuspended in 100 µL of PBS, and then IP or subcutaneously injected into B6 mice.
Statistical methods
All statistical analyses were performed with the GraphPad Prism V.6 software. Kaplan-Meier survival plots were constructed to estimate survival percentages. Comparisons between individual data points were analyzed by Student’s t-tests. A p<0.05 was considered statistically significant.
Results
A combination of shRNA-p53 with two oncogenes is able to generate genetically induced peritoneal tumors in immunodeficient mice
To model clinical peritoneal carcinomatosis, we first tested whether p53 suppression with AKT and c-Myc overexpression are able to generate genetically induced peritoneal tumors in immunodeficient mice. Previously, we developed an HPV16 +oral tumor mouse model by integrating oncogenes via SB transposase.22 Taking advantage of this model, we IP injected the oncogenes and SB transposase plasmids into the peritoneal cavities of athymic nude mice, followed by EP. The SB transposase plasmid encoded for the luciferase enzyme, which allowed for tracking of the transfected cells by bioluminescence imaging. Based on luciferase activity, we found that these mice generated genetically induced peritoneal tumors and hemorrhagic ascites with 100% penetrance, only 21 days after plasmid EP (figure 1A–C). The tumors were found attached to the outside of the organs in the peritoneal cavity and also suspended in the ascites (figure 1C). The histological analyses of the tumors suggest a carcinoma morphology, signified with round-shaped cells and multiple prominent nucleoli (figure 1D,E). These data indicated that the combination of p53 suppression with AKT and c-Myc overexpression in the peritoneal cavity resulted in aggressive peritoneal tumor growth with full penetrance and a short tumor formation period.
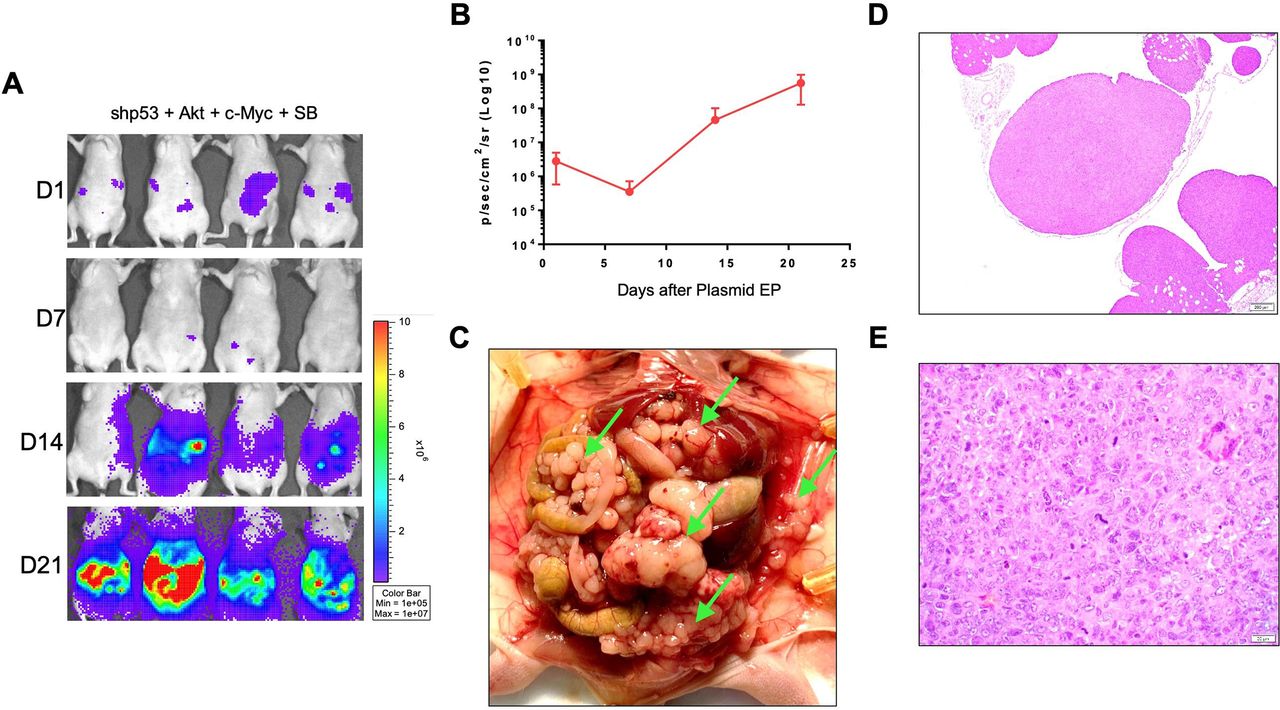
Generation of genetically induced peritoneal tumors in immunodeficient mice. Immunodeficient, athymic nude mice (NCR, n=4) were IP injected with plasmids encoding for shp53, constitutively activate AKT, c-myc, luciferase and SB transposase followed by EP in the abdominal region. The bioluminescence intensity was measured by IVIS weekly. (A) Representative IVIS imaging of the mice. (B) Quantification of bioluminescence intensity in the abdominal region. (C) Representative photos of tumor nodules and tumors dissemination in the peritoneal cavities of mice IP injected with plasmids, followed by EP. The mice were sacrificed 21 days after plasmid EP. Tumor nodules are indicated by green arrows. (D–E) Representative H&E staining of tumor nodules from IP/EP mice on day 21 at (D) ×50 magnification and (E) ×400 magnification. EP, electroporation; IP, intraperitoneal; SB, sleeping beauty.
Loss-of-p53 function and gain-of-AKT/c-Myc function are required for peritoneal carcinomatosis in immunocompetent mice
Based on our results showing that the combination of p53 suppression and overexpression of AKT and c-Myc was able to generate peritoneal tumors in immunodeficient mice, we next sought to define whether this combination can induce tumor formation in immunocompetent mice. To define the minimal requirement for carcinogenesis in a given time interval, we injected different combination of oncogenic plasmids IP into the peritoneal cavity of the C57BL/6 mice. Mice receiving shRNA-p53, AKT, c-Myc and SB transposase rapidly developed tumor with significantly increased luminescence signals after plasmid EP with 100% penetrance (figure 2A,B and online supplementary figure S1). In contrast, the luminescence signal of mice decreased over time when they received a combination of only two of the plasmid modifications (shRNA-p53, AKT and c-Myc), indicating that the EP plasmids were cleared over time by the immunocompetent mice. Only one of three mice receiving AKT and c-Myc generated tumors in the peritoneal cavity with a slower tumor growth rate and less aggressive behavior compared with those with all three genetic hits (figure 2A–C). Correlated with the intensity of luminescence signals, the mice with three genetic changes developed tumors at multiple peritoneal locations including the fallopian tube, ovaries, uterine serosa and mesentery, as well as ascites within 40 days of EP (figure 2D–F). Moreover, the same mice that underwent three genetic changes had the worst prognoses compared with those receiving only two of the three plasmids (shRNA-p53, AKT and c-Myc) (figure 2C). These results are consistent with prior studies that indicated that oncogenic AKT and c-Myc transform primary mouse ovarian epithelial cells derived from p53-deficient mice into malignant tumor cells.7 Together, our results indicate that AKT and c-Myc overexpression are required for peritoneal carcinogenesis and that p53 suppression enhances and promotes the tumorigenic process. Importantly, suppression of p53 and overexpression of AKT and c-Myc are able to overcome immunosurveillance and induce peritoneal tumors in immunocompetent mice.
Supplemental material
Supplemental material

shp53, AKT and c-myc overexpression induces the growth of genetically induced peritoneal tumors in immunocompetent mice. B6 mice were IP injected with either a concoction of triple oncogene plasmids (shp53 +AKT+c-Myc +SB13) or a concoction of double oncogene plasmids (either shp53 +AKT+ SB13, shp53 +c-Myc+SB13 or Akt +c-Myc+SB13), followed by EP in the abdominal region. The bioluminescence intensity was measured by IVIS Weekly. (A) Real-time bioluminescence images of mice receiving either shp53 +AKT+c-Myc +SB13 (n=8), shp53 +AKT+ SB13 (n=3), shp53 +c-Myc+SB13 (n=3) or AKT +c-Myc+SB13 (n=3) plasmid concoctions. (B) Quantification of bioluminescence intensity in the abdominal region. (C) Kaplan-Meier survival analysis of mice. (D) Representative images of peritoneal dissemination from mice receiving triple oncogene plasmids. (E) Images of reproductive organs attached with tumors from mice receiving triple oncogene plasmids. (F) Images of mesentery tumor nodules from mice receiving the triple oncogene concoction. Tumor nodules are indicated by green arrows. Mice were sacrificed 33 days after plasmid EP. EP, electroporation; IP, intraperitoneal; SB, sleeping beauty.
Characterization of tumors from shRNA-p53, AKT and c-Myc IP/EP mice
Similar to human HGSC spread, the murine tumor nodules grew on the surface of different peritoneal organs, including the mesothelial lining of the peritoneum, intestinal mesentery and serosa of the uterus (figure 3A,B). Notably, the ovarian surfaces and parenchyma as well as the fallopian tubes surrounded by tumors. Histologically, the tumors displayed morphologies typical of human HGSC, illustrated by papillary structures and coagulative tumor cell necrosis in the low power (figure 3A) and significant cytologic atypia and pleomorphism in the high power (figure 3C,D). The tumors exhibited high proliferation rates with significantly increased Ki67 proliferation indices (figure 3E,F). The tumors expressed epithelial markers such as CK14, indicating an epithelial origin (figure 3G,H). Immunohistochemical staining also demonstrated a loss of p53 expression (figure 3I,J) and overexpression of both c-Myc (figure 3K,L) and AKT (figure 3M,N). These results indicate that our IP/EP preclinical model recapitulates the initiation, progression and late-stage metastasis of human HGSCs.
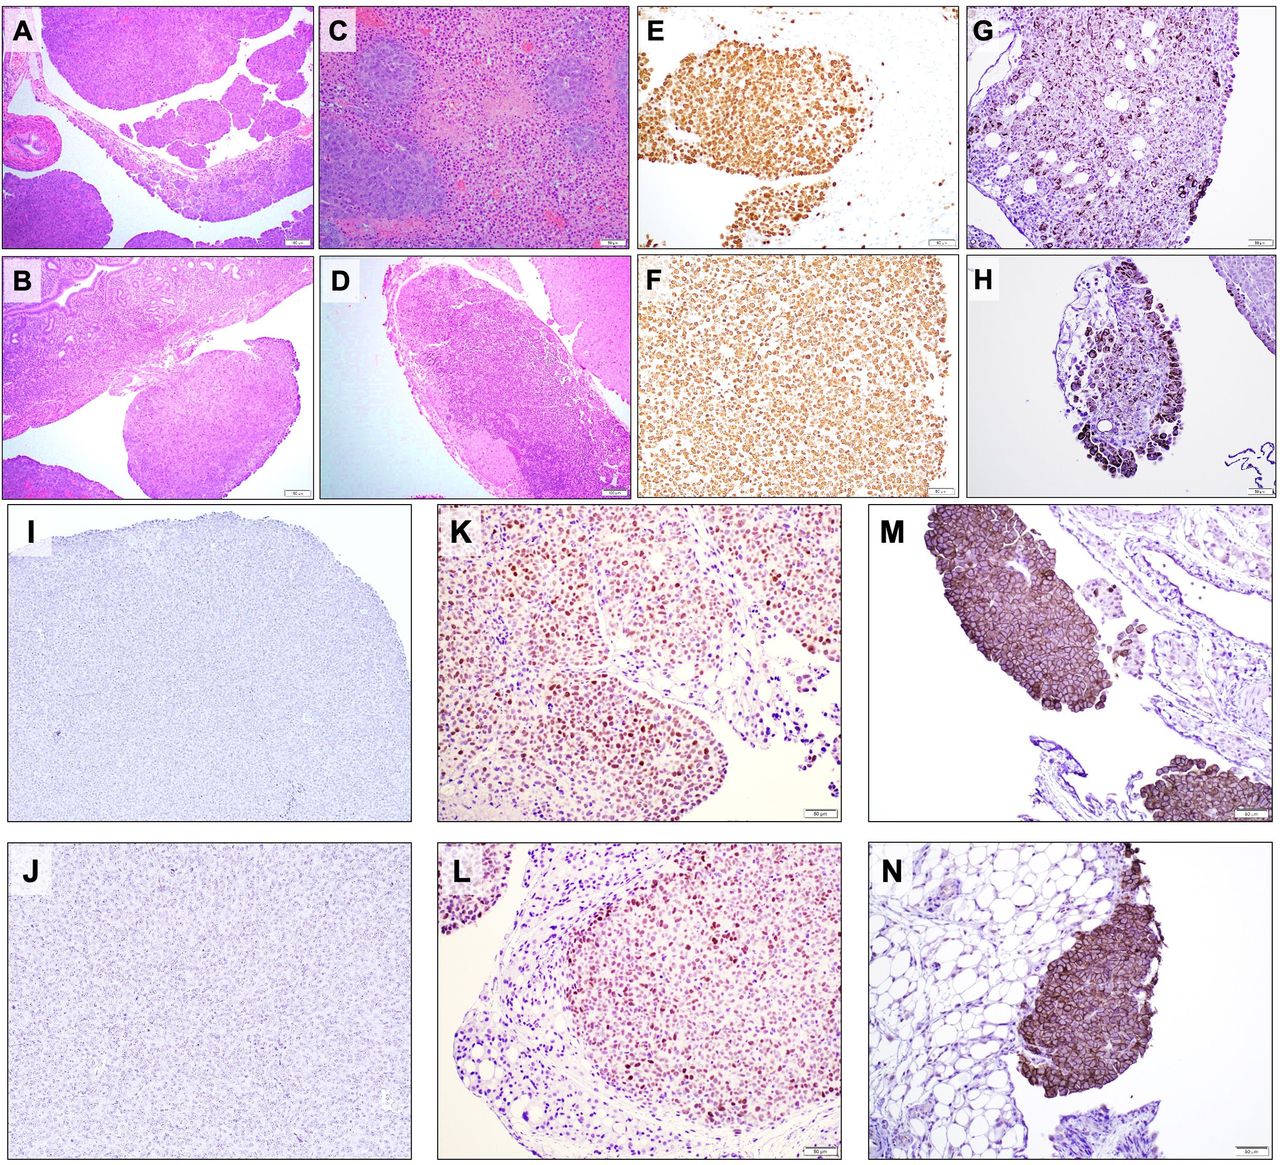
Characteristics of the genetically induced peritoneal tumors. Tumor tissues were harvested on day 33 after plasmid EP from mice receiving triple oncogene plasmids. Formalin-fixed, paraffin-embedded peritoneal cavity tumor sections were stained with (A–D) H&E, (E, F) Ki67, (G, H) CK14, (I, J) p53, (K, L) c-myc, and (M, N) AKT. EP, electroporation.
shRNA-p53, AKT and c-Myc IP/EP mice developed immunosuppressive TMEs but maintained their systemic immunities
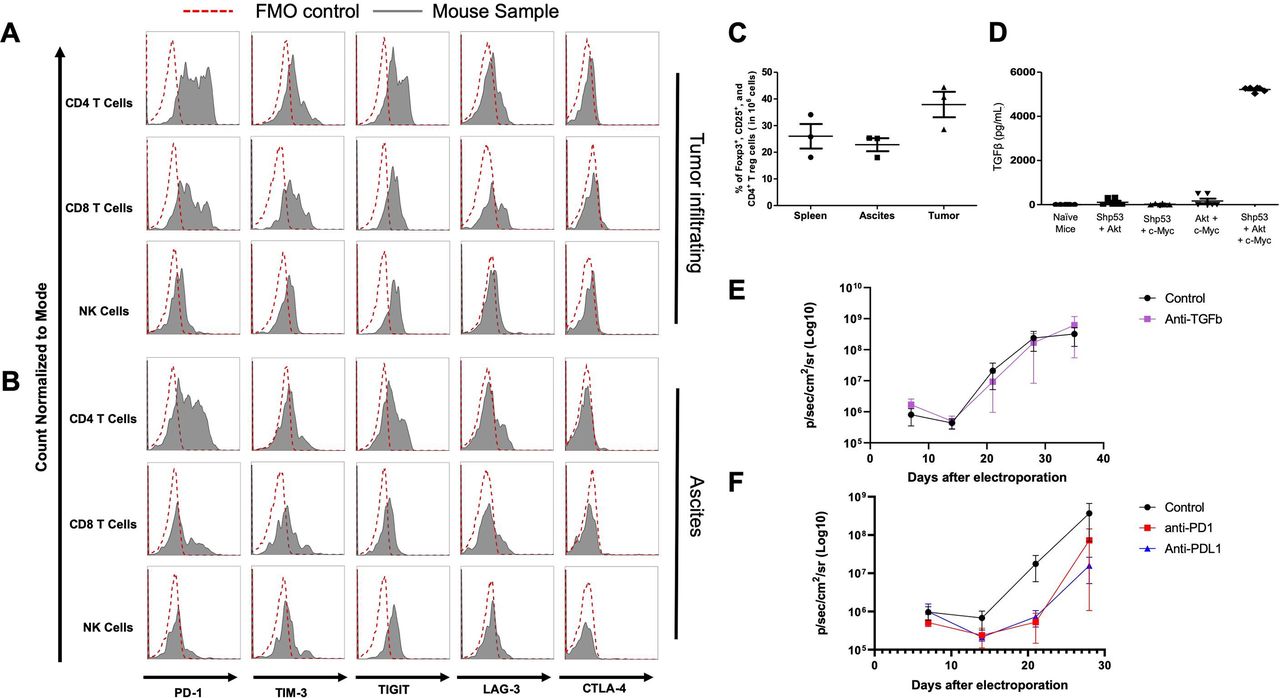
To characterize shRNA-p53, AKT and c-Myc IP/EP mice as a preclinical drug testing model, we further examined their immune responses. The IP/EP mice with triple genetic changes maintained comparable levels of CD4 and CD8 T cells in the peripheral blood in comparison with naïve mice (online supplementary figure S2A–C). However, tumors harvested from these mice exhibited high immunosuppressive TMEs that lacked CD3+ cells in the tumor tissues (online supplementary figure S2D). Cancer-induced T cell exhaustion had been found to promote tumor progression by upregulating inhibitory checkpoint molecules,23 24 such as PD-1,25 26 TIM-3,27 TIGIT,28 LAG-329 and CTLA-4.26 To explore the statuses of these inhibitory checkpoint molecules in the TME of these IP/EP mice, TILs were isolated from either IP/EP tumors or ascites. These TILs displayed highly expressed PD-1, TIM3 and TIGIT in both CD4+, and CD8 +T cells (figure 4A,B, online supplementary figure S2F,G). Expression levels of LAG-3 and CTLA-4 had not changed in both tumor-infiltrating CD4 +and CD8+T cells compared with the fluorescence minus one (FMO) controls (figure 4A,B, online supplementary figure S2F,G). We also observed that inhibitory checkpoint molecules had no differences in NK cell expressions compared with the FMO controls (figure 4A,B, online supplementary figure S2E–G). To investigate the global lymphocyte exhaustion in IP/EP mice, lymphocytes were isolated from the spleens of IP/EP mice. PD-1 had upregulated in both splenic CD4 +and CD8+T cells (online supplementary figure S2E and H). We also found that Tregs were highly prevalent in the tumors, ascites and spleens of IP/EP mice; this is especially true in the tumors, in which we observed ~40% Tregs (figure 4C and online supplementary figure S2I).30 These results showed that triple genetic changes induce T cell exhaustion and upregulate Tregs in IP/EP mice, and may contribute to peritoneal tumorigenesis.
Supplemental material
Supplemental material

Analysis of the immune response of mice receiving triple oncogene plasmids. (A, B) Characterization of lymphocyte exhaustion profiles in tumors and ascites. CD4, CD8 and NK cells were isolated from either the (A) tumors or (B) ascites of IP/EP mice (n=4) 30 days after plasmid EP. Lymphocytes isolated from tumors and ascites were stained with exhaustion markers: PD-1, Tim-3, TIGIT, LAG-3 and CTLA-4, then analyzed by flow cytometry. The FMO control is indicated by the red-dotted lines. IP/EP mice samples are indicated by the gray solid lines. (C) Summary of Treg percentages in tumors, ascites and spleens. (D) Quantification of TGFβ expression levels in ascites. TGFβ expression levels in either the ascites and in the peritoneal washing fluid were analyzed by ELISA. (E–F) IP/EP mice (n=5) treated with antimouse (E) TGFβ, (F) PD-1, or PD-L1 antibodies. Antimouse TGFβ (5 mg/kg), PD-1 (10 mg/kg) or PD-L1 (10 mg/kg) neutralizing antibodies were administered IP on days 7, 9, 11, 14 and 16 after plasmid EP. Mice were measured their bioluminescence intensity by IVIS Weekly. EP, electroporation; IP, intraperitoneal; TGFβ, transforming growth factor-β.
It has been demonstrated that TGFβ functions as an immunosuppressive cytokine by inhibiting immunosurveillance in many types of cancer, including ovarian cancer.31 Some studies show TGFβ level dramatically increases in the ascitic fluid from late stage HGSC patients.32 To determine whether TGFβ induced the immunosuppressive TMEs, we collected the ascites from these IP/EP mice and injected PBS to wash the peritoneal cavities of mice with two genetic changes, with naïve mice serving as control. The level of TGFβ was subsequently analyzed and compared. TGFβ levels were significantly upregulated in the ascites of shRNA-p53, AKT and c-Myc IP/EP mice compared with the peritoneal-washed PBS of the IP/EP mice with either two genetic changes or naïve mice (figure 4D). Next, we verified whether other cytokines were manipulated in the immunosuppressive TMEs of IP/EP mice. IL-10 and IL-35 expression levels were detected by ELISA. However, both cytokines were non-detectable in the ascites from each oncogenic combination of IP/EP mice (online supplementary figure S2J,K). Although the TMEs of shRNA-p53, AKT and c-Myc IP/EP mice were immunosuppressive, the primary cultured tumor cells responded to the IFNγ that upregulated PD-L1 expression (online supplementary figure S2L). These results indicated TGFβ upregulation in shRNA-p53, AKT and c-Myc IP/EP mice may contribute to immunosuppressive TMEs and promote tumor formation, while still maintaining systemic immunity. Thus, the mice bearing these changes may be used as a model for immunotherapy in that the IFNγ signaling pathway has not been silenced in this system.
To further clarify the roles of TGFβ and inhibitory checkpoint molecules in promoting tumorigenesis, antiTGFβ neutralizing antibodies were administered to IP/EP mice. We found that TGFβ neutralization did not attenuate tumor growth compared with the untreated control group (figure 4E). We also used anti-PD-1 and anti-PD-L1 antibodies to block the interaction between PD-1 and PD-L1. Although our results suggested no significant differences in anti-PD-1, anti-PD-L1, and untreated control groups, both anti-PD-1 and anti-PD-L1 groups delayed the early stage of tumor growth in IP/EP mice (figure 4F).
Primary cultured tumor cells exhibited aggressive tumorigenicity with clinically relevant tumor markers
To further characterize the histopathological nature of the tumors from shRNA-p53, AKT and c-Myc IP/EP mice, we harvested the tumors, dissociated them with enzymes and cultured the cells in 10% FBS-containing DMEM media. The primarily cultured peritoneal tumor cells were either polygonal or oval (figure 5A). This tumor cell line was designated as PACS-1 and contained shRNA-p53, AKT, c-Myc and SB13. To confirm the tumorigenicity of the PACS-1 line, we either IP or subcutaneously injected these cells into C57BL/6 mice. The bioluminescence intensity and the tumor growth curve indicated that PACS-1 cells had the capacity to form tumors in the peritoneal cavity (figure 5B–D) and subcutaneously (figure 5E). The tumor from the mice injected with PACS-1 cells displayed similar growth patterns to those of the EP mice but appeared to be more aggressive in that these mice died sooner after injection. Detection of certain tumor markers not only helps define the histopathological type of a particular lesion, but it also predicts potential therapeutic targets for immunotherapy. To this end, we evaluated the expression level of CA125, mesothelin, FOLR1, Wilms' tumor 1 (WT1) and PAX8 (figure 5F). Quantitative PCR analyses showed that all of the above-mentioned tumor markers can be detected in the PACS-1 cells and the tumor tissues from shRNA-p53, AKT and c-Myc IP/EP mice. Expressions of CA125, WT-1 and PAX8 defined a gynecologic origin, consistent with HGSC. In contrast, detectable expressions of FOLR1 and mesothelin provided therapeutic value for target therapy and immunotherapy.

The primary cultured genetically induced peritoneal tumor cell line is tumorigenic in immunocompetent mice. (A) Morphology of primary cultured genetically induced peritoneal tumor cells (PACS-1). (B–D) 5×10⁵ PACS-1 cells were IP injected in B6 mice (n=3). (B) Real-time bioluminescence image of mice IP injected with PACS-1. (C) Quantification of bioluminescence intensity in the abdominal region. (D) Representative image of peritoneal dissemination. Tumor nodules are indicated by green arrows. (E) Tumor growth curve of PACS-1. Specifically, 5×10⁵ PACS-1 cells were subcutaneously injected on the belly of B6 mice (n=5). (F) CA125, Mesothelin, FOLR1, WT1 and PAX8 mRNA expression in muscle, PACS-1 cells, and EP tumors (n=3). mRNA expression level was analysed by qRT-PCR. CA125, cancer antigen 125; EP, electroporation; IP, intraperitoneal; WT1, Wilms' tumor 1.
Gain of function of p53 oncogenic mutant, AKT and c-Myc-induced carcinogenesis in NSG mice
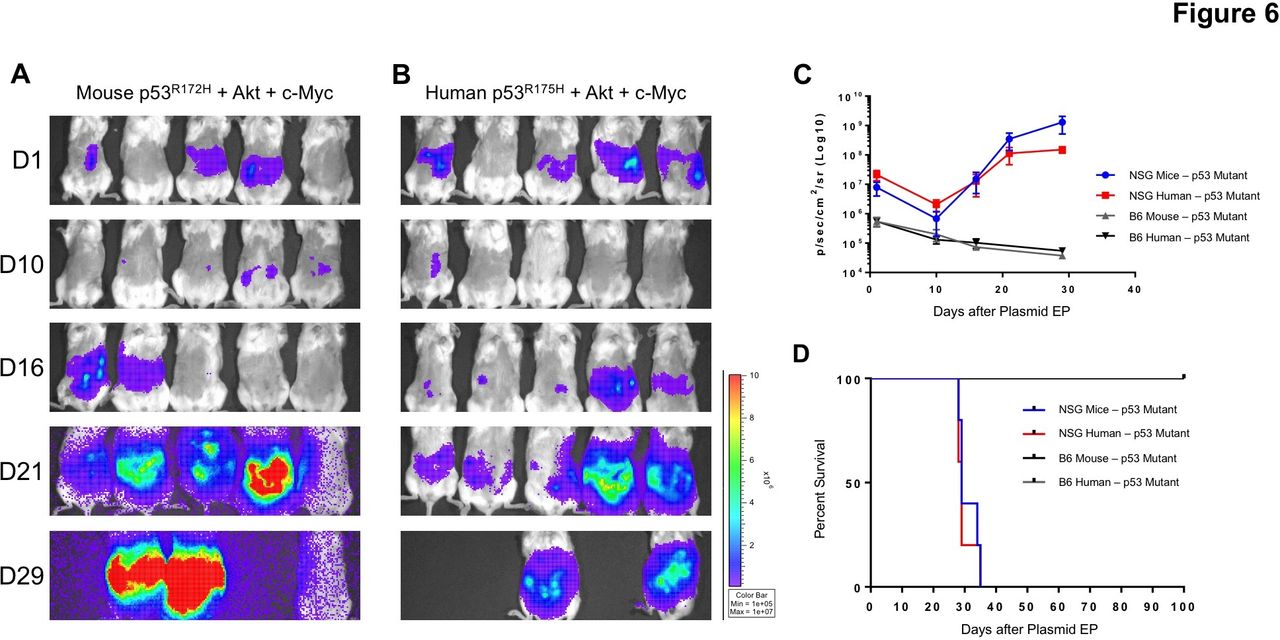
We have demonstrated that knocking-down p53 and overexpressing AKT and c-Myc resulted in carcinogenesis in both immunodeficient and immunocompetent mice. It has been documented that p53 somatic mutations occur in more than half of human cancers.33 Some missense p53 mutant proteins not only lose tumor suppressive functions, but also gain oncogenic capacity, such as a R175H mutation. To establish a tumor model with a clinically relevant p53 mutant (p53R175H in human or p53R172H in mouse), we injected either p53R175H or p53R172H and AKT, c-Myc and SB13 IP into either C57BL/6 mice or NSG mice, followed with EP. Both the human and mouse p53 mutant promoted peritoneal tumorigenesis in NSG mice within 3 weeks (figure 6A,B). The tumors developed from NSG mice with a mouse p53 mutant (online supplementary figure S2A–C) displayed similar morphologies and growth patterns to p53-knockdown IP/EP mice (figure 2A,B), illustrated by the many tumor nodules disseminated throughout the peritoneal cavity. Although the human p53 mutant-induced tumor formation in the peritoneal cavity (online supplementary figure S2D,E), these tumors rarely spread. Histopathologically, the tumors from either human or mouse p53 mutant IP/EP mice displayed similar morphologies and were of epithelial origin (online supplementary figure S2B,C,E,F). In contrast, neither human or mouse p53 mutants led to tumor formation in C57BL/6 mice. Unlike the p53 knockdown IP/EP mice, luminescence signals in the p53 mutant IP/EP mice decreased over time and remained alive during the observed time frame (figure 6C,D).

Either mouse or human p53 mutants in combination with AKT and c-myc resulted in genetically induced peritoneal tumor formation in NSG mice. NOD.Cg-Prkdcscid Il2rgtm1Wjl/SzJ (NSG) and B6 mice were IP injected with either mouse p53R172H or human p53R175H mutants in combination with AKT, c-myc and SB transposase plasmids, followed by EP in the abdomen area. Shown here are the real-time bioluminescence images of mice receiving either (A) mouse p53R172H+AKT+c-Myc +SB (n=5) or (B) human p53R175H+AKT+c-Myc +SB. (C) Quantification of bioluminescence intensity from either IP/EP NSG or B6 mice. (D) Kaplan-Meier survival analysis of mice. EP, electroporation; IP, intraperitoneal; SB, sleeping beauty.
Discussion
Here in this study, we develop an immunocompetent, preclinical, genetically induced peritoneal carcinomatosis model by EP of plasmids encoding shRNA targeting p53, AKT, c-Myc, luciferase and SB transposase genes in peritoneal cavity. This tumor model forms metastatic peritoneal tumors with hemorrhagic ascites in the abdomen within 3 weeks of initial inoculation, displaying a clinically relevant phenotype and expressing tumor markers that resemble human HGSCs. Importantly, the tumors developed in immunocompetent B6 mice generate immunosuppressive TMEs that mimic human tumor progression. Easily monitoring of the tumor progression and a nearly 100% tumor formation rate allow this system to be used as an ideal preclinical model for testing pathway-based and molecule-based therapeutics and immunotherapy.
Most of the current peritoneal metastatic tumor models use IP or intravenous injection of tumor cell lines into immunocompetent or immunodeficient mice.34 Because some xenograft models are unable to elicit real antitumor immunity similar to those of immunodeficient mice, they are not suitable for investigating immunotherapies. On the other hand, while syngeneic tumor cell lines can generate tumors in immunocompetent mice, these models cannot recapitulate a physiological microenvironment for a stepwise tumor initiation, progression and spread in the abdominal cavity. Genetically engineered mouse models (GEMMs) present de novo cancer progression and metastasis in immunocompetent mice. However, the drawbacks of GEMMs include the long-period breeding of transgenic mice, especially multiple transgenes in one model.34–36 Thus, our model provides an easy, time-efficient and low-cost method to induce peritoneal tumors in immunocompetent hosts.
This study is based on our previous HPV buccal tumor model using the SB transposase system and EP.22 The main difference between the two models is that, compared with the prior model, immune depletion is not required in the early stage of tumor formation in the current peritoneal tumor model system. We speculate the oncogenes that we introduced to the mice are less immunogenic compared with those of HPV antigens. Besides, it has been demonstrated that the Myc oncogene is able to induce immunosuppression in the TME to promote cancer progression by upregulating immunosuppressive cytokines and chemokines.37 Moreover, DNA methyltransferase inhibitor and histone deacetylase inhibitor combination therapy reverses the immunosuppressive TME in the lung cancer model through Myc suppression.38 Based on these studies, we reason that c-Myc may play an important role in contributing to the immunosuppressive state of the TME in our model. Our results also indicate highly immunosuppressive TME in the IP/EP mice, as evidenced by the high levels of TGFβ in ascites and poor T cell infiltration in tumor. The other difference between two models is the morphology. Notably, the current model displays morphological features of HGSCs rather than sarcoma. We suspect the different injection sites might be a reason for the histopathological differences. IP injection allows the oncogenic plasmids to easily contact with epithelial cells surface compared with subcutaneous injection. Furthermore, we replaced Ras with AKT because the latter is closely related to carcinoma morphology based on our previous findings.22 Hence, the combination of AKT with shRNA-p53 and c-Myc cooperatively accelerates tumor growth, confers a carcinomatous phenotype, and develops peritoneal tumors in immunocompetent B6 mice.
It is of interest that, unlike the p53 knockdown IP/EP mice, neither human or mouse p53 mutants led to tumor formation in C57BL/6 immunocompetent mice. One study showed that TILs from patients with cancer were able to recognize the p53 mutants as neoantigens, including the R175H mutant.39 We speculate that both human and mouse p53 mutants are immunogenic and recognized by the immune system of immunocompetent C57BL/6 mice. Nevertheless, our results demonstrated clinically relevant p53 mutants could induce tumor formation in NSG mice, which may be used in testing non-immune-based therapeutic strategies.
Immunotherapies, such as vaccines, immune checkpoints, adoptive T cell transfers, antibodies and cytokine therapies, are promising strategies for the cancer treatment.40–43 However, a significant proportion of patients present no response to immunotherapy and may even experience severe adverse effects.44 45 Our qPCR analysis data indicated the IP/EP mouse model expresses several tumor markers, such as CA125, mesothelin, FOLR1 and WT1. CA125 and its receptor mesothelin are highly expressed in epithelial ovarian cancer, pancreatic cancer, mesothelioma and gastrointestinal cancers. These proteins are also used as serum tumor markers for screening of ovarian cancer and monitoring the effects of treatment.46–50 Many clinical trials and experimental therapies have targeted these two tumor markers, including vaccine, CA125/MUC16- or mesothelin-specific antibody and CAR T cell therapy.51–56 Therefore, with these markers highly expressed in our model, this novel system physically recapitulates human HGSC development and spread, allowing for the preclinical screening of new therapies targeting CA125, mesothelin and many other markers.
One major limitation of this model system is the tumor’s obscure origin. It has been proposed that the origin of most, if not all, human HGSC is the fallopian tube, especially in the tubal fimbriae.11 12 Consistent with this hypothesis, several mouse model systems have been successfully generated by the tissue-specific transformation of tubal epithelia to recapitulate human HGSC initiation.13–15 Likewise, we observed nearly all tumors in our system involved fallopian tube and paratubal/paraovarian tissue. However, since it is not possible to EP plasmids to specific cell types, such as tubal epithelia, the origin of these tumors remains obscure. Nevertheless, high expression of HGSC markers in these tumors suggest a shared histopathological origin and transformation pathway between human and mouse tumors.
Conclusions
In conclusion, we have established and characterized this preclinical peritoneal carcinomatosis model that resembles human HGSC development, providing a platform for preclinical drug screening of peritoneal metastasis and for the testing of immunotherapies. Our method also can be used to investigate the initiation and progression of peritoneal metastasis via switching different oncogenes, in order to identify the key player in cancer metastasis.
Supplemental material
Acknowledgments
We would like to thank Christopher Carter Polston and Sheridia Daniels for administrative support, and T.C. Wu for critical review and helpful discussion.
References
Footnotes
DX and C-FH contributed equally.
Contributors S-HT contributed to the design of the study, performance of the experiments and the writing of the manuscript; S-TP contributed to the performance of the experiments; BL contributed to the performance of the experiments; Y-CT contributed to the performance of the experiments; MAC contributed to the writing and preparation of the manuscript; EF contributed to the writing and preparation of the manuscript; DX contributed to the design of the study and writing of the manuscript and C-FH contributed to the design of the study.
Funding This work was supported by the National Institutes of Health under award numbers R01CA233486 and R01CA237067.
Competing interests None declared.
Patient consent for publication Not required.
Ethics approval All animal procedures were performed according to protocols approved by the Johns Hopkins Institutional Animal Care and Use Committee.
Provenance and peer review Not commissioned; externally peer reviewed.
Data availability statement All data relevant to the study are included in the article or uploaded as online supplementary information.