Article Text

Abstract
Background Only certain disseminated cells are able to grow in secondary organs to create a metastatic tumor. Under the hypothesis that the immune microenvironment of the host tissue may play an important role in this process, we have categorized metastatic samples based on their immune features.
Methods Gene expression data of metastatic samples (n=374) from four secondary sites (brain, bone, liver and lung) were used to characterize samples based on their immune and stromal infiltration using gene signatures and cell quantification tools. A clustering analysis was done that separated metastatic samples into three different immune categories: high, medium and low.
Results Significant differences were found between the immune profiles of samples metastasizing in distinct organs. Metastases in lung showed a higher immunogenic score than metastases in brain, liver or bone, regardless of their primary site of origin. Also, they preferentially clustered in the high immune group. Samples in this cluster exhibited a clear inflammatory phenotype, higher levels of immune infiltrate, overexpression of programmed death-ligand 1 (PD-L1) and cytotoxic T-lymphocyte-associated protein 4 (CTLA4) pathways and upregulation of genes predicting clinical response to programmed cell death protein 1 (PD-1) blockade (T-cell inflammatory signature). A decision tree algorithm was used to select CD74 as a biomarker that identify samples belonging to this high-immune subtype of metastases, having specificity of 0.96 and sensitivity of 1.
Conclusions We have found a group of lung-enriched metastases showing an inflammatory phenotype susceptible to be treated with immunotherapy.
- gene expression profiling
- tumor microenvironment
- immunity
This is an open access article distributed in accordance with the Creative Commons Attribution Non Commercial (CC BY-NC 4.0) license, which permits others to distribute, remix, adapt, build upon this work non-commercially, and license their derivative works on different terms, provided the original work is properly cited, appropriate credit is given, any changes made indicated, and the use is non-commercial. See http://creativecommons.org/licenses/by-nc/4.0/.
Statistics from Altmetric.com
Background
Despite extraordinary advances in cancer research in the last decades, metastasis is the major cause of mortality in many cancer types and their complete understanding remains elusive.1 2 The metastatic process is very inefficient since only few of the many cells that migrate from the primary tumors successfully colonize distant sites. This is likely explained by the fact that circulating cancer cells in the bloodstream are exposed to the innate immune system and probably the majority of them are destroyed.3 4
Furthermore, once in the secondary organ, cancer cells are challenged by a hostile microenvironment with a particular immune composition so they might be vulnerable to immune surveillance.5 As example, the liver’s lymphocyte population is selectively enriched in natural killer (NK) and T cells, which play critical roles in first-line immune defense against invading pathogens, modulation of liver injury and recruitment of circulating lymphocytes.6 In the brain, the blood–brain barrier and the brain-resident cell types (ie, microglia) make this organ an immune-suppressive environment.7 Indeed, only certain tumor cells within the primary tumor bulk are compatible with the cellular and molecular environment of specific secondary organs. This is likely to be the reason why although cancer cells are able to escape from the primary tumor and travel randomly around the body, their invasive fingerprint differs among cancer types.8 For instance, breast cancer metastasizes preferentially in bone (more than 50%) whereas around 65% of kidney tumors metastasize in lung and almost 85% of prostate cancer metastasizes in bone.9 The “seed and soil” hypothesis postulates that the organ-preference patterns of tumor metastasis are the product of favorable interactions between metastatic tumor cells (the “seed”) and their organ microenvironment (the “soil”). In this regard, the focus of research is currently moving to study the role of immune system cells in the metastatic process. The generation of an immunosuppressive microenvironment and the engaging of prometastatic inflammatory processes has been described to play an important role in metastatic homing.10 Also, studies have proved that systemic signals from primary tumors can influence the microenvironment of distant organs by creating pre-metastatic niches that recruit supportive stromal cells before the arrival of circulating tumor cells. This pre-metastatic niche promotes metastasis by generation of inflammation and immunosuppression in the target organ.11
Thus, the success of the metastatic growth is determined by a complex crosstalk between metastatic cells and target organ microenvironments.12 In this work, we revisit the classic hypothesis of seed and soil through a pan-cancer study from an immune system perspective. Since metastatic cells must evade target organ immune surveillance to grow,13 we hypothesize that the immune microenvironment of the host tissue may play an important role in the process of metastatic cells selection and homing. Therefore, metastatic tumors in the same location might share mechanisms of immune evasion and subsequently could respond to the same immune treatment. By using bioinformatics techniques such as cell quantification algorithms or gene expression profiles, a molecular characterization of the immune microenvironment of metastatic samples in four different locations has been done. Then, a clustering analysis identified a subgroup of metastases sharing inflammation and immune infiltration features that might be targeted by immunotherapy drugs.
Methods
Patients and samples
Gene expression and clinical data from 374 metastatic samples including brain, bone, liver and lung and 348 normal samples from the same locations were collected. A total of 16 datasets for metastases (GSE100534, GSE101607, GSE10961, GSE44660, GSE11078, GSE12630, GSE14017, GSE14018, GSE43837, GSE46141, GSE14108.1, GSE14108.2, GSE40367, GSE41258, GSE50496.1, GSE85258) were downloaded from open repository Gene Expression Omnibus (GEO). The clinical information and description of datasets is summarized in online supplementary table 1. Metastatic samples were originated from six different primary locations (breast, colon, non-small-cell lung cancer (NSCLC), kidney, prostate and skin melanoma). Frequencies of location of metastases are in general in agreement with those previously reported,9 although a slight enrichment in brain metastatic samples existed due to over-representation in some of the datasets (online supplementary figure 1). In addition, a total of 348 samples from normal healthy tissue were collected from five GEO datasets (GSE7307, GSE45878, GSE803, GSE3526, GSE1133; online supplementary table 2).
Supplemental material
Supplemental material
Normalized gene expression data from the 16 datasets comprising six different microarray platforms were joined and transformed to log-2 scale. An adjustment for reduction of the batch effect was performed with ComBat function from R package sva. Online supplementary figure 2 shows a principal component analysis of the samples based on gene expression data, showing the efficacy of this method to generate a homogenized dataset. Data were analyzed separately for metastatic and normal samples.
Immune microenvironment characterization
Gene expression data were used to characterize the immune microenvironment of samples, using a variety of bioinformatics tools. The immunophenoscore (IPS) function was used to measure the immune state of the samples. IPS uses a number of markers of immune response or immune toleration to quantify and visualize four different immunophenotypes in a tumor sample (antigen presentation, effector cells, suppressor cells and checkpoint markers). It also generates a z-score summarizing these four categories. The higher the z-score of IPS, the more immunogenic the sample.14 To estimate the presence of immune cell populations in the metastatic tissues, two different tools were used. First, R package ESTIMATE was used.15 ESTIMATE (Estimation of STromal and Immune cells in MAlignant Tumor tissues using Expression data) is a tool that predicts the tumor purity from gene signatures and calculates three scores: (1) stromal score—predicts the presence of stromal cell types in tumor bulk, (2) immune score—infers the infiltration of immune cells in tumor tissue and (3) estimate score—estimation of the tumor purity. Then, to obtain a more detailed picture of immune cell type infiltration, R package MCPcounter was used.16 MCPcounter (Microenvironment Cell Populations-counter) is a method for quantification of immune cell’s relative abundances in heterogeneous tissues using marker genes optimized for interrogating microarray data. Nine different cell types were interrogated (T cells, cytotoxic T cells, NK cells, B lineage, monocytic lineage, myeloid dendritic cells, neutrophils, endothelial cells and fibroblasts). Data were also interrogated with QuantiSeq (absolute method)17 and xCell (relative method)18 tools that also estimate immune cell infiltration.
For all the obtained scores, assumptions of normality and homoscedasticity were interrogated through statistical tests Levene and Shapiro, respectively. All comparisons between variables were analyzed using non-parametric tests (Kruskal-Wallis and Wilcoxon tests), for homogenization of methods, as variables were either not normally distributed, or variances were not equally distributed between groups. For all tests applied, differences were considered significant when p<0.05. To probe the lack of correlation of the scores between each metastatic sample and its related primary site of origin, a comparison between the different primary sites of origin was performed, for each metastatic site.
Immune clustering
To make a cluster analysis separating samples on the basis of their immune status, a total of 25 immunity-related gene sets covering both innate and adaptive responses were manually selected from pathways’ databases and publications (detailed in online supplementary table 3). Gene Set Variation Analysis from R package GSVA was performed to obtain the immune profile of the metastatic samples. This function performs a non-parametric, unsupervised analysis for estimating variation of the given gene sets through the samples in the expression matrix, returning an enrichment score for each sample. GSVA function was performed with 1000 bootstraps and arguments as default.
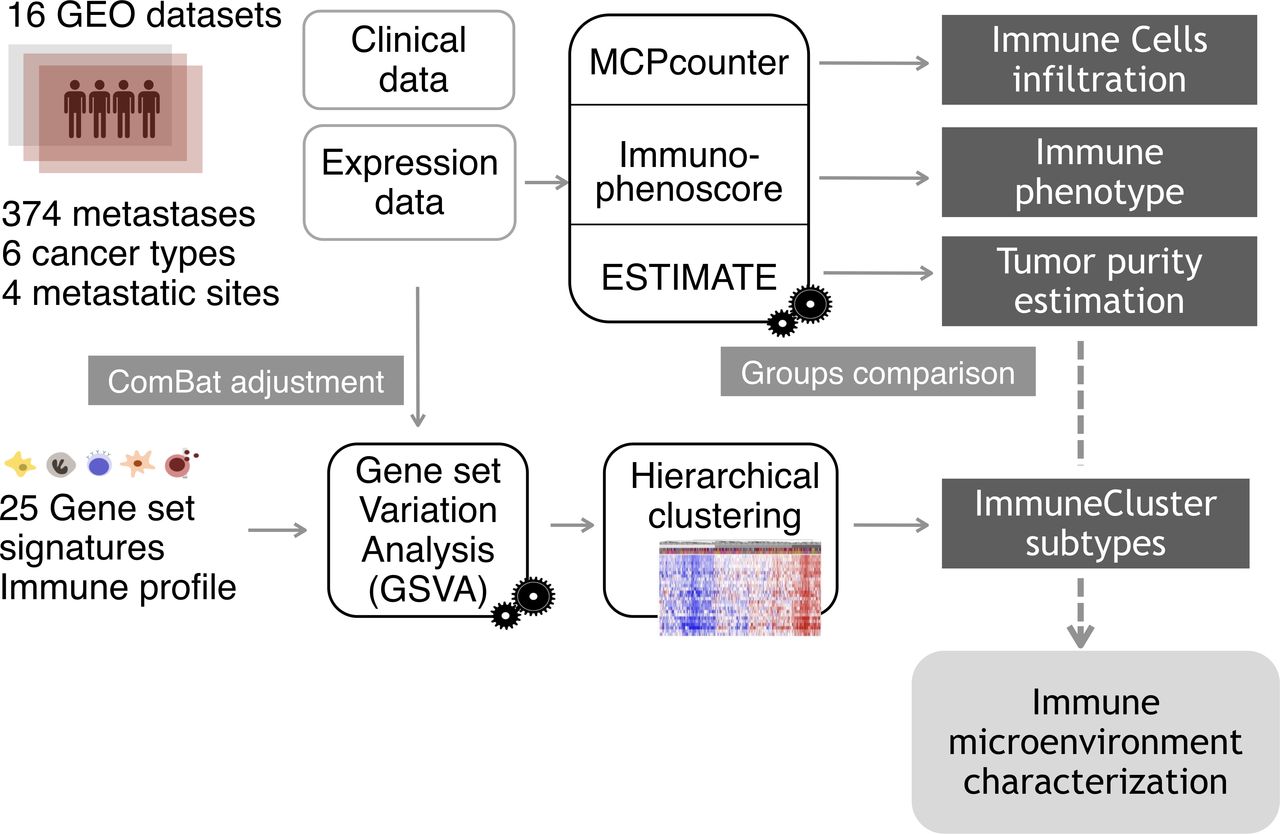
The resulting GSVA enrichment scores were then used to cluster the samples by agglomerative hierarchical clustering. First, samples distances were computed via the R function dist, with Euclidean distance. Next, hclust function generated a clustering from the distances, with “Ward-D2” linkage method, where dissimilarities are squared for obtaining more accurate clustering. The same process was performed for gene set distances. Three categories, characterized by different immune and inflammatory enrichments, were defined and named as “Low ImmuneCluster (LIC),” “Medium ImmuneCluster (MIC)” and “High ImmuneCluster (HIC).” Function cutree (dendextend package) was used to divide the dedrogram tree in the three groups. Finally, for visualization purposes, a heatmap was plotted with the representation of the 374 samples and 25 gene sets scores, previously scaled and centered. A dendrogram was drawn to visualize the distance tree for samples and gene sets. Proportions of the different tumor metastases among the three ImmuneClusters were tested by χ2 test of proportions and plotted as barplot of percentages. Figure 1 shows a summary of the analysis performed from sample collection to immune microenvironment characterization.

Analysis overview. Gene expression data from a cohort of 374 samples from four different metastatic locations were collected from Gene Expression Omnibus (GEO) database. To eliminate the batch effect, data were adjusted using the ComBat function. For each metastatic sample, tumor purity, proportion of immune cell infiltration and immune status were estimated using the R packages ESTIMATE (Estimation of STromal and Immune cells in MAlignant Tumor tissues using Expression data), MCPcounter (Microenvironment Cell Populations-counter) and the Immunophenoscore algorithm. Applying Gene Set Variation Analysis (GSVA) function, samples were scored according to the level of expression of a comprehensive set of gene signatures related to immune response. The resulting scores were used to cluster the metastatic samples on the basis of their immune profile.
Gene expression data from samples in Liu et al 19 were downloaded for validation purposes. Metastatic samples (n=111) were classified into the three ImmuneClusters. Overall survival (OS) after immunotherapy treatment was plotted using a Kaplan-Meier curve stratifying by HIC, MIC and LIC.
Healthy tissue gene signatures
To calculate the Normal Tissue Signatures, normalized and ComBat-adjusted expression data for the 348 healthy samples were used. A differential expression analysis among the four healthy tissues was performed with R package Limma to generate a gene profile exclusive for each tissue type (brain, bone, liver and lung). All metastatic samples were scored with these signatures and used to explore the presence of healthy tissue contamination. Also, Normal Tissue Signatures were added as a continuous covariate in the model matrix for the Combat function. The resulting adjusted expression matrix values were used to recalculate immune scores in all metastatic samples.
Functional analysis
To identify enrichment in specific cellular functions and pathways, a Gene Set Enrichment Analysis (GSEA) was performed comparing samples belonging to the extreme phenotypes HIC and LIC.20 Gene sets from MsigDB were interrogated (Hallmarks, Gene Ontologies, Oncogenic Pathways, Immunologic Pathways and Canonical Pathway that include the datasets KEGG, Reactome and Biocarta).
Also, to predict their putative response to anti PD-L1 drug, metastatic samples were scored with the GSVA method using the T-cell inflammatory (TIS) signature. This is a genetic profile reported as a good predictor of clinical response to pembrolizumab across a wide variety of tumor types.21
Identification of genes to classify samples into ImmuneClusters
A classification algorithm was performed to find genes classifying samples into extreme phenotypes HIC and LIC. Data were divided into training (75% of samples, n=137) and test dataset (25% of samples, n=46). The Training dataset was used for predictor discovery and supervised classification to generate a plausible model. This division was carried out randomly and respecting the LIC/HIC proportions. The training datasets was used to identify differentially expressed genes (DEGs) between LIC and HIC groups. For this, an empirical Bayes analysis with R package Limma was performed using Benjamini and Hochberg’s method for false discovery rate correction. DEGs between these two extreme phenotypes were selected as those with log2 fold change (log2FC)> abs(2) and adjusted p-value <0.01. The DEGs identified using the training set were used in a binary decision tree with cross-validation (k=5) to identify an optimal classification model for LIC/HIC. The classification was made with the R package caret. The classification accuracy was evaluated by calculating the sensitivity, specificity, likelihood ratio (LR) and area under the curve (AUC). Finally, the predictive power of the selected decision tree was validated in an independent dataset (GSE51244). This dataset is compressed by 94 metastatic samples (lung and liver) from colorectal cancer (CRC). First, samples were classified into the three ImmuneClusters by our algorithm. Then, the samples were classified as CD74 high/CD74 low, by the median value of expression. Finally, the agreement between the CD74 high and HIC category was evaluated.
Availability of data and code
All data and R code used for the analysis are freely available at GitHub repository https://github.com/odap-ubs/mets-immunecluster.
Results
Immune characterization of metastatic samples
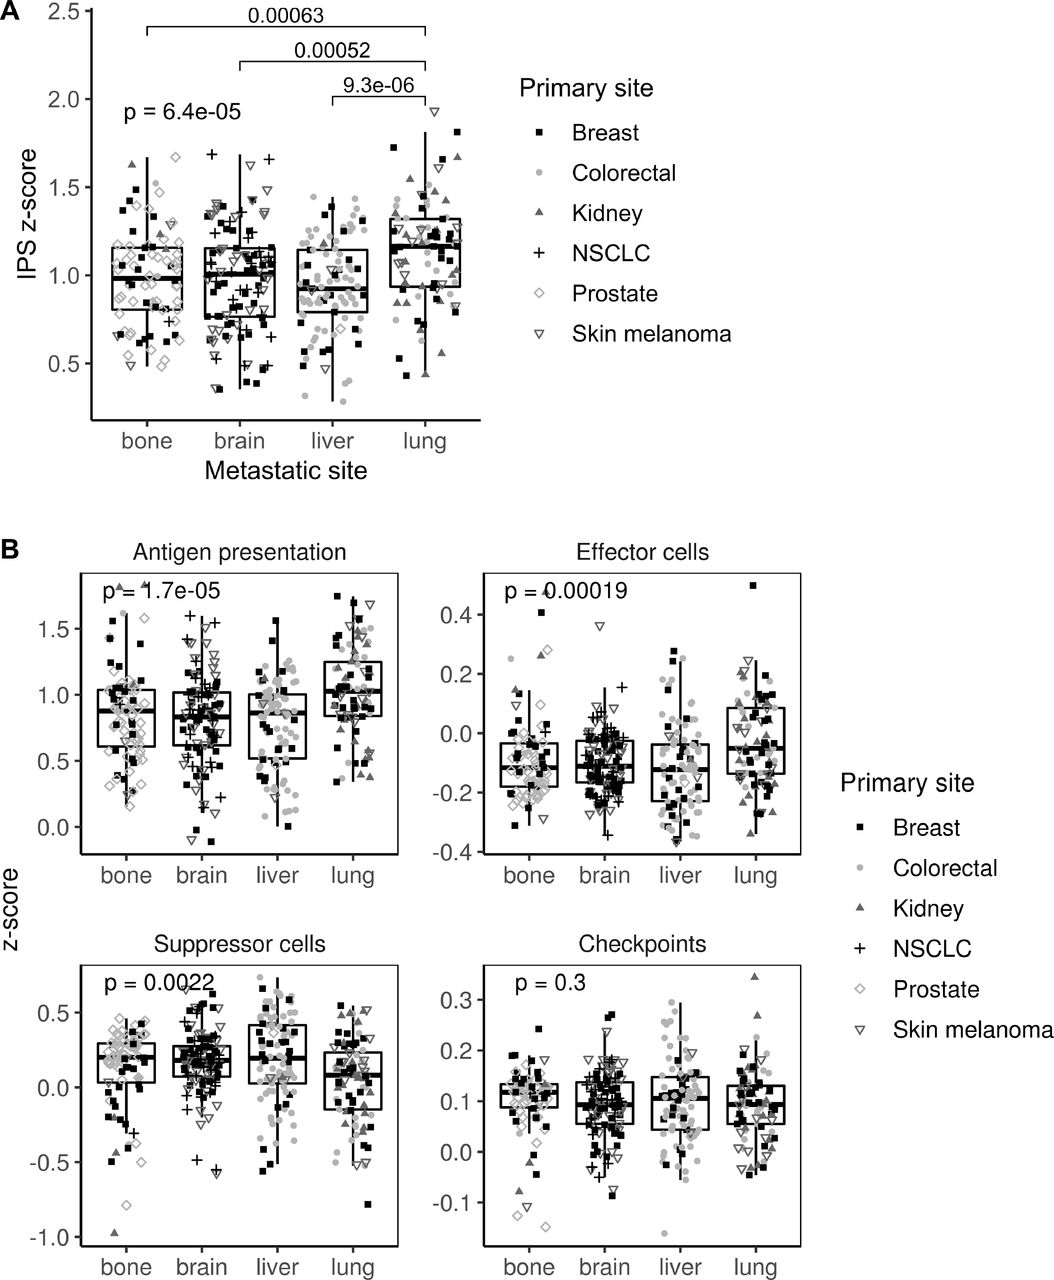
Gene expression data were used to categorize metastatic samples according to their immune status. First, IPS scores were used as a general indicator of immune system activation across samples. Metastases in lung showed a higher IPS z-score than those in bone, brain or liver (p=0.00006), suggesting a different immune microenvironment modulation (figure 2A). Specifically, lung metastases showed higher scores for antigen presentation (p=0.00002) and effector cells (p=0.0002), whereas they showed the lower score for suppressor cells (p=0.002). Interestingly, no differences across metastatic locations were found in the immune checkpoint category (figure 2B).

Immunophenoscore (IPS) scores across the four metastatic locations. (A) Boxplot showing the aggregated IPS z-score. (B) Boxplot showing the antigen presentation, effector cells, suppressor cells and checkpoint scores. Dot shapes represent the primary tumor origin of each metastatic sample. NSCLC, non-small-cell lung cancer.
Next, ESTIMATE software was used to interrogate samples about their stromal and immune cell infiltration. Metastasis in lung and bone showed more abundance of stromal cells. In agreement with the IPS results, lung metastases scored better in the immune category (p=0.0002; figure 3A). To explore this issue in detail, MCPcounter, a tool for the quantification of different immune cell populations was used. As a result, lung metastases scored high in B lineage (p=0.0001), cytotoxic lymphocytes (p=0.001), myeloid dendritic cells (p=0.004), endothelial cells (p=0.006) and T-cell categories (p=0.03). No differences were found in NK cells, monocytic lineage and neutrophil categories. Interestingly, both lung and bone metastases showed an enrichment in fibroblast in comparison with brain and liver samples (p=0.00001; figure 3B). To validate this results, other tools apart from MCPcounter were used. In agreement with our results, absolute method QuantiSeq validates B-cell and T-cell abundance (specifically CD8+ T cells) in lung metastases, whereas relative xCell algorithm validates lung metastases enrichment in dendritic and endothelial cells. Neither QuantiSeq nor xCell validates differences in cancer associated fibroblasts (CAF) infiltration. QuantiSeq detected monocytes as higher infiltrated in lung versus liver metastases (online supplementary table 4).
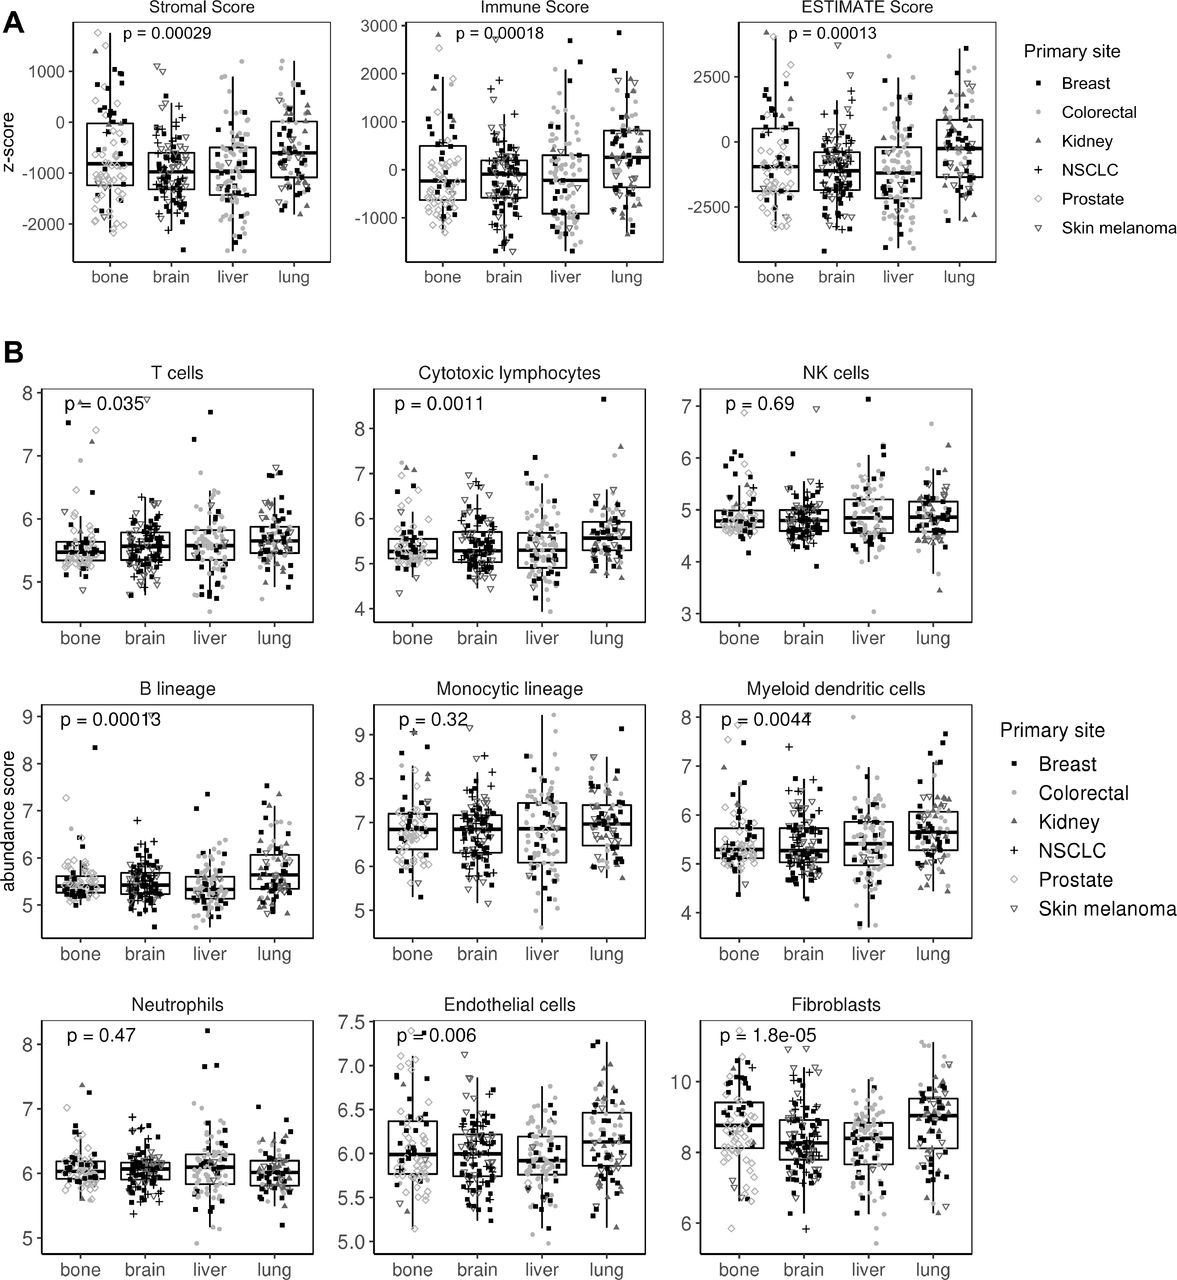
Stromal and immune infiltration across the four metastatic locations. (A) Boxplot showing stromal, immune and ESTIMATE (Estimation of STromal and Immune cells in MAlignant Tumor tissues using Expression data) scores for each sample. (B) Boxplot showing stromal and immune cell infiltration using MCPcounter (MicroenvironmentCell Populations-counter) tool. Shaped dots represent the primary tumor origin of each metastatic sample. NK, natural killer; NSCLC, non-small-cell lung cancer.
To exclude the possibility that normal tissue from surgical margins were biasing our results, profiles for healthy tissue gene expression in bone, brain, liver and lung using transcriptomic data were constructed. Strong differences were found when comparing metastatic and normal tissues suggesting that little contamination existed, if any (online supplementary figure 3). Only lung metastases showed some resemblance with lung normal tissue. However, no correlation was found between the IPS score and the normal tissue score in lung metastatic samples thus excluding the possibility that samples showing higher immune scores had more normal tissue contamination (online supplementary figure 4A). Moreover, immune characterization was repeated adjusting all samples’ gene expression by their normal tissue score and almost the same results were obtained (online supplementary figure 4B and C).
Finally, we wondered if differences between the seeding organs existed. Within metastatic samples in brain and liver, no differences existed in IPS scores neither in infiltration composition regardless of their primary site or origin (online supplementary figure 5A and B). This suggested that, to some extent, immune adaptation to the new environment is a mechanism shared across tumors metastasizing in brain and liver. However, differences existed in lung and bone metastases. In lung, only slight differences were found in B lineage infiltration score (p=0.02; online supplementary figure 5C). In bone metastases, significant and stronger differences existed since samples from colorectal and kidney primary tumors have higher levels of antigen presentation and effector cells score but lower suppressor cells score. Also, they have more lymphocytes and myeloid dendritic cell infiltration (online supplementary figure 5D). This result suggested that the primary origin of bone metastases is indeed affecting the immune phenotype of their subsequent metastases.
Clustering of metastatic samples based on their immune phenotype
To further explore the existence of metastases with a hot immune phenotype, manually curated gene sets related to both adaptive and innate immune responses were used to perform a hierarchical clustering for the 374 samples. Three groups emerged categorized as “HIC” (19%), “MIC” (51%) and “LIC” (30%) (figure 4A). Online supplementary figure 6A summarizes the GSVA scores for each metastatic site, lung being the most immunogenic one in agreement with previous results. Indeed, when proportion of metastases for each ImmuneCluster were represented, the HIC was enriched in lung metastases, whereas MIC was in brain and LIC in liver (figure 4B). When primary sites of origin were compared with the three clusters, kidney cancer type showed an enrichment of HIC samples (probably reflecting the enrichment of lung metastatic ones) whereas prostate was the one with the lower. Finally, normal tissues were also scored using this approach but pairs of normal-metastatic tissues did not cluster together (online supplementary figure 6B).

Clustering of metastatic samples using immune-related datasets. (A) Heatmap showing the metastatic samples grouped by hierarchical clustering using the GSVA enrichment scores for 25 innate and adaptive immunity-related gene sets. Samples are clustered in three major groups defined as Low ImmuneCluster (LIC), Medium ImmuneCluster (MIC) and High ImmuneCluster (HIC). Color bars at the top of the graph labels the samples by the metastatic site, their primary tumor of origin and the ImmuneCluster. (B) Barplot of metastatic location percentage in each ImmuneCluster. MHC, major histocompatibility complex; NSCLC, non-small-cell lung cancer.
Functional characterization of metastases belonging to the HIC
One might expect metastases to be immune cold, as being very aggressive tumors. In agreement, the HIC was the one comprising the less number of samples. This was an interesting group of samples characterized by an elevated expression of the human leukocyte antigen class II (HLA-II) complex and genes involved in antigen presentation pathway. Also, they showed high levels of the therapeutic targets PD-L1 and CTLA4, thus suggesting a hypothetic treatment with immune checkpoint inhibitors. Supporting this hypothesis, all samples belonging to HIC scored very high in the TIS signature reporting to be correlated with response to anti PD-L1 checkpoint inhibitor pembrolizumab (p<0.001; figure 5). Moreover, independent dataset comprising metastatic samples from patients with melanoma treated with immune checkpoint inhibitors were classified into the ImmuneClusters and interrogated about survival. Interestingly, samples classified as HIC and MIC showed a tendency toward better OS than LIC samples (figure 6A). Half lung metastases were classified as HIC (figure 6B). Although number of samples was too small to reach a conclusion, it is worth that two out of the total four lung metastases experienced progressive disease, whereas one experienced stable disease and one achieved a complete response. On the contrary, six out of seven brain metastasis suffered progressive disease and only one exhibited a partial response. Although speculative, these results pave the way to a hypothetic treatment of the highly inflammatory metastatic tumors (figure 7).

T-cell inflammatory signature (TIS) scores across ImmuneClusters. Barplot showing TIS measures for each metastatic sample. Red line indicates the median value. Color dots represent the metastatic site of the samples.

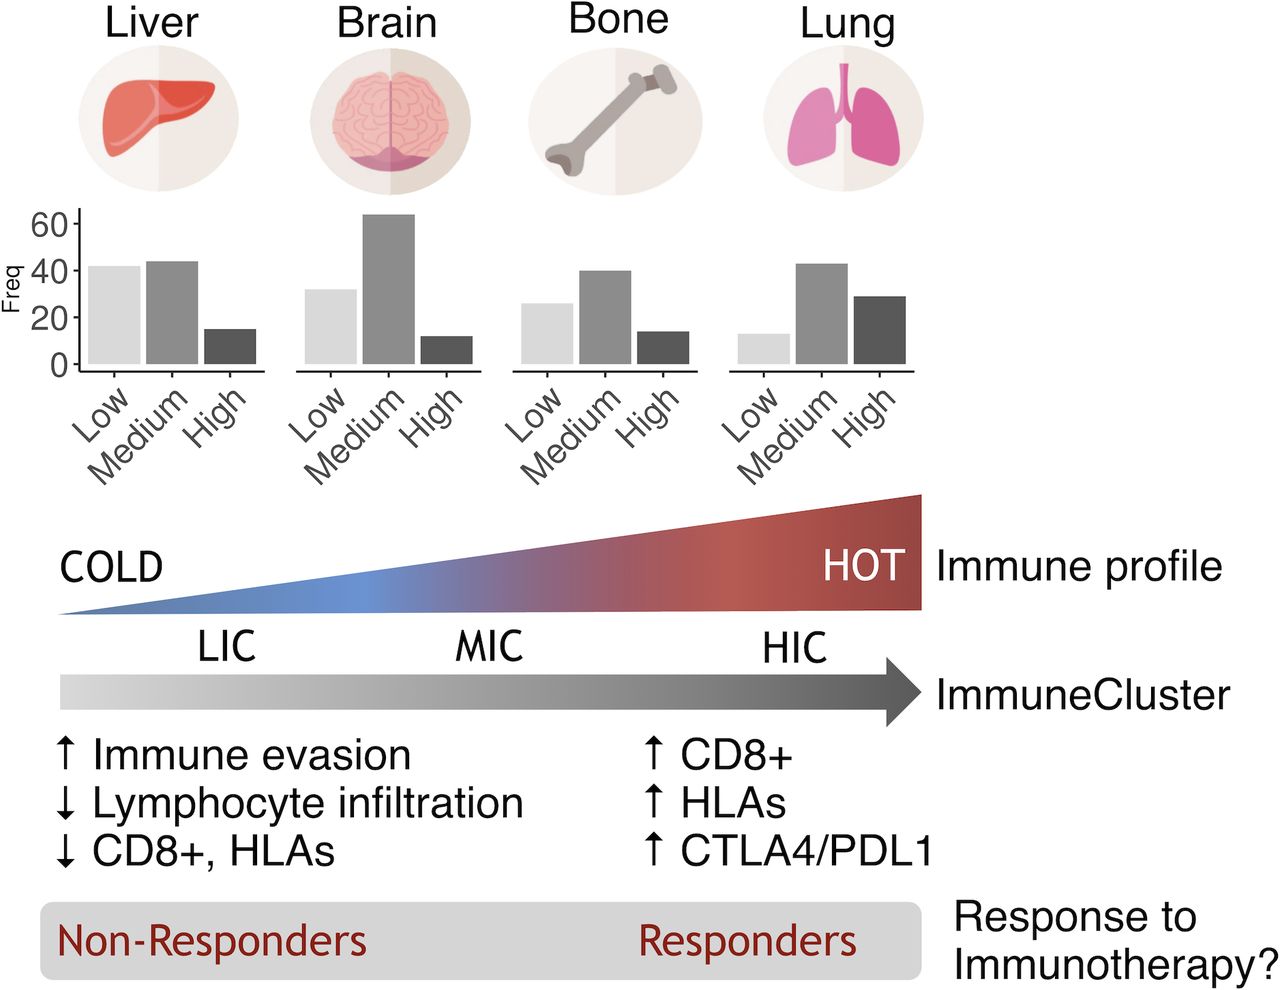
ImmuneCluster classification and response to immunotherapy. (A) Kaplan-Meier curve showing survival after immunotherapy treatment in metastatic melanoma. High ImmuneCluster and Medium ImmuneCluster samples exhibited a tendency toward better overall survival than Low ImmuneCluster samples (Log-rank test, p=0.084). (B) Frequency of metastases in each ImmuneCluster by location.

Hypothesis. Based on their immune status, metastatic samples could be clustered into three ImmuneClusters. Lung metastasis tend to be more immunogenic, while liver metastasis tends to be less immunogenic. Metastatic samples in the HIC cluster sharing an inflammatory phenotype might be immunotherapy responders, regardless of their primary site of origin.
Samples in the three clusters were interrogated about their level of immune infiltration. As expected, the HIC scored better in all categories being these tumors highly infiltrated in all categories both activating and inhibiting the immune system. It is interesting to note that all bone metastasis in the HIC scored very high in the T-cell category (online supplementary figure 7A). However, when markers of exhaustion were examined, samples belonging to HIC showed the higher levels of expression (online supplementary figure 7B). This result suggested that although highly infiltrated by T cells, these are not functional but exhausted.
Then, a functional analysis comparing samples belonging to the extreme phenotypes HIC and LIC was done using GSEA. As expected, HIC samples were highly enriched in immunity-related pathways and in inflammation ones such as interleukin (IL)-2–STAT5, IL-6-JAK-STAT3, interferon, tumor necrosis factor (TNF)-α, TNF-γ and nuclear factor kappa-light-chain-enhancer of activated B cells (NF-κB), among others. Also, HIC samples were enriched in antigen presentation, Toll like receptor 4 (TLR4) signaling and CTLA4 pathways. Regarding cellular functions, inflammatory response and adaptive immune response emerged as the most significant ones (online supplementary table 5 and online supplementary figure 8). Since those samples were initially clustered on the basis of their immune phenotypes, these results were not surprising at all. However, the functional analysis also reported interesting results not directly related to the immune system. For example, apoptosis and KRAS signaling pathways were upregulated pathways in HIC samples.
Identification of HIC biomarkers
The more differentially expressed genes (DEG) among ImmuneClusters were selected (log2FC > abs(2), n=43; online supplementary table 6, online supplementary figure 9) and used to search for a biomarker or panel of biomarkers useful to identify samples belonging to the HIC. A decision tree algorithm with bootstrapping selected CD74 as the gene that best categorizes between the two groups (online supplementary figure 10A). The model was first validated on the test samples within our dataset, with good prediction values (sensitivity=1, specificity=0.96, LR(+)=9.8, LR(−)=0.2, AUC=0.98, receiver operating characteristic curve in online supplementary figure 10B). When tested in an external dataset, CD74 showed high accuracy classifying samples into LIC and HIC (classification error=0.1).
Interestingly, when samples belonging to MIC were reclassified, 76 out of 191 samples belonging to the MIC were classified as HIC, whereas 113 were classified as LIC in our dataset. In the validation dataset, 14 out of 18 samples belonging to this cluster were classified as HIC, whereas 4 were classified as LIC. This suggested that a percentage of metastasis showing and intermediate phenotype could resemble to the highly infiltrated ones. Indeed, when interrogated using the TIS score, about half of metastases classified as MIC scored very high suggesting a putative response to immunotherapy (figure 5). Thus, CD74 might be marker of inflammatory metastases.
Discussion
Disseminated cells must evade immune system response to complete the metastatic invasion. Many examples exist in the literature demonstrating the contribution of immune system cells and molecules in several steps of the metastatic cascade, apart from other players. Inflammatory response and immune regulatory cells (both myeloid and lymphoid) have been reported to support spreading and metastasis.22
Although pan-cancer analyses interrogating immune cell infiltration in primary tumors have been reported,23 to our knowledge none has tackled this issue in metastatic samples. We hypothesized that metastatic tumors in the same organ from different primary tumors might share similar immune features and/or mechanisms to escape immune surveillance. Recently, corroborating our hypothesis, a study on bone metastases remarks the existence of tissue-specific checkpoint immunotherapy evasion.24 Since brain, bone, liver and lungs are the secondary sites more prone to be invaded by disseminated cells, we selected almost 400 metastatic samples in those organs to work with. By using transcriptomic data, we found significant differences in markers of immune microenvironment activation among the different metastatic locations. Lung metastases showed a tendency toward having a higher immunogenic environment compared with brain, bone and liver metastases. In agreement, cell lineage infiltration analysis revealed higher lymphocytic infiltration in lungs and also myeloid dendritic cells, whereas there are no differences for innate immunity components (NK, monocytic lineage, neutrophils). Interestingly, there is no association between the organ of origin of the lung metastases and these immune markers, indicating that differences found are independent of the cancer primary site. In agreement, a work by Remark et al showed no differences in T-cell infiltration in lung metastases coming from CRC or renal primary tumors, although they found differences in NK infiltration.25
A cluster analysis identified a percentage of around 20% of metastatic samples classified as high immunogenic (HIC). In line with our previous results, there was enrichment in lung metastatic samples in this subtype, mainly characterized by being highly inflammatory. It has been reported that immunosuppressive mechanisms that prevent massive immune reactions to pulmonary alveolar macrophages in the lungs are harnessed by tumors to facilitate metastasis. Therefore, the intrinsic properties of lung immune homeostasis could be, at least partially, responsible for the susceptibility of the lungs to metastasis.26 Inquiringly, several reports suggested that in asthmatic people the use of anti-inflammatory inhaled corticosteroid is associated with a reduced risk of lung cancer but not of laryngeal cancer27 28 thus suggesting an inflammatory origin of tumors growing in this location. On the contrary, there is enrichment in liver metastases in the LIC pointing these metastases as the colder ones. An explanation could be that a high percentage of these secondary tumors show a vessel co-option pattern of metastatic growth. This is a replacement growth in which the tumor do not generate new vessels or an inflammatory reaction. As cancer cells grow, substitutes normal liver cells.29 However, it is interesting to note that not all lung metastases were categorized in the HIC cluster. Furthermore, some metastases in bone, liver and brain also fell in this cluster thus sharing phenotypic and immune features. Although rare, 83% of bone metastases originating from CRC and kidney tumors belonged to HIC and showed an increase in immune markers. The osteolytic nature of these lesions (in contrast with other bone metastasis coming from other tumors like prostate) might explain, at least in part, the particular idiosyncrasy of these metastases. Supporting this hypothesis, one of the genes shown to be significantly increased in HICs, granzyme A, has emerged as a key proinflammatory molecule regulating osteoclast differentiation and bone erosion during rheumatoid arthritis.30
It is worth to note that metastases belonging to HIC scored very high when interrogated with the TIS signature, whereas metastases in LIC scored very low. This is a gene expression level measuring the level of microenvironment inflammation. In a clinical trial encompassing 20 cohorts of patients with advanced solid tumors, TIS was able to predict pembrolizumab response (an anti-PD-L1 drug).31 Recently, the utility of such signature as an accurate and independent predictive biomarker has been validated in a pan-cancer study analyzing anti-PD-1 treatment benefit in primary tumors.32 Thus, we propose to treat HIC metastases with immune checkpoint inhibitors, irrespective of their primary site of origin. In agreement, and close to be statistically significant, melanoma metastatic samples classified into HIC and MIC showed better OS than LIC after treatment with anti-PD1 inhibitors pembrolizumab or nivolumab. Although promising, this hypothesis needs further study. In the same line, a study in melanoma and lung tumors reported poor response to pembrolizumab in liver metastases than in extrahepatic ones.33 In agreement, most liver metastases belong to LIC cluster. In breast cancer, triple negative tumors have been reported to be more susceptible to immune therapeutics.34 We classified breast cancer metastatic samples into the intrinsic molecular subtypes and interestingly, almost 50% of lung metastases were classified as basal (mostly corresponding with triple negative tumors). However, no differences in the TIS score across molecular subtypes were observed (data not shown).
To classify metastatic samples into the inflammatory cluster HIC, a decision tree algorithm selected CD74 as a good biomarker. CD74 is a gene coding for a chaperone that associates with class II major histocompatibility complex (MHC-II) and regulates antigen presentation for immune response.35 Interestingly, MHC-II has been proposed as a good predictor of response to immune checkpoint inhibitors in melanoma metastases.19 CD74 also serves as cell surface receptor for the cytokine macrophage migration inhibitory factor (MIF) which, when bound to the encoded protein, initiates survival pathways and cell proliferation. MIF and CD74 have been shown to regulate peripheral B-cell survival and were associated with tumor progression and metastasis.35
It is worth to mention that among the different markers of cytotoxic T lymphocytes activation, GZMA was the only one that reached significance to be included in the HIC metastases group (online supplementary figure 9). A priori the appearance of markers of cytotoxic T lymphocytes activation in the inflammatory tumors susceptible to be treated with immunotherapy is not surprising and might pass unnoticed. However, several independent reports have recently identified GZMA as a key regulator of inflammation in different pathologies,36 including carcinogenesis, which tempts us to speculate on the potential significance of this finding. Specifically, after our recent results indicating that inflammation induced by GZMA is key for the development of CRC in vivo and therapeutic inhibition of GZMA reduced gut inflammation and CRC development in mice (Santiago et al accepted for publication). Other interesting gene is C-C Motif Chemokine Ligand 5 (CCL5), a proinflammatory chemokine that has been reported to favor the formation of an immunosuppressive microenvironment in tumors like gastric or breast, among others.37 CCL5 shifts the balance between different leukocyte cell types by increasing the presence of deleterious TAMs and by inhibiting the antitumor T-cell activation.38
Metastatic samples in HIC showed KRAS activation suggesting a crosstalk between this pathway in the tumorous cell and the immune microenvironment. Indeed, a relationship between KRAS pathway and inflammation has been described in a mouse lung model harboring KRAS G12D mutation.39 Kitajima et al demonstrates that KRAS signaling activates carcinogenesis through upregulation of IL-6 and CCL5 cytokines.40 Also in agreement, patients with KRAS-mutant CRC develop lung metastases more frequently than KRAS wild-type (WT) counterpart.41 A recent study found KRAS WT tumors resistant to anti-epidermal growth factor receptor (EGFR) drugs having cytotoxic T-cell infiltration and overexpression of PD-L1 thus susceptible to be treated with immune checkpoint inhibitors.42
This study has limitations mainly derived to the fact that results were inferred from public datasets. We had to normalize data generated by diverse laboratories and, though we used strategies to reduce batch effects, these methods may not be fully efficient and may also reduce biological variability. We have used gene expression signatures to try to control the contamination of tumor tissues with normal tissues. However, we cannot totally exclude this possibility and this issue would be considered in future studies. Also, clinical information was scarce. Association between samples in HIC cluster and prognosis and/or treatment response in other tumors apart from melanoma deserves further study.
In conclusion, our results suggest that tumor cells need to share similar molecular profiles to evade the immune surveillance and growth in a specific secondary niche, regardless of their origin. Furthermore, we have found a cluster of approximately 20% of metastatic tumors showing an inflammatory phenotype that mainly includes lung metastatic lesions. These tumors scored very high when interrogated with TIS signature suggesting a putative treatment with immune checkpoint inhibitors.
Acknowledgments
We thank Spanish Association Against Cancer (AECC) Scientific Foundation. We also thank CERCA Program, Generalitat de Catalunya for institutional support and Josipa Bilic for critical reading of the manuscript.
References
Footnotes
Contributors RS-P and JMP conceived the presented idea. SG-M parsed data and performed the computations. MHA performed classification methods and helped with statistics. XS supervised biomarker identification. VM verified the analytical methods. JP investigated the role of inflammatory genes and supervised the findings of this work. CS and RS interpreted results from a clinical point of view. RS-P took the lead in writing the manuscript. All authors provided critical feedback and helped shape the research, analysis and manuscript.
Funding Agency for Management of University and Research Grants (AGAUR) of the Catalan Government (grant no 2017SGR723).
Competing interests VM is consultant to Bioiberica S.A.U. and Grupo Ferrer S.A., received research funds from Universal DX and is coinvestigator in grants with Aniling. JMP is consultant for Roche-Genentech, Bristol-Myers Squibb, Merck Sharp & Dohme, Merck Serono, Janssen, Astellas, VCN-Biotech and BeiGene; JMP has received research grants from Bristol-Myers Squibb, Merck Sharp & Dohme, Merck Serono, Janssen and AstraZeneca.
Patient consent for publication Not required.
Provenance and peer review Not commissioned; externally peer reviewed.
Data availability statement Data are available in a public, open access repository. All used data have been downloaded from GEO database.