Article Text

Abstract
Background Tumor-associated macrophages (TAMs) play key roles in the development of many malignant solid tumors including breast cancer. They are educated in the tumor microenvironment (TME) to promote tumor growth, metastasis, and therapy resistance. However, the phenotype of TAMs is elusive and how to regulate them for therapeutic purpose remains unclear; therefore, TAM-targeting therapies have not yet achieved clinical success. The purposes of this study were to examine the role of transcription factor EB (TFEB) in regulating TAM gene expression and function and to determine if TFEB activation can halt breast tumor development.
Methods Microarrays were used to analyze the gene expression profile of macrophages (MΦs) in the context of breast cancer and to examine the impact of TFEB overexpression. Cell culture studies were performed to define the mechanisms by which TFEB affects MΦ gene expression and function. Mouse studies were carried out to investigate the impact of MΦ TFEB deficiency or activation on breast tumor growth. Human cancer genome data were analyzed to reveal the prognostic value of TFEB and its regulated genes.
Results TAM-mimic MΦs display a unique gene expression profile, including significant reduction in TFEB expression. TFEB overexpression favorably modulates TAM gene expression through multiple signaling pathways. Specifically, TFEB upregulates suppressor of cytokine signaling 3 (SOCS3) and peroxisome proliferator-activated receptor γ (PPARγ) expression and autophagy/lysosome activities, inhibits NLRP3 (NLR Family Pyrin Domain Containing 3) inflammasome and hypoxia-inducible factor (HIF)-1α mediated hypoxia response, and thereby suppresses an array of effector molecules in TAMs including arginase 1, interleukin (IL)-10, IL-1β, IL-6 and prostaglandin E2. MΦ-specific TFEB deficiency promotes, while activation of TFEB using the natural disaccharide trehalose halts, breast tumor development by modulating TAMs. Analysis of human patient genome database reveals that expression levels of TFEB, SOCS3 and PPARγ are positive prognostic markers, while HIF-1α is a negative prognostic marker of breast cancer.
Conclusions Our study identifies TFEB as a master regulator of TAMs in breast cancer. TFEB controls TAM gene expression and function through multiple autophagy/lysosome-dependent and independent pathways. Therefore, pharmacological activation of TFEB would be a promising therapeutic approach to improve the efficacy of existing treatment including immune therapies for breast cancer by favorably modulating TAM function and the TME.
- breast neoplasms
- immunity
- innate
- immunomodulation
- macrophages
- tumor microenvironment
This is an open access article distributed in accordance with the Creative Commons Attribution Non Commercial (CC BY-NC 4.0) license, which permits others to distribute, remix, adapt, build upon this work non-commercially, and license their derivative works on different terms, provided the original work is properly cited, appropriate credit is given, any changes made indicated, and the use is non-commercial. See http://creativecommons.org/licenses/by-nc/4.0/.
Statistics from Altmetric.com
Background
Tumor-associated macrophages (TAMs) play key roles in the development of many malignant solid tumors including breast cancer.1 They are educated in the tumor microenvironment (TME) to aid in tumor growth, metastasis, and therapy resistance.2 TAMs have been considered M2-like macrophages (MΦs); but they are much more complex than M2 MΦs that are typically induced by interleukin (IL)-4/IL-13 signaling. Many signaling pathways in TAMs are triggered by factors within the TME. A broad arsenal of molecules is subsequently produced by TAMs and executes tumor-promoting functions.3
During the initiation and development of breast cancer, tumor cells secrete soluble mediators such as colony stimulating factor 1 (CSF1), C-C motif chemokine ligand 2 (CCL2), IL-10, and transforming growth factor β1 (TGFβ1), and create a hypoxic and nutrient-depleted milieu.4 CSF1 and CCL2 recruit monocytes/macrophages from circulation and promote proliferation of the recruited and mammary tissue resident MΦs.5 Factors such as IL-10 and TGFβ1 from cancer cells and tumor stromal cells induce TAMs to secrete molecules such as arginase 1 (Arg1), IL-10, and TGFβ1, forming paracrine and autocrine loops. Arg1 depletes arginine in the TME, which is essential for T cell proliferation.6 IL-10 directly suppresses T cell function,7 while TGFβ1 exerts immunosuppression, promotes cancer cell proliferation, and induces epithelial to mesenchymal transition and cancer stem cell generation.8
Cytokines such as IL-1β and IL-6, as well as various Toll-like receptor ligands generated within the TME, act on TAMs to induce them to secrete more inflammatory cytokines and growth factors, creating an unresolving chronic inflammatory milieu.9 10 The chronic low-grade inflammation results in immune exhaustion and cancer stem cell generation.9 Hypoxia in the TME activates hypoxia-induciblefactor 1α (HIF-1α), which triggers a hypoxia signaling cascade, leading to the production of pro-angiogenic factors such as vascular endothelial growth factor (VEGF).11 HIF-1α signaling also alters lipid metabolism pathways leading to production of PGE2, which is known to cause immunosuppression, angiogenesis, and lymphangiogenesis in breast tumors.12 13
Autophagy plays various roles in tumors. On the one hand, cancer cell autophagy may render cancer cells apoptosis resistant.14 On the other hand, autophagy and lysosomal activity in MΦs may lead to attenuation of inflammation by counteracting the NLRP3 (NLR Family PyrinDomain Containing 3) inflammasome.15 Autophagy also may lead to degradation of HIF-1α, de-escalating the hypoxia signaling cascade.16
Because TAMs are equipped with a wide range of pro-tumor effector molecules, and MΦs are the first line of defense against infection, TAM-targeting cancer treatment strategies via depleting MΦs or inhibiting a single type of molecule are either harmful or insufficient. Targeting TAMs at a critical point to keep multiple pro-tumor pathways in check would be more desirable. Therefore, the identification of such a nexus in TAM biology is essential for the future success of TAM-targeting antitumor approaches.
Transcription factor EB (TFEB) controls the expression of genes involved in autophagy and lysosome biogenesis in response to various stimuli.17 Under cellular stress conditions, TFEB is translocated from the cytoplasm to the nucleus, and binds to the promoter of the target genes in the Coordinated Lysosomal Enhancement and Regulation (CLEAR) network which are involved in vesicle formation, cargo recognition, lysosome fusion and cargo degradation.18 Due to its role in the stress responses, enhancement of TFEB activity has emerged as a potential therapeutic approach for multiple lysosomal and protein aggregation disorders, including atherosclerosis and neurodegenerative diseases.19–21
However, the functions of TFEB are not limited to autophagy and lysosome biogenesis. TFEB is activated in MΦs during bacterial infection or stimulation with bacterial components, suggesting TFEB might perform evolutionarily conserved defense functions in the innate immune system.22 Recently, our laboratory discovered an important role of TFEB in macrophage (MΦ) education in breast cancer.23 We showed that TFEB is inactivated and downregulated in TAMs by breast cancer cell-derived TGFβ1, leading to an M2-like polarization via signal transducer and activator of transcription 3 (STAT3) activation, independent of the autophagy-lysosome axis.23 In this current study, we aim to further examine how deficiency and overexpression of TFEB affects MΦ gene expression and functions in the context of breast cancer, and to explore if activation of MΦ TFEB by trehalose, a natural sugar, may serve as a novel therapeutic approach for breast cancer.
Materials and methods
Animals
BALB/c and C57BL/6 mice (female, 6–8 weeks old) were purchased from Jackson Laboratories (Bar Harbor, Maine, USA). A TFEBflox mouse line was generated using the ES cells from EUCOMM depository in Europe, which are the same cells used for generation of liver-specific TFEB knockout mice.24 LysM-Cre mice were purchased from Jackson Laboratories and crossed with TFEBflox mice to generate MΦ-specific TFEB knockout (MΦ-TFEB-/-) mice. MΦ-specific TFEB transgenic (MΦ-TFEBtg) mice were generated and characterized previously.25 Female FVB/N mice were bred with male heterozygous C3(1)/SV40Tag mice (a gift from Dr Jeffrey Green, National Cancer Institute). All mice were housed in the University of South Carolina or Washington University in St. Louis Animal Research Facilities.
Cell culture
The 4T1 mouse mammary tumor cell line was obtained from the American Type Culture Collection (ATCC). EO771 cells were maintained in culture as described previously.23 Peritoneal MΦs (pMΦs) were isolated from thioglycollate-elicited mice. Bone marrow cells from age-matched female wild-type (WT) C57Bl/6, MΦ-TFEBtg and MΦ-TFEB-/- mice were used to generate bone marrow–derived MΦs (BMDMs). Bone marrow cells were seeded in 6-well or 12-well plates for 4 hours, and non-adherent cells were removed, then cultured in complete medium containing 30% L929 cell-conditioned medium as a source of M-CSF for 7 days. The cells were cultured in high glucose Dulbecco’s modified Eagle medium (DMEM; Invitrogen Life Technologies) with 10% fetal bovine serum (FBS) (Invitrogen) and penicillin/streptomycin at 37°C in a humidified 5% CO2 atmosphere. MΦs were polarized according to established protocols.26
Tumor conditioned medium
Tumor conditioned medium (TCM) was prepared by culturing 4T1 or EO771 cells following the procedures described previously.23 Briefly, tumor cells were seeded at 5×10⁶ cells per 75 cm2 dish and cultured to 90% confluence. Then, the medium was removed, and the cells were rinsed with serum-free DMEM twice. The medium was then replaced with fresh serum-free DMEM, and the supernatant was collected after 24 hours. The collected TCM was centrifuged to remove cells and filtered through a 0.45 µm filter (Corning).
Microarray
BMDMs from MΦ-TFEBtg and WT mice were treated with either serum-free DMEM (control), or serum-free DMEM supplemented with 20% concentrated EO771 TCM (ECM) for 24 hours. Cells were then rinsed twice with phosphate-buffered saline (PBS) and lysed using 700 µL Qiazol. RNA was extracted using the miRNeasy kit (Qiagen). Samples were then further cleaned prior to analysis using the RNeasy MinElute Cleanup Kit (Qiagen) protocol. An Agilent 2100 Bioanalyzer was used to determine both the quality and the quantity of the RNA samples. All samples had an RNA integrity number of >8. RNA amplification and labeling was performed using the Agilent Low Input Quick Amp labeling kit according to the manufacturer’s instructions. RNA was again purified using the Qiagen RNeasy mini kit. Dye incorporation and cRNA yield were also assessed. After labeling, samples were hybridized to SurePrint G3 Mouse GE 8×60K Microarrays (Cat. # G4858A-028005) using a gene expression hybridization kit (Agilent) according to the manufacturer’s instructions. A high-resolution Agilent DNA microarray scanner (Cat. # G2565CA) was used to obtain the raw data and images were saved in TIFF format for subsequent microarray analysis. Data were extracted from these images and background corrected data were uploaded into GeneSpring GX software for analysis. After quantile normalization of the data, differentially expressed genes were identified by using the moderated t-test with Benjamini-Hochberg multiple testing correction. Cut-off values of 0.05 and 2.0 were used for p-value and fold-change, respectively. Unsupervised hierarchical cluster analysis was performed with GeneSpring GX. Gene ontology (GO) analysis was performed with GeneSpring. Ingenuity Pathway Analysis (Qiagen) was performed on these data in order to further investigate the interconnection between differentially expressed genes and their biology. A heatmap was generated using normalized intensities and colored to represent gene expression variations for each individual gene.
In vivo cancer models
For the tumor growth experiments, female BALB/c or C57BL/6 mice 6–8 weeks old, 4T1 or EO771 cells (2×10⁵) in 20 µL PBS were injected subcutaneously into the mammary fat pads immediately caudal to the fourth pair of nipples. Tumor volume was determined by caliper measurement and using the equation volume=(length×width2)/2.
Cell isolation
Tumors were weighed, cut into small fragments (<3 mm) and digested in 5 mL of dissociation solution (RPMI 1640 medium supplemented with 10% FBS, Collagenase type I (200 U/mL), and DNase I (100 µg/mL)) for 60 min at 37°C. Erythrocytes were lysed with red blood cell lysing buffer (Sigma, St. Louis, Missouri, USA). Cell suspensions were passed through 70 µm cell strainers, then washed and resuspended in staining buffer. TAMs (F4/80+) were isolated from tumor suspensions using EasySep PE or FITC Positive Selection Kits (Stem Cell Technologies).
Flow cytometry
Cell populations in the tumors were analyzed using flow cytometry as previously described.23 Briefly, cells were stained with anti-CD3 FITC, anti-CD4 APC or anti-CD8 APC, and anti-CD25 PE (Biolegend) in PBS containing 2% FBS for 30 min at 4°C. Samples were washed twice with staining buffer and analyzed with flow cytometry using a BD FACS Aria II flow cytometer and CXP software V.2.2. Data were collected for 20,000 live events per sample.
Luciferase reporter assay
To identify TFEB binding sites in the PPARγ promoter, we searched for the E-box motifs on peroxisomeproliferator-activated receptor γ (PPARγ) promoter or intron regions and found four E-boxes in the upstream region of mouse TFEB transcription start site. The promoter region containing TFEB binding sites were cloned into pGL3 basic vector to generate three constructs: PPARγ-1158 (−797 to +361) contains all 4 E-boxes; PPARγ-891 (−530 to +361) contains E boxes 2–4 which are close to each other; and PPARγ-464 (−103 to +361) does not contain any E-boxes. RAW264.7 cells were seeded in triplicate in 12-well plates and allowed to settle for 12 hours, then transfected with one of the above pGL3-PPARγ promoter plasmids or empty pGL3 plasmids and pRL-CMV (internal control) as well as either lentiviral TFEB (PWPI-TFEB) or control lentiviral vector (PWPI). The luciferase of both firefly and Renilla signals were measured using Dual Luciferase Reporter assay kits (Promega, Madison, Wisconsin, USA). Luciferase activity was normalized to Renilla activity to control for transfection efficiency. The level of luciferase activity of the empty vector and in the absence of TFEB (PWPI) was defined as ‘1’. Fold activation was estimated according to this level of activity.
Quantitative real-time PCR
Total RNA was isolated and purified using Qiagen RNeasy Kits (Qiagen). RNA (2 µg) was then reverse-transcribed using iScript cDNA Synthesis Kit (Bio-Rad). Quantitative real-time PCR (qPCR) was conducted on a CFX96 system (Bio-Rad) using iQ SYBR Green Supermix (Bio-Rad). All primers used for qPCR analysis were synthesized by Integrated DNA Technologies. All assays were conducted following the manufacturer’s instructions. The relative amount of target mRNA was determined using the comparative threshold (Ct) method by normalizing target mRNA Ct values to those of 18S RNA. PCR thermal cycling conditions were 3 min at 95°C, and 40 cycles of 15 s at 95°C and 58 s at 60°C. Samples were run in triplicate. The primer sequences are listed in online supplementary table S1.
Supplemental material
Western blot analysis
Whole cell lysate was prepared using RIPA buffer (Pierce) supplemented with protease inhibitor cocktail and phosphatase inhibitor cocktail (Sigma). The protein concentrations were determined using the BCA protein assay kit (Pierce, Rockford, Illinois, USA). Samples were diluted in 2×Laemmli buffer (Bio-Rad) and boiled for 10 min. Proteins (20 µg) were separated in 10% SDS-polyacrylamide gel electrophoresis precast gels (Bio-Rad) and transferred onto nitrocellulose membranes (Bio-Rad). Non-specific binding sites on the membranes were blocked with 5% non-fat milk in phosphate buffered saline with tween 20 (PBST). Membranes were first probed with TFEB (1:2000; Bethyl Laboratories), PPARγ (1:1000), NLRP3, p-p65, p65, Lamp1, Hif1α, MIF, cytosolic phospholipases A2 (cPLA2), inducible nitric oxide synthase (iNOS), arginase 1 (Arg1), or β-actin (1:1000; Sigma) antibodies, followed by goat anti-rabbit or anti-mouse secondary antibody conjugated with horseradish peroxidase (Millipore). Protein detection was conducted using Pierce ECL Substrate (Pierce).
Transcriptomic data retrieval and survival analysis
The breast cancer patient survival data were obtained from The Cancer Genome Atlas (TCGA) database and Kaplan-Meier plotter database (www.kmplot.com).27 Based on the best expression cut-off value (FPKM) of each gene, patients were classified into two groups, association between survival rate and gene expression was examined, or the HR was calculated. Survival curves were estimated with the Kaplan-Meier method and compared using the log-rank test.
Immunofluorescence staining
For breast tumor tissues from patients, deidentified formalin-fixed paraffin embedded tissues were collected from mastectomy surgery with ethical approval by Nanjing Drum Tower Hospital in 2015. Sections were cut (4 µm thick), transferred to a warm water bath, and placed on a glass slide. The following immunofluorescence staining test was examined by the corresponding anti-human antibodies: TFEB (1:300, Invitrogen) and CD68 (1:300, Abcam).
Statistical analysis
Data were presented as mean±SD or SEM as indicated. Statistical significance was calculated using the Student’s t-test (two group comparison) or one-way analysis of variance (ANOVA) followed by post hoc Dunnett’s test (multigroup comparison) using the GraphPad Prism V.6.0. For the TCGA database analysis, p values were calculated for the comparison of the 5-year survival rates between the two groups. For the Kaplan-Meier plotter database, univariate Cox proportional hazard modeling of the genes was used to determine their independent impact on patients’ survival, and to estimate the corresponding HR, setting low expression as the reference group; HRs and 95% CI, as well as the p values, were reported. P<0.05 was considered significant.
Results
Breast cancer cell conditioned medium treatment results in a unique gene expression profile in MΦs
TAMs are often considered to adopt an M2 phenotype, which is typically induced by IL-4 or IL-13. However, the TME is a complex milieu; in addition to IL-4 and IL-13, many other factors, including hypoxia, apoptotic cancer cells and their debris, growth factors, and proinflammatory or anti-inflammatory cytokines secreted from cancer cells and stromal cells, act on TAMs. Therefore, the phenotype of TAMs is much more complex than that of typical M2 MΦs. Breast cancer EO771 cell conditioned medium (ECM) was used to treat BMDMs to mimic TAMs, and a microarray was performed to compare the gene expression profiles between those TAM-mimic cells and control MΦs. The results are summarized in a heatmap; we also plot a heatmap to compare the expression of the same set of genes in control MΦs, M1 MΦs (induced by LPS+IFNγ), and M2 MΦs (induced by IL-4) using the data we obtained from a previous microarray,28 in order to visualize the gene expression differences between TAM-mimic cells and M1 or M2 MΦs (figure 1A). First, we confirmed that like in IL-4 induced M2 MΦs, some typical M2 markers, including Arg1, IL-10, and TGFβ1, are increased in ECM-treated MΦs. However, unlike in M2 MΦs, the expression of many M1 markers, such as IL-1β, IL-6, tumor necrosis factor α (TNFα), iNOS and NLRP3, also are significantly increased in ECM-treated MΦs. Additionally, more resembling M1 than M2 MΦs, ECM-treated MΦs have elevated expression of HIF-1α, macrophage migration inhibitory factor (MIF), cPLA2, and cyclo-oxygenase-2 (COX2). COX2 catalyzes the production of prostaglandin E2 (PGE2), a key tumor-promoting and immune-suppressive metabolite in the TME. Also, unlike M2 MΦs but more like M1 MΦs, ECM-treated MΦs have reduced expression of TFEB and PPARγ. PPARγ controls several inflammatory response and cellular metabolism pathways. Using western blot analysis, we confirmed that TFEB and PPARγ are increased in M2 MΦs, but reduced in ECM-treated MΦs; while NLRP3 is reduced in M2 MΦs, but increased in ECM-treated MΦs (figure 1B).

Downregulation of TFEB renders macrophages (MΦs) tumor-promoting. (A) Clustering of gene expression profiles of individual runs for all common genes upregulated or downregulated by IL-4, LPS+IFNγ, or EO771 cell conditioned medium (ECM) are depicted as heatmap matrices according to the color scale shown at the bottom. Each group has four or three biological replicates. The microarray data have been deposited in Gene Expression Omnibus (GEO) database (accession numbers GSE73311 and GSE139554). (B) Western blot analysis of TFEB, PPARγ, and NLRP3 proteins in mouse peritoneal MΦs treated with or without 4T1 or ECM for 24 hours, and in IL-4 induced M2 MΦs with a comparison to non-treated M0 cells. (C) The strategy to generate MΦ-specific TFEB knockout mice. A map of the TFEB locus shows the location of LoxP sites and deletion of Exons 4–5 on exposure to LysM-Cre. (D–E) Quantitative real-time PCR (qPCR)(D) and Western blot (E) of peritoneal MΦs derived from control (TFEBfl/fl) and MΦ-TFEB-KO mice. Ponceau stain of total protein is shown as loading control. In qPCR data, data are shown as mean±SEM, n=3, **p<0.01, two-tailed Student’s t-test. (F) Tumor growth curve in C57Bl/6 mice transplanted with bone marrow cells from TFEBfl/fl (BM-WT) or MΦ-TFEB-KO (BM-TFEB-/-) mice, with representative tumors shown as inserts. (G) Mice were sacrificed, and the tumor weight of each mouse was measured on day 35 after tumor cell inoculation. (H) Flow cytometry analysis of MΦs in the cells isolated from the resected orthotopic breast tumors. (I) Gene expression in MΦs isolated from the breast tumors was analyzed by qPCR. Data are shown as mean±SEM, n=3, *p<0.05, **p<0.01, ***p<0.001; two-tailed Student’s t-test. Arg1, arginase 1; COX2, cyclo-oxygenase-2; cPLA2, cytosolic phospholipases A2; HIF-1α, hypoxia-inducible factor 1α; IL, interleukin; NLRP3, NLR Family Pyrin Domain Containing 3; PPARγ, peroxisome proliferator-activated receptor γ; TFEB, transcription factor EB; TNFα, necrosis tumor factor α; VEGFA, vascular endothelial growth factor A; WT, wild type.
MΦ TFEB ablation promotes breast tumor growth
We previously showed that TFEB overexpression in MΦs attenuated orthotopic breast tumor growth, while injection of MΦs with lentiviral knockdown of TFEB accelerated breast tumor growth.23 To further examine the function of MΦ TFEB in breast tumors, we aimed to test if TFEB ablation in MΦs promotes breast tumor growth via conferring TAMs with a more tumor-promoting phenotype. We therefore generated MΦ-specific TFEB knockout (MΦ-TFEB-/-) mice (figure 1C), whose BMDMs express TFEB at only ~25% level of WT control (figure 1D,E). We generated bone marrow chimeric mice by transplanting bone marrow cells from MΦ-TFEB-/- mice or Cre-littermates to lethally irradiated WT C57Bl/6 mice using our standard protocol.23 We implanted EO771 cells into mammary fat pads of the mice 4 weeks after the bone marrow transplantation. Tumor growth was monitored for 35 days, showing TFEB ablation in MΦs promoted tumor growth (figure 1F). At sacrifice, the weight of tumors from mice transplanted with bone marrow cells from MΦ-TFEB-/- mice was significantly increased compared with that of control mice (figure 1G). Single cell suspensions were obtained from tumors, and flow cytometry analysis showed that tumors in MΦ-TFEB-/- bone marrow recipient mice contained similar percentages of total F4/80+ MΦs or CD3+ T cells, but more CD206+ MΦs and CD3+/CD4+ T lymphocytes (figure 1H and online supplementary figure S1). MΦs were isolated from the tumors, and gene expression was analyzed using qPCR. The result shows that TAMs from the tumors in MΦ-TFEB-/- bone marrow recipient mice had lower expression levels of TFEB (~50%) and PPARγ (~70%), but higher levels of Arg1 (~3.7-fold), IL-10 (~2.2-fold), and COX2 (~2.5-fold) (figure 1I), suggesting TFEB ablation exaggerated the tumor-promoting phenotype of TAMs in breast tumors.
TFEB overexpression modifies MΦ gene expression in response to TCM treatment
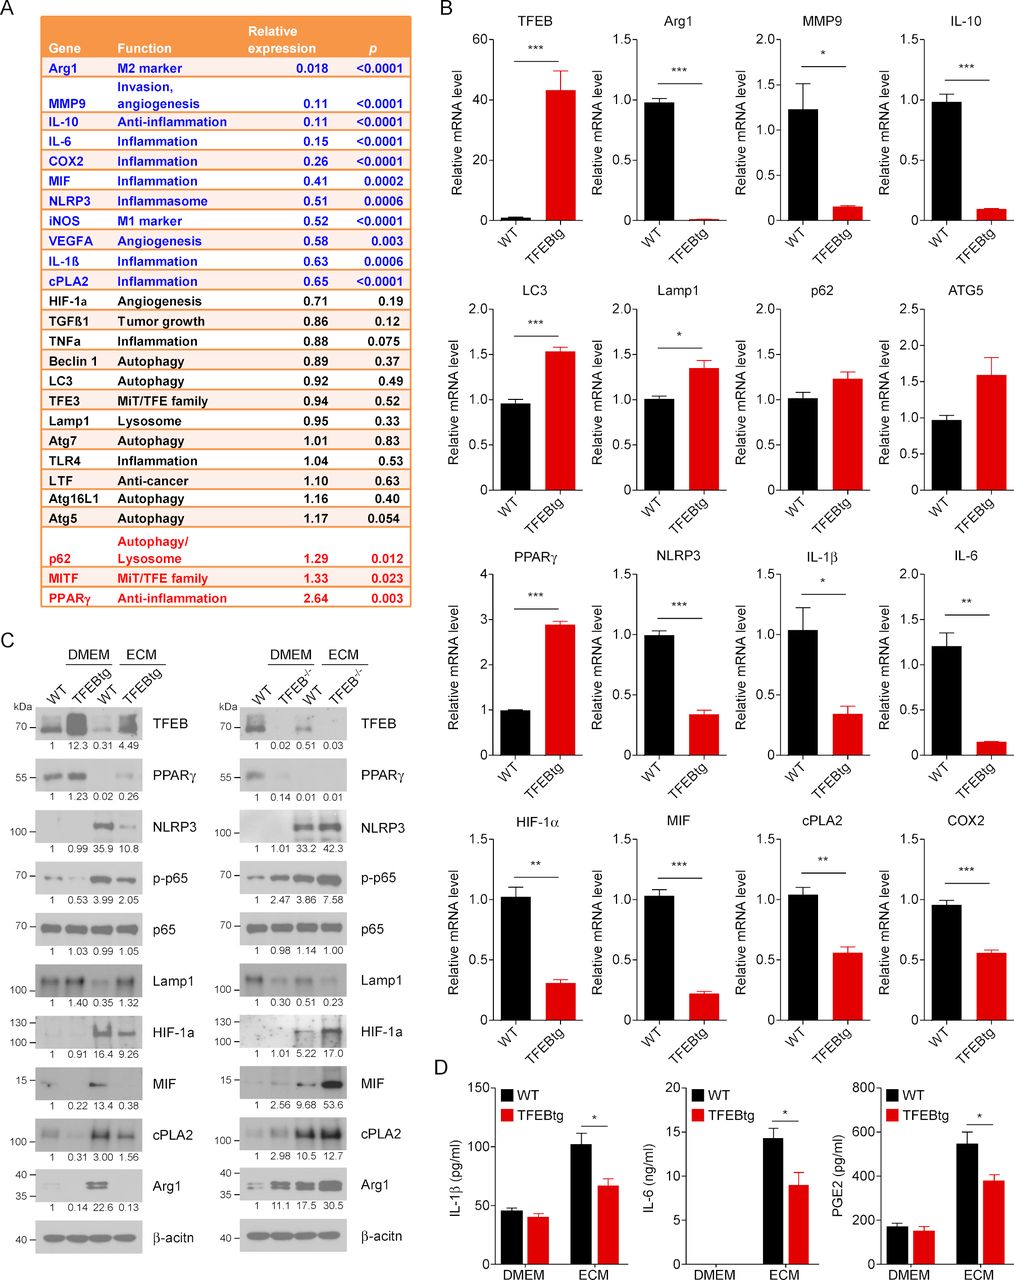
With the eventual goal of developing strategies to increase TFEB expression or activate TFEB in TAMs to halt breast tumor development, we next examined how TFEB overexpression may ameliorate the aberrant gene expression profile in TAMs. We have generated MΦ-TFEBtg mice in our previous studies.21 23 BMDMs from WT or MΦ-TFEBtg mice were treated with ECM and a microarray analysis was performed. A heatmap shows that 148 genes were downregulated, and 140 genes were upregulated in ECM-treated TFEBtg MΦs compared with ECM-treated WT MΦs (online supplementary figure S2A). Most significantly affected pathways relevant to MΦ functioning in inflammation and cancer were determined by Ingenuity IPA canonical pathway analyses. It was found that among the most significantly suppressed pathways in TFEBtg cells includes HIF-1α signaling, IL-10 signaling, IL-6 signaling, and VEGF signaling pathways (online supplementary figure S2B). The differences between WT and TFEBtg MΦs in the expression levels of the genes shown in figure 1A were also examined. It was shown that TFEB overexpression significantly ameliorates the tumor-promoting gene expression profile in TAM-like MΦs (figure 2A). The microarray results were confirmed by qPCR (figure 2B). These results suggest that TFEB overexpression may alter the TAM-like MΦ phenotype by (1) suppressing typical M2 MΦ markers such as Arg1, IL-10, MMP9, and VEGFA; these molecules are known to cause immunosuppression and tumor angiogenesis; (2) increasing the expression of genes involved in autophagy and lysosome biogenesis, such as LC3, Lamp1, P62, and ATG5; (3) enhancing PPARγ and inhibiting the NLRP3/IL-1β/IL-6 inflammatory axis; and (4) suppressing the PGE2 production axis HIF1α/MIF/cPLA2/COX2. We examined in our microarray data set if TFEB overexpression affected the expression of genes related antigen presenting function of MΦs when they are treated with TCM, such as β2-microglobulin, cathepsin E, and Tap1. We found no such genes were differentially expressed in WT or TFEBtg MΦs, suggesting that TFEB expression levels may not affect MΦs antigen presentation.

Transcriptionfactor EB (TFEB) overexpression alters the gene expression profile in macrophages (MΦs). (A) Bone marrow–derived macrophages (BMDMs) from wild-type (WT) or MΦ-specific TFEB transgenic (MΦ-TFEBtg) mice were treated with Dulbecco’s modified Eagle medium (DMEM) or EO771 cell conditioned medium (ECM) for 24 hours; microarray was performed to analyze their gene expression profiles. A heatmap of genes differentially expressed in WT or TFEBtg is shown in online supplementary figure S2. A list of key genes that play roles in tumor-associated macrophage (TAM) functions is shown; relative expression means the ratio of the gene expression levels in TFEBtg MΦs compared with those in WT MΦs. The microarray data have been deposited in Gene Expression Omnibus (GEO) database (accession number GSE139554). (B) Quantitativereal-time PCR (qPCR) confirmation of the microarray data for the key genes. n=3, *p<0.05; **p<0.01; ***p<0.001; two-tailed Student’s t-test. (C) Western blot analysis of indicated proteins in BMDMs from WT, MΦ-TFEBtg or MΦ-TFEB-/- mice. The cells were treated with ECM for 24 hours. The number under a band indicates the relative intensity of the protein to β-actin (the relative intensity of the first band is set as 1). A representative blot is shown. (D) BMDMs from WT and TFEBtg MΦs were treated with DMEM or ECM for 24 hours; then the medium was replaced with fresh DMEM, and the conditioned medium was collected 16 hours later for analysis for IL-1β, IL-6 and prostaglandin E2 contents. n=5, *p<0.05; two-tailed Student’s t-test. Arg1, arginase 1; COX2, cyclo-oxygenase-2; cPLA2, cytosolic phospholipases A2; HIF-1α, hypoxia-inducible factor 1α; IL, interleukin; NLRP3, NLR Family Pyrin Domain Containing 3; PPARγ, peroxisome proliferator-activated receptor γ; TNFα, necrosis tumor factor α.
Western blot was performed to confirm some of the gene expression results using WT, TFEBtg and TFEB-/- BMDMs. The results show that, in ECM-treated BMDMs, TFEB overexpression increased the protein levels of PPARγ and Lamp1 but decreased the phosphorylation of p65 and the protein levels of NLRP3, HIF-1α, MIF, cPLA2, and Arg1, while TFEB knockout had the opposite effects on these proteins (figure 2C). We further examined the impact of TFEB overexpression on the production of three direct MΦ effector molecules IL-1β, IL-6 and PGE2. We treated WT and TFEBtg BMDMs with ECM for 24 hours, then the cells were rinsed and cultured in fresh, serum-free DMEM for a further 16 hours before the medium was collected for ELISA measurement of IL-1β and IL-6, and colorimetric measurement of PGE2. The data show that TFEB overexpression significantly suppressed the elevated levels of IL-1β, IL-6 and PGE2 in ECM-treated BMDMs (figure 2D).
TFEB directly regulates PPARγ expression in TAMs
TFEB binds to a short consensus sequence CANNTG called the E-box on target gene promoters or intron regions to control gene transcription.29 It has been reported that TFEB transcriptionally regulates PPARγ expression in human adipocytes.30 To test if TFEB directly regulates PPARγ transcription in mouse MΦs, we performed a promoter assay. As shown in figure 3A, TFEB overexpression increased luciferase activity in the cells transfected with E-box containing plasmids PPARγ-1158 and PPARγ-891, suggesting that the first and at least one of 2–4 E-boxes are directly involved in TFEB binding.

PPARγ mediates part of the effects of TFEB in macrophages (MΦs). (A) Luciferase promoter activity assay of the binding of TFEB to PPARγ promoter regions; **p<0.01. (B) Western blot analysis of the indicated protein levels in wild-type (WT) or TFEB transgenic (TFEBtg) bone marrow–derived MΦs (BMDMs) treated with EO771 cell conditioned medium (ECM) with or without GW9662, a PPARγ antagonist. The quantification is shown in online supplementary figure S3. (C) Quantitative real-time PCR analysis of expression of the indicated genes in WT and TFEBtg BMDMs treated with ECM with or without GW9662. n=3; *p<0.05, **p<0.01, ***p<0.001; two-tailed Student’s t-test. Arg1, arginase 1; COX2, cyclo-oxygenase-2; cPLA2, cytosolic phospholipases A2; HIF-1α, hypoxia-inducible factor 1α; IL, interleukin; PPARγ, peroxisome proliferator-activated receptor γ; TFEB, transcription factor EB.
To provide further evidence that PPARγ is directly involved in mediating the effects of TFEB on TAMs, the PPARγ antagonist GW9662 was used to inhibit its activity in BMDMs. WT and TFEBtg BMDMs were treated with ECM with or without 10 µM GW9662 for 24 hours (figure 3B,C and online supplementary figure S3). Both mRNA and protein levels of TFEB in BMDMs were not altered by PPARγ inhibition, and PPARγ inhibition did not change Beclin 1 protein levels in BMDMs. Interestingly, while PPARγ mRNA expression was not changed by GW9662, its protein levels were remarkably reduced by GW9662 in ECM-treated TFEBtg BMDMs to a level comparable with ECM-treated WT BMDMs (both almost undetectable). The mechanism by which GW9662 reduces PPARγ protein in BMDMs is unknown. Importantly, PPARγ inhibition increased p65 phosphorylation and the expression of NLRP3, IL-1β, HIF-1α, and cPLA2 in both ECM-treated WT and TFEBtg BMDMs. The differences between ECM-treated WT and TFEBtg BMDMs in p65 phosphorylation and expression of NLRP3 (mRNA and protein), IL-1β (mRNA), HIF-1α (protein), and cPLA2 (protein) were diminished, but the differences in HIF-1α and cPLA2 mRNA levels were not decreased. These results suggest that PPARγ partially mediates the suppressive effects of TFEB on NF-κB activation and NLRP3 and HIF-1α upregulation in ECM-treated BMDMs. Taken together, these data demonstrate that TFEB directly regulates PPARγ transcription and partially through this mechanism, TFEB modulates NLRP3/IL-1β and HIF1α/cPLA2 pathways in MΦs.
TFEB’s regulation of MΦs is partially dependent on autophagy
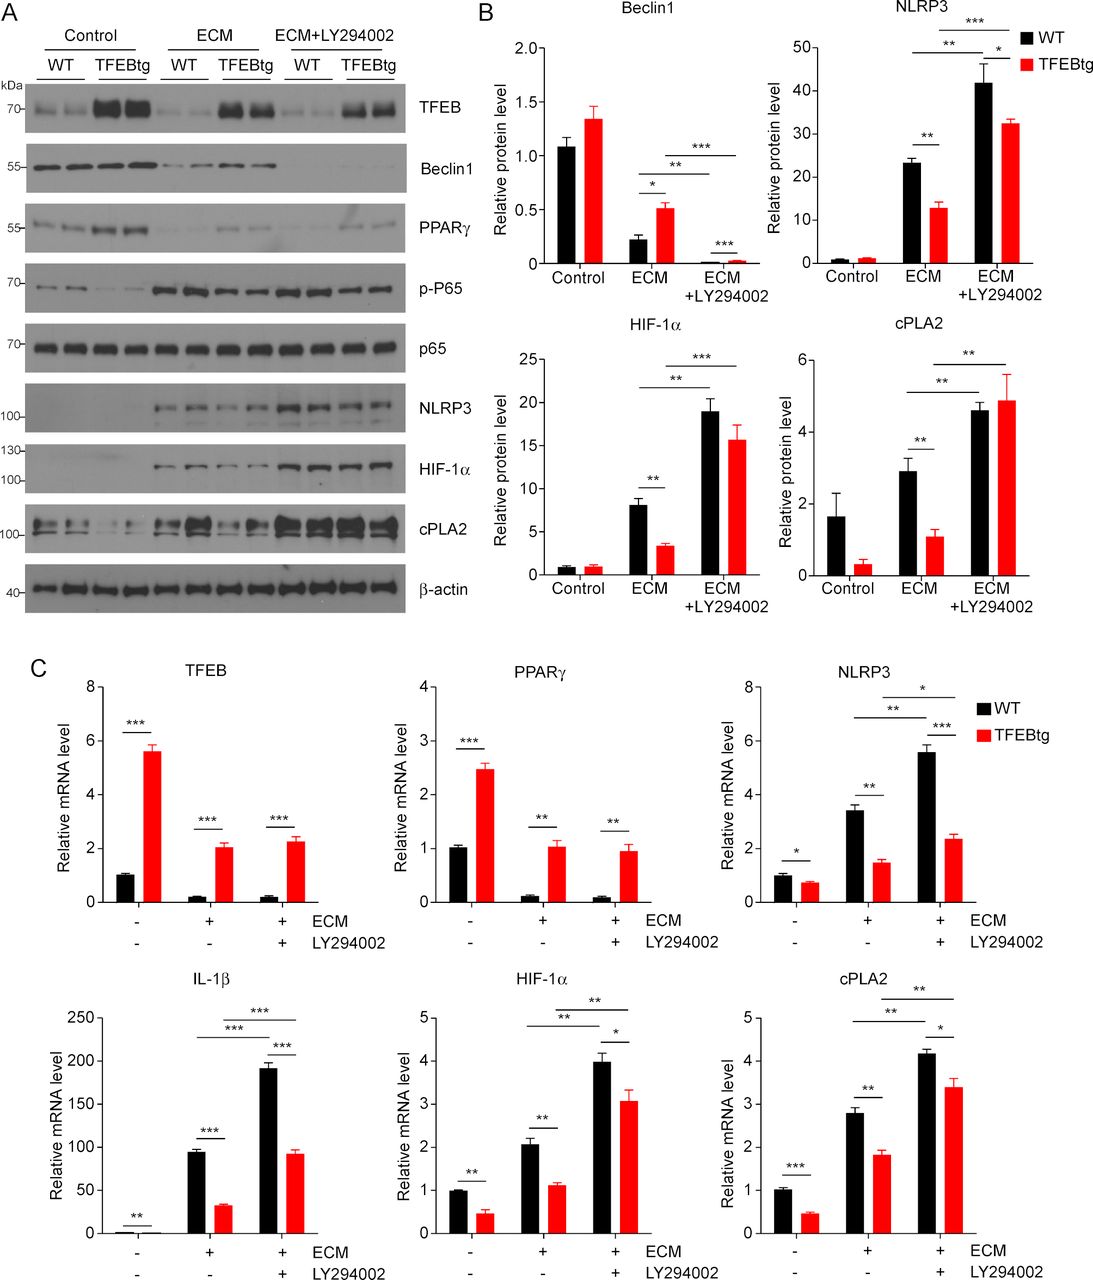
TFEB is a key regulator of autophagy and lysosome biogenesis,20 and autophagy and associated lysosomal activation are known to counteract NLRP3 inflammasome activity15 and mediate HIF-1α degradation.16 PI3K is required for autophagy and its inhibitor LY294002 can inhibit autophagic sequestration, a required first step of autophagy.31 Therefore, we aimed to examine if autophagy inhibition by LY294002 could negate the impact of TFEB overexpression on MΦs. We treated WT and TFEBtg BMDMs with ECM with or without LY294002 and measured the expression of some of the key molecules mentioned previously. LY294002 could effectively block autophagy by abolishing Beclin 1 protein, but it did not change the expression of TFEB and PPARγ, nor did it affect p65 phosphorylation in either ECM-treated WT or TFEBtg BMDMs (figure 4A–C and online supplementary figure S4). Importantly, autophagy inhibition significantly enhanced NLRP3, IL-1β, HIF-1α, and cPLA2 expression in both ECM-treated WT and TFEBtg BMDMs, and diminished the differences in HIF-1α and cPLA2 protein levels in those cells (figure 4A–C and online supplementary figure S4). These results suggest that autophagy partially mediates the beneficial effects of TFEB on TAMs.

Autophagy-lysosome axis partially mediates the effects of transcription factor EB (TFEB) in macrophages (MΦs). (A) Western blot analysis of indicated proteins in wild-type (WT) or TFEB transgenic (TFEBtg) bone marrow–derived MΦs (BMDMs) treated with EO771 cell conditioned medium (ECM) with or without LY294002, a PI3K and autophagy inhibitor. (B) Band intensities of selected proteins were quantified by Gel-Pro Analyzer software and normalized by β-actin protein; n=3, *p<0.05, **p<0.01. The quantification of other proteins is shown in online supplementary figure S4. (C) Quantitativereal-time PCR analysis of the expression of indicated genes in WT or TFEBtg BMDMs treated with ECM with or without LY294002. Data are presented as mean±SD; n=3. *p<0.05, **p<0.01, ***p<0.001; two-tailed Student’s t-test. cPLA2, cytosolic phospholipases A2; HIF-1α, hypoxia-inducible factor 1α; IL, interleukin; NLRP3, NLR Family Pyrin Domain Containing 3; PPARγ, peroxisome proliferator-activated receptor γ.
Trehalose activates MΦ TFEB and suppresses orthotopic breast tumor growth
Our previous study showed that trehalose, a natural disaccharide, activates MΦ TFEB and enhances MΦ autophagy and phagocytosis of apoptotic cells.21 We here first confirmed that similar to HPβCD, also a TFEB activator,32 and chloroquine, an autophagic flux inhibitor that activates TFEB,33 trehalose increased TFEB nuclear translocation and total cellular TFEB in ECM-treated MΦs (online supplementary figure S5A,B). To test whether trehalose can modulate TAM function in breast tumors through activating TFEB, we treated BMDMs with ECM with or without trehalose. qPCR showed that while trehalose did not affect the expression of TFEB in ECM-treated MΦs, activation of TFEB by trehalose replicated the gene expression profile observed in TFEBtg MΦs, including increased expression of PPARγ and Lamp1, and decreased expression of NLRP3, IL-1β, HIF-1α, cPLA2 and COX2 (figure 5A). The results were further confirmed by western blot analysis (figure 5B and online supplementary figure S5C). Furthermore, trehalose treatment reduced the secretion of IL-1β, IL-6, and PGE2 from ECM-treated MΦs (figure 5C). We then examined if the activation of TFEB by trehalose is dependent on autophagy. We treated BMDMs from MΦ-specific Atg5 knockout mice25 and control WT littermates with trehalose, and we found that (1) Atg5 depletion is very efficient in the MΦs from MΦ-specific Atg5 knockout mice, (2) trehalose significantly increased Atg5 expression in WT MΦs but not in Atg5-deficient MΦs, and (3) trehalose equally increased the expression of TFEB targeted gene PPARγ in WT and Atg5-deficient MΦs (online supplementary figure S5D). These results confirmed that trehalose activates TFEB in MΦs independent of autophagy since Atg5 is required for autophagy.
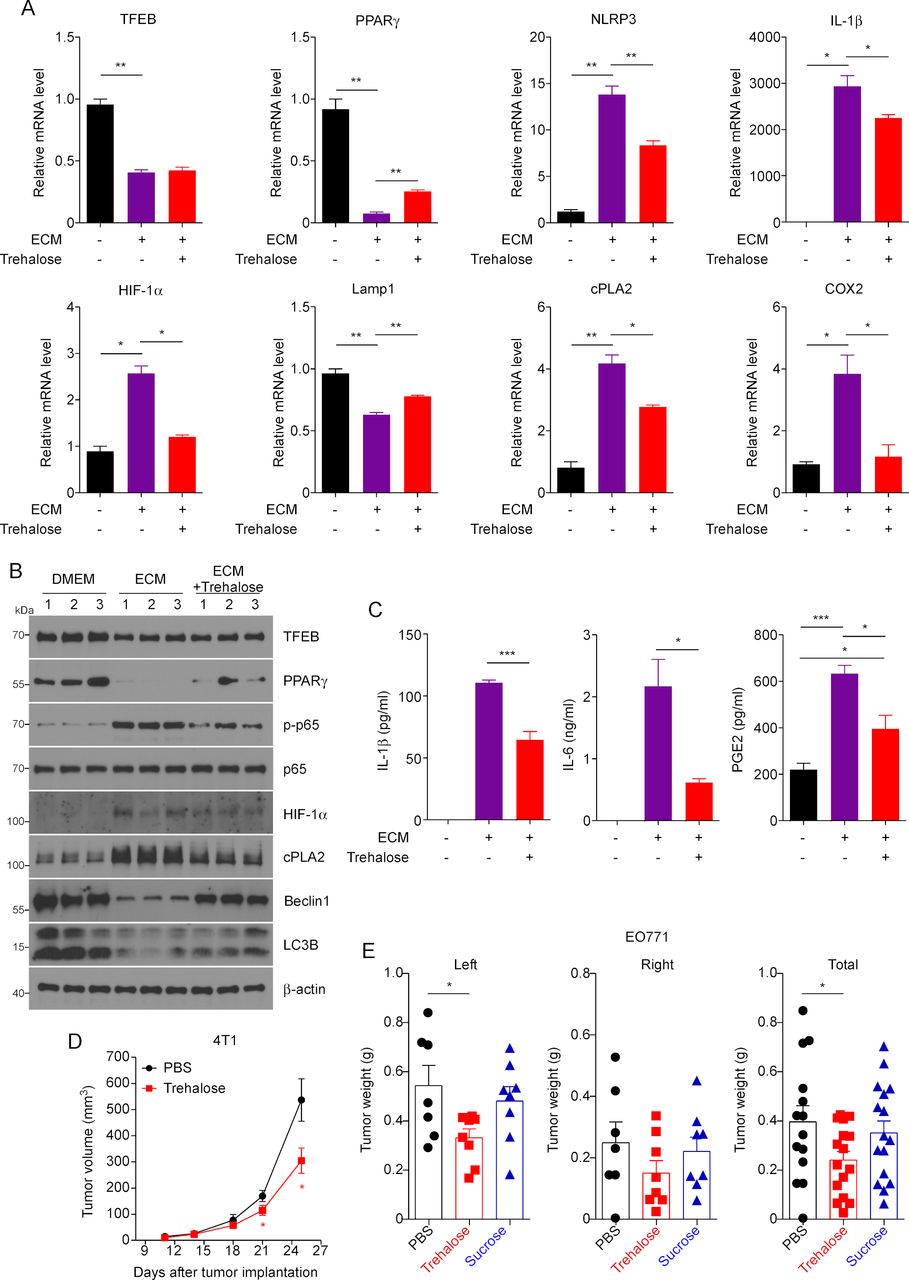
TFEB activator trehalose modulates macrophages (MΦs) function and suppresses breast tumor growth. (A) Quantitative real-time PCR analysis of expression of the indicated genes in mouse peritoneal MΦs (pMΦs) treated EO771 cell conditioned medium (ECM) with or without trehalose. (B) Western blot analysis of indicated proteins in mouse pMΦs treated with ECM with or without trehalose. The quantification is shown in online supplementary figure S5C. (C) IL-1β, IL-6 and PGE2 productions were determined in medium of mouse pMΦs treated with ECM with or without trehalose. n=4, *p<0.05, **p<0.01. (D) Growth curve of orthotopic 4T1 breast tumors in female Balb/c mice treated with vehicle or trehalose. Data are expressed as mean±SD for each group; Student’s t-test; *p<0.05, vs Veh (vehicle). (E) EO771 breast tumor-bearing mice were treated with Veh, trehalose or sucrose for 20 days before the mice were sacrificed for tumor measurement. One-way analysis of variance with Bonferroni’s post-test; *p<0.05. COX2, cyclo-oxygenase-2; cPLA2, cytosolic phospholipases A2; HIF-1α, hypoxia-inducible factor 1α; IL, interleukin; MΦs, macrophages; NLRP3, NLR Family Pyrin Domain Containing 3; PBS, phosphate-buffered saline; PGE, prostaglandin E2; PPARγ, peroxisome proliferator-activated receptor γ; TFEB, transcription factor EB.
We next tested if trehalose treatment could inhibit breast tumor growth. We treated female Balb/c mice with trehalose for 25 days at 2 g/kg, three times per week, starting 1 day after 4T1 cell inoculation, and monitored the growth of the tumors. It is shown that trehalose treatment significantly delayed tumor growth (figure 5D). To verify if the benefit of trehalose in indeed due to the modulation of the immune microenvironment, we performed qPCR to measure the expression of Arg1 and IFNγ to reflect the abundance of M2-like TAMs and cytotoxic T cells, respectively, in the tumors. We found that the tumors from trehalose treated mice displayed significantly lower expression of Arg1 but higher expression of IFNγ (online supplementary figure S6A). The experiment was repeated using C57Bl/6 mice inoculated with EO771 cells; a sucrose control group also was included. The results show that trehalose, but not sucrose, significantly reduced breast tumor growth (figure 5E). In addition, we used the C3(1)/SV40Tag spontaneous breast tumor mouse model to confirm the effects of trehalose. Female C3(1)/SV40Tag mice were treated with trehalose (2 g/kg, three times a week) or vehicle from 6 to 17 weeks of age. The results demonstrated a trend in the reduction of mammary gland tumor size related to trehalose administration but not in the number of tumors (online supplementary figure S6B).
TFEB expression is a positive marker for breast cancer prognosis
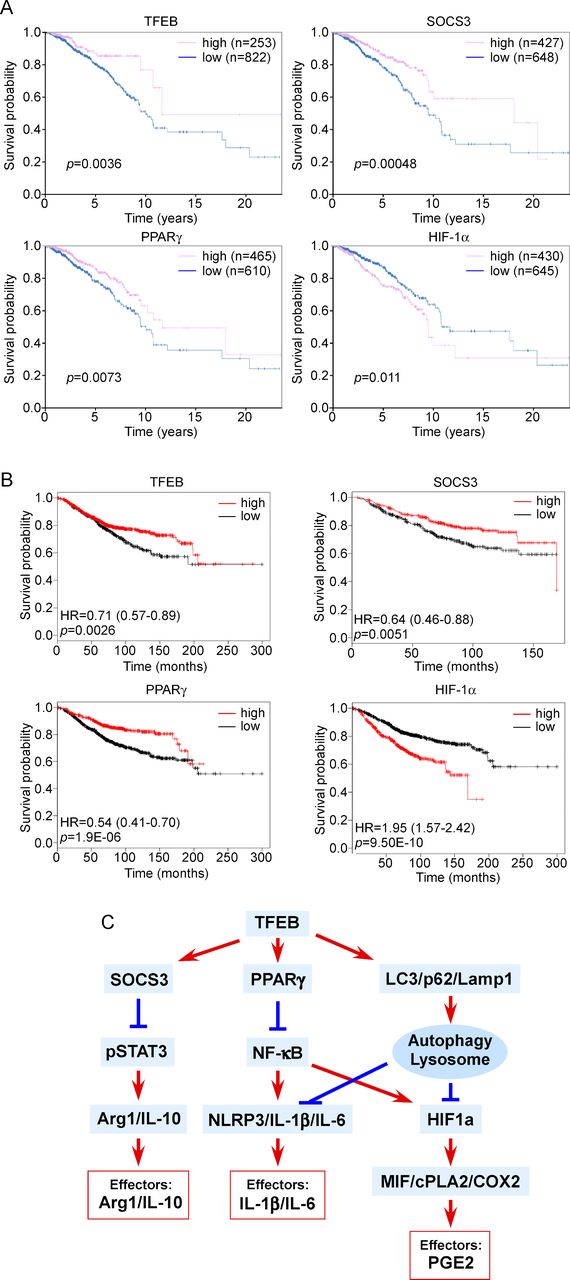
We used the TCGA database to analyze the association between the expression of TFEB or its regulated genes and breast cancer survival. We found 822 patients with low TFEB expression and 253 patients with high TFEB expression. The data indicate that 5-year survival is significantly higher in the patients with higher TFEB expression levels compared with those with lower TFEB expression levels (87% vs 80%, p=0.0036) (figure 6A). Similarly, higher expression levels of SOCS3 and PPARγ are correlated with a higher survival rate, while higher expression levels of HIF-1α are associated with a lower survival rate (figure 6A). The result was confirmed using another online analysis platform. TFEB, SOCS3, and PPARγ are shown to be positive prognostic factors, while HIF-1α is a negative prognostic factor (figure 6B). Although the expression of these genes is not only from TAMs, the data suggest that activating TFEB and thus increasing the expression of SOCS3 and PPARγ while reducing the expression of HIF-1α in breast tumors may be beneficial for patients with breast cancer. To further examine if suppression of TFEB expression in TAMs is true in human breast tumors, we stained TFEB using human breast tumor specimens. Breast tumors from five triple negative breast cancer patients were stained for CD68, TFEB and 4′,6-diamidino-2-phenylindole (DAPI). The data show that TFEB staining intensity is significantly lower in the MΦs in the tumor nest than that in the tumor periphery (online supplementary figure S7).

The clinical relevance of macrophage (MΦ) signaling axes regulated by transcription factor EB (TFEB). (A) The prognostic value of TFEB and the genes regulated by TFEB for patients with breast cancer based on the CTGA Human Protein Atlas database. (B) The prognostic value of TFEB and the genes regulated by TFEB for patients with breast cancer based on the online survival analysis platform www.kmplot.com. (C) A schematic drawing depicting how TFEB regulates macrophage functions in breast tumors. Arg1, arginase 1; COX2, cyclo-oxygenase-2; cPLA2, cytosolic phospholipases A2; HIF-1α, hypoxia-inducible factor 1α; IL, interleukin; NLRP3, NLR Family Pyrin Domain Containing 3; PGE, prostaglandin E2; PPARγ, peroxisome proliferator-activated receptor γ; SOCS3, suppressor of cytokine signaling 3.
Discussion
As high as 50% of the cells within breast tumors are MΦs, called TAMs; and these TAMs play important roles in tumor development, metastasis, and resistance to therapies including recently developed immune check point inhibitors.34 Therefore, targeting TAMs is an actively pursued strategy for solid tumor treatment. MΦ depletion is not a viable approach since these cells are the first line of defense against infection and play vital roles in many physiological processes. Blocking the tumor-promoting signaling pathways and antagonizing resulting key effector molecules in TAMs are promising approaches. However, there are many interconnected pathways that collectively define the phenotype of TAMs and numerous effector molecules that execute tumor-promoting functions, thus targeting any single pathway or effector molecule is not sufficient to achieve clinical benefit.
We identified TFEB as a target whose activation results in beneficial alterations in several key pathways and suppression of many tumor-promoting effector molecules in TAMs (figure 6C). First, TFEB upregulates SOCS3 and thus suppresses STAT3 activation, thereby blocking MΦ M2-like polarization and the production of Arg1 and IL-10.23 Second, TFEB activates the transcription of PPARγ, which blunts NFκB activation, resulting in downregulation of NLRP3/IL-1β/IL-6 axis and HIF-1α transcription. Third, TFEB enhances autophagy and lysosome activities, which counteract the NLRP3 inflammasome as well as lead to degradation of HIF-1α protein.
PPARγ is at the critical crossroad of inflammation and lipid metabolism. In TAMs, NFκB is activated through multiple pathways, including TLR activation35 and response to hypoxia,36 leading to transcription of proinflammatory cytokines and HIF-1α.37 PPARγ acts as an E3 ligase that induces the degradation of NFκB/p65.37 Our data demonstrate that TFEB upregulates PPARγ by directly binding to its promoter, and thereby downregulates inflammatory mediators NLRP3, IL-1β and IL6, and HIF-1α.
During MΦ inflammatory responses, NLRP3 and IL-1β expression is controlled by NF-κB (nuclear factor kappa-light-chain-enhancer of activated B cells), and NLRP3 inflammasome processes pro-IL-1β protein into mature IL-1β.38 In breast cancer, IL-1β has been linked to the proliferation, invasion, angiogenesis, and inhibition of apoptosis in cancer cells.39 IL-1β further induces IL-6 expression40; and IL-6 not only induces cancer cell proliferation, but also induces EMT and the formation and maintenance of breast cancer stem cells.41 The NLRP3 inflammasome is known to be negatively regulated by autophagy/lysosome.15 Our data show that in TAMs, TFEB may negatively regulate NLRP3 inflammasome via PPARγ-mediated NFκB suppression and enhanced autophagy and lysosome activities.
In response to the hypoxic TME, the expression of HIF-1α is upregulated and the protein is stabilized in cancer cells as well as stromal cells including TAMs. Among several downstream signaling events, HIF-1α in MΦs activates the MIF/cPLA2/COX2 axis, leading to PGE2 production.13 PGE2 promotes breast cancer progression by multiple mechanisms: inactivation of host antitumor immune cells,42 43 stimulation of tumor cell migration and invasiveness,44–46 induction of stem-like cells,47 tumor-associated angiogenesis44 and lymphangiogenesis.48 Our results suggest that in breast tumors, TFEB suppresses HIF-1α transcription via PPARγ-mediated NFκB inactivation and also reduces HIF-1α protein by autophagy/lysosome-mediated degradation in TAMs, leading to suppression of the MIF/cPLA2/COX2 signaling pathway and reduced production of PGE2.
These cell culture study results are further strengthened by mouse studies showing that (1) MΦ-specific TFEB knockout promoted breast tumor growth by enhancing the tumor-promoting phenotype of TAMs; and (2) trehalose, a TFEB activator, modulated MΦ gene expression and function towards a less tumor-promoting phenotype and thereby inhibited breast tumor growth in multiple breast cancer mouse models. Moreover, analysis of breast cancer patient tumor genome data revealed that TFEB, SOCS3, and PPARγ are positive prognostic markers of breast cancer, while HIF-1α is a negative prognostic marker. While TAMs only contribute to part of the expression levels of these genes, the human data suggest that therapies that increase the expression or activity of TFEB in TAMs as well as other cell types in breast tumors may be effective in halting breast cancer development.
Conclusions
Our study identifies TFEB as a master regulator of TAMs in breast cancer. TFEB controls TAM gene expression and function through multiple pathways. By activating SOCS3, TFEB suppresses STAT3 signaling for M2-like activation of MΦs. By upregulating PPARγ, TFEB suppresses NF-κB activation and thus inflammasome activity and HIF-1α mediated hypoxic response. By activating autophagy/lysosome activities, TFEB promotes degradation of NLRP3 inflammasomes and HIF-1α protein. Collectively, TFEB activation simultaneously inhibits multiple effector molecules that exert the tumor-promoting function of TAMs, including Arg1, IL-10, IL-1β, IL-6 and PGE2. Therefore, TFEB is a promising therapeutic target for breast cancer and possibly other solid malignant tumors.
References
Footnotes
YL and JH contributed equally.
Contributors DF and JH designed the study; YL and JH performed most of the experiments; QL, JW and YW assisted in the experiments; TDE and BR generated the MΦ-TFEBtg and MΦ-TFEB-/- mice; EAM provided the C3(1)/SV40Tag. DA performed the microarrays. DF and YL drafted the manuscript; JH, YY, BR, and EAM helped in data interpretation and manuscript writing. All authors read and approved the final manuscript.
Funding This work was supported by the National Institute of Health grants R01CA218578 (to DF and EAM) and R21CA216230 (to DF). JH has been supported by the Susan G. Komen trainee program (GTDR17500160).
Competing interests None declared.
Patient consent for publication Not required.
Ethics approval Animal care procedures and experimental methods were approved by the Institutional Animal Care and Use Committee of the University of South Carolina according to National Institutes of Health guidelines.
Provenance and peer review Not commissioned; externally peer reviewed.
Data availability statement Data are available in a public, open access repository. The microarray data have been deposited in Gene Expression Omnibus (GEO) database (accession numbers GSE73311 and GSE139554).