Article Text

Abstract
Background The immunosuppressive desmoplastic stroma of pancreatic cancer represents a major hurdle to developing an effective immune response. Preclinical studies in pancreatic cancer have demonstrated promising anti-tumor activity with Bruton tyrosine kinase (BTK) inhibition combined with programmed cell death receptor-1 (PD-1) blockade.
Methods This was a phase II, multicenter, open-label, randomized (1:1) clinical trial evaluating the BTK inhibitor acalabrutinib, alone (monotherapy) or in combination with the anti-PD-1 antibody pembrolizumab (combination therapy). Eligible patients were adults with histologically confirmed metastatic or locally advanced unresectable pancreatic ductal adenocarcinoma with an Eastern Cooperative Oncology Group Performance Status (ECOG PS) ≤1 who had received at least one prior systemic therapy. Oral acalabrutinib 100 mg twice daily was administered with or without intravenous pembrolizumab 200 mg on day 1 of each 3-week cycle. Peripheral blood was analyzed for changes in immune markers, and tumors from exceptional responders were molecularly analyzed.
Results A total of 77 patients were enrolled (37 monotherapy; 40 combination therapy) with a median age of 64 years; 77% had an ECOG PS of 1. The median number of prior therapies was 3 (range 1–6). Grade 3–4 treatment-related adverse events were seen in 14.3% of patients in the monotherapy arm and 15.8% of those in the combination therapy arm. The overall response rate and disease control rate were 0% and 14.3% with monotherapy and 7.9% and 21.1% with combination therapy, respectively. Median progression-free survival was 1.4 months in both arms. Peripheral blood flow analysis demonstrated consistent reductions in granulocytic (CD15+) myeloid-derived suppressor cells (MDSCs) over time. Two exceptional responders were found to be microsatellite stable with low tumor mutation burden, low neoantigen load and no defects in the homologous DNA repair pathway.
Conclusions The combination of acalabrutinib and pembrolizumab was well tolerated, but limited clinical activity was seen with either acalabrutinib monotherapy or combination therapy. Peripheral reductions in MDSCs were seen. Efforts to understand and target the pancreatic tumor microenvironment should continue.
Trial registration number NCT02362048.
- clinical trials, phase II as topic
- immunotherapy
- programmed cell death 1 receptor
- myeloid-derived suppressor cells
- CTLA-4 antigen
This is an open access article distributed in accordance with the Creative Commons Attribution Non Commercial (CC BY-NC 4.0) license, which permits others to distribute, remix, adapt, build upon this work non-commercially, and license their derivative works on different terms, provided the original work is properly cited, appropriate credit is given, any changes made indicated, and the use is non-commercial. See http://creativecommons.org/licenses/by-nc/4.0/.
Statistics from Altmetric.com
- clinical trials, phase II as topic
- immunotherapy
- programmed cell death 1 receptor
- myeloid-derived suppressor cells
- CTLA-4 antigen
Background
Pancreatic cancer is the 12th most common cancer worldwide and is a major cause of cancer death, with incidence and mortality being nearly identical. This reflects its aggressive disease course, with the majority of patients presenting with metastatic disease and limited effective systemic chemotherapy options; median progression-free survival (PFS) remains at 6 months or below with intensive polychemotherapy.1 2
Immunotherapy represents a novel approach to cancer treatment. Pancreatic cancer samples have been shown to express programmed cell deathligand- 1 (PD-L1), with resultant poor prognosis.3 4 In addition, PD-L1 expression has been correlated with regulatory T-cell (Treg) infiltration and inversely correlated with cytotoxic T-lymphocyte infiltration.3 4 Treatment with antiprogrammed cell death receptor-1 (anti-PD-1) or anti-PD-L1 agents has shown some efficacy in other cancer types, with evidence for an association between alterations in DNA damage response and repair genes and clinical benefit.5 However, clinical data have demonstrated limited to no activity with single-agent anti-PD-1 or anti-PD-L1 therapies in pancreatic cancer.6
The desmoplastic microenvironment that surrounds pancreatic cancer has been recognized to play an integral role in pancreatic cancer biology, including promoting tumor growth and restraining immunologically mediated tumor cell killing.7–9 Pancreatic stroma comprises a mix of fibroblasts (pancreatic stellate cells) and an abundance of mast cells, immunosuppressive Tregs, myeloid-derived suppressor cells (MDSCs) and tumor-associated macrophages (TAMs).
Bruton tyrosine kinase (BTK) is a non-receptor enzyme in the Tec kinase family that is expressed among cells of hematopoietic origin, including B cells, myeloid cells, mast cells and platelets. BTK-dependent signaling within mast cells and myeloid cells in peri-tumoral inflammatory stroma has been shown to be critical to the maintenance of this complex microenvironment.10 11 In addition, elevation of circulating MDSCs has been correlated with progression in patients with solid tumors treated with anti-cytotoxic T-lymphocyte-associated protein-4 (anti-CTLA-4) or anti-PD-1/PD-L1-based therapy.12 13 Based on these observations, BTK inhibition was explored in a murine model of pancreatic cancer in which BTK inhibition converted M2-like macrophages to an M1-like phenotype, with resultant promotion of cluster of differentiation 8 (CD8)-mediated T-cell cytotoxicity.14 A statistically significant reduction in tumor size was also seen when BTK inhibition was combined with gemcitabine chemotherapy.14
Based on these findings, we initiated a randomized phase II clinical trial to investigate the effect of BTK inhibition in patients with advanced pancreatic cancer using acalabrutinib, a highly selective and potent covalent inhibitor of BTK, alone and in conjunction with the anti-PD-1 antibody pembrolizumab.
Methods
Study design and participants
This was a phase II, multicenter, open-label, randomized clinical trial evaluating acalabrutinib monotherapy and the combination of acalabrutinib and pembrolizumab in patients with advanced or metastatic pancreatic cancer (KEYNOTE144). The trial was conducted at 12 sites in the USA between June 2, 2015 and March 27, 2017.
Eligibility criteria were Eastern Cooperative Oncology Group Performance Status (ECOG PS) of 0 or 1, advanced pancreatic ductal adenocarcinoma that is unresectable or metastatic, one or more prior systemic chemotherapy regimens for unresectable or metastatic pancreatic cancer, measurable disease according to Response Evaluation Criteria in Solid Tumors (RECIST) V.1.1, adequate organ function, and the ability to provide an archived tissue sample or newly obtained core biopsy. Prior treatment with BTK inhibitors, mammalian target of rapamycin inhibitors, phosphatidylinositol-3 kinase inhibitors, anti-PD-1/PD-L1 antibodies or anti-CTLA-4 antibodies was not allowed. Additional exclusion criteria included significant autoimmune disease, history of bleeding diathesis, treatment with a strong cytochrome P450 3A4 inhibitor/inducer, use of warfarin, use of proton pump inhibitors and stroke within the last 6 months.
Patients were randomized 1:1 to acalabrutinib 100 mg administered orally twice daily either as monotherapy or in combination with pembrolizumab 200 mg administered intravenously every 3 weeks. Given that the safety of acalabrutinib in combination with pembrolizumab was unknown, an initial safety hold occurred after six patients in each arm were treated, and enrollment was continued because not more than one dose-limiting toxicity was observed in either arm. Restaging scans were performed every 6 weeks for the first three scans, then every 12 weeks. RECIST V.1.1 was used for efficacy end points, although patients were allowed to continue treatment according to RECIST-based immune criteria.15 16 In addition, patients in the acalabrutinib monotherapy arm were allowed to cross over to combination therapy at the time of progression.
Flow cytometry, gene expression and PD-L1 analysis
Multiparametric flow cytometric analysis of available peripheral blood mononuclear cell (PBMC) samples (collected at weeks 1 (pretreatment), 2, 3, 4, 7, 10 and 13) was conducted. The absolute number for each T-cell or myeloid cell subset was calculated by multiplying the absolute number of lymphocytes or monocytes per microliter of blood on the complete blood count analysis, with the percentage of cellular subsets determined on PBMC flow cytometric analysis. Percentage change in absolute numbers of immune cell subsets and percentage change in mean fluorescent intensity (MFI) of immune markers on each subset in pretreatment versus on-treatment samples were calculated.
Gene expression profiling of peripheral blood (PB; PAXgene tubes, PreAnalytiX, Hombrechtikon, Switzerland) was performed with HumanHT-12 V.4 whole-transcriptome microarrays (Illumina, San Diego, California, USA) both pretreatment (baseline/week 1) and after 6 weeks of therapy (week 7).
Exceptional responder analysis
PBMCs and baseline paraffin-embedded tumor tissue from two responding patients, exceptional responders 1 and 2, as well as six progressive patients, were analyzed for both RNA and DNA sequencing. In the two exceptional responders, baseline tumor tissue comprised a pancreatic tumor resection specimen and peritoneal resection specimen, respectively.
DNA and RNA sequencing were performed on formalin-fixed, paraffin-embedded tumor tissue blocks from nine available pancreatic ductal adenocarcinoma samples, using previously described standard protocols, at the Michigan Center for Translation Pathology (Michigan Medicine, Ann Arbor, Michigan, USA), a Clinical Laboratory Improvement Amendments-compliant sequencing laboratory.17 18 Briefly, genomic DNA and RNA from the same tumor sample were purified using the AllPrep DNA/RNA/miRNA kit (QIAGEN, Germantown, Maryland, USA) for tumor whole-exome and capture transcriptome sequencing. Matched normal genomic DNA was isolated from blood or adjacent normal tissue using the DNeasy Blood & Tissue Kit (QIAGEN). Exome sequencing libraries of matched tumor/normal tissues were prepared using the SureSelect Human All Exon V.4 platform (Agilent, Santa Clara, California, USA) as previously described.17–19
Exome analyses of matched paired tumor/normal sequencing data for mutations (single nucleotide variants/indels) and copy number variation were performed on QC passed samples via an in-house pipeline as previously detailed.18 Normal samples were subjected to human leukocyte antigen-typing analysis using the PHLAT algorithm, V.1.0 (Regeneron Pharmaceuticals, Tarrytown, New York, USA). RNA sequence data processing and analysis were carried out as described previously.18 20 One responder sample and three non-responder samples failed the sequencing quality check and tumor content assessment.
Neoantigen analysis was carried out based on the detected somatic mutations in the cohort, and was used to identify the specific amino acid coding change. Missense mutations with more than one read per kilobase of transcript, per million mapped reads (RPKM) expression were selected and processed using ANNOVAR V.07.16.1721 and an in-house Perl script to obtain 17-mer amino acid neopeptides. The recommended parameter from the Immune Epitope Database, V.IEDB_MHC-2.17 (www.iedb.org), was then used to assess and select for neopeptides with high-affinity major histocompatibility complex class I-binding neopeptides against patient autologous haplotypes.
Multiplex immunofluorescence (mIF) analysis was conducted on two responding patients using the Tyramide signal amplification system-based kit (Opal 7-Color fIHC Kit, PerkinElmer, Waltham, Massachusetts, USA), and slides were scanned using a multispectral microscope (Vectra 3.0.5, PerkinElmer) as previously described.22 Pretreatment slides from exceptional responders were tested using two panels with six antibodies each in the same slide. Panel 1 consisted of pan-cytokeratin AE1/AE3 (epithelial cell positive; dilution 1:300; Dako, Carpinteria, California, USA), PD-L1 (clone E1L3N; dilution 1:3000; Cell Signaling Technology, Danvers, Massachusetts, USA), PD-1 (clone EPR4877-2; dilution 1:300; Abcam, Cambridge, Massachusetts, USA), CD3 (T-cell lymphocytes; dilution 1:100; Dako), CD8 (cytotoxic T cells; clone C8/144B; dilution 1:20; Thermo Fisher Scientific, Waltham, Massachusetts, USA) and CD68 (macrophages; clone PG-M1; dilution 1:450; Dako). Panel 2 consisted of AE1/AE3 (epithelial cell positive; dilution 1:300; Dako), CD57 (natural killer cells; clone HNK-1; dilution 1:40; BD Biosciences, San Jose, California, USA), granzyme B (cytotoxic lymphocyte marker, clone F1, ready to use; Leica Biosystems, Wetzlar, Germany), CD45RO (memory T cells, clone UCHL1, ready to use; Leica Biosystems), FOXP3 (Treg cells, clone 206D; dilution 1:50; BioLegend, San Diego, California, USA) and CD20 (B-cell lymphocytes; dilution 1:100; Dako). The individual cells (defined by nuclei (4′,6-diamidino-2-phenylindole) staining) identified by the cell segmentation tool were subjected to the phenotyping pattern recognition-learning algorithm tool to characterize co-localization of the various cell populations on the tumor multispectral images. Labeling was as follows: tumor cells expressing PD-L1 (AE1/AE3+PD-L1+); T lymphocytes (CD3; pan T-cell marker including cytotoxic T cells CD3+CD8+, antigen-experienced T cells CD3+PD-1+ and other CD3+ T cells); cytotoxic T cells (CD3+CD8+); antigen-experienced T cells (CD3+PD-1+); TAMs (CD68+) and TAMs expressing PD-L1 (CD68+PD-L1+). Panel 2 labeling was as follows: memory cells (CD45RO; memory/regulatory cells CD45RO+FOXP3+ and other CD45RO+ cells); memory/regulatory cells (CD45RO+FOXP3+); activated natural killer cells (CD57+granzyme B+CD45RO−) and cytotoxic cells (granzyme B+) and B lymphocytes (CD20+). The analysis of each cell population created a comprehensive cell-by-cell identification report expressing the results as number of cells per mm2 from each individual cell phenotyping population, as well as the percentage of TAMs and tumor cells expressing PD-L1, for the statistical analysis.
Statistical analysis
The primary end point was safety. The secondary end points were overall response rate (defined as partial response or complete response based on modified RECIST V.1.1 criteria), disease control rate (DCR; defined as stable disease, partial response or complete response based on modified RECIST V.1.1 criteria), PFS, overall survival (OS) and change in cancer antigen (CA) 19–9. Both the safety and efficacy analyses included only patients who had received at least one dose of study medication (safety analysis set; n=73). Exploratory end points included the evaluation of PB immune subsets. The sample size was 36 patients per arm based on a null hypothesis of a DCR of 8% or lower, and an alternative hypothesis of a DCR of at least 20%, which would provide 80% power to detect the difference at a 0.10 level of significance by a one-sided χ2 test. Continuous futility and toxicity monitoring for each treatment arm were conducted, with enrollment in either arm stopping early if there was > 95% probability that the DCR was below 20%, or there was >90% probability that the toxicity rate was higher than 30%, in that arm.23
Univariable Cox models were fitted to evaluate the association between OS or PFS with baseline markers or their area under the curve over the first 4 weeks (AUCwk4) of therapy. Univariable logistic regression models were used to compare best response or best CA 19–9 change and markers. For AUCwk4, the Spearman’s correlation coefficients were calculated to evaluate the best change in CA 19–9 and the best change in tumor size with markers. No multiple testing adjustment was performed for p values. All p values presented are two-sided and statistical significance is p≤0.05.
Results
Baseline characteristics
A total of 77 patients were enrolled across 12 sites in the USA, with 37 randomized to acalabrutinib and 40 to acalabrutinib combined with pembrolizumab. Four patients did not receive study therapy owing to elevated bilirubin (one patient), consent withdrawal (one patient) and disease progression (two patients). Thus, a total of 73 patients received study therapy (35 monotherapy and 38 combination therapy). The median age was 64 years, with 77% of patients having an ECOG PS of 1% and 23% an ECOG PS of 0 (table 1). The median number of prior systemic lines of therapy was 3 (range 1–6), with 52.1% of patients having had three or more prior lines of therapy. A pancreaticoduodenectomy had been performed in 24.7% of patients. A total of 15 patients crossed over from the monotherapy arm to the combination therapy arm. At the end of the study, no patients remained on study treatment and 84% of patients had died.
Patient characteristics
Safety
The median duration of acalabrutinib treatment was 1.4 months, and the median relative dose intensity for acalabrutinib was 95.9%. The median duration of pembrolizumab treatment was 0.72 months, and the median relative dose intensity for pembrolizumab was 100.0%. Both arms were well tolerated overall, with no dose-limiting toxicities observed in the initial 12-patient safety analysis. The most frequent adverse events (AEs) experienced by ≥25% of patients in the monotherapy arm were abdominal pain, anemia, back pain, decreased appetite, fatigue, headache, nausea and edema peripheral. The most frequent AEs experienced by ≥25% of patients in the combination therapy arm were abdominal pain, decreased appetite, fatigue, anemia, nausea, vomiting, constipation, headache, dyspnea and hyponatremia. Grade 3–4 AEs were reported by 16 patients (45.7%) randomized to the monotherapy arm and 28 patients (73.7%) randomized to the combination therapy arm (table 2). AEs (all grades) related to acalabrutinib occurred in 62.9% of patients receiving the monotherapy, and 31.6% of patients receiving the combination therapy (table 2). Acalabrutinib-related grade 3–4 AEs were observed in 14.3% of patients in the monotherapy arm and 5.3% of those in the combination therapy arm, and grade 3–4 AEs related to acalabrutinib or acalabrutinib+pembrolizumab were observed in 15.8% of patients in the combination arm (table 2). The acalabrutinib-related grade 3–4 AEs in the monotherapy arm were anemia (5.7%; two patients), fatigue, decreased neutrophil count, increased alanine aminotransferase and increased aspartate aminotransferase (2.9%; one patient each). The acalabrutinib-related grade 3–4 AEs in the combination therapy arm were decreased white blood cell count, decreased lymphocyte count, decreased platelet count, lower gastrointestinal hemorrhage and increased alanine aminotransferase (2.6%; one patient each).
Overview of AEs
Thirty (85.7%) patients randomized to the monotherapy arm and 34 (89.5%) patients randomized to the combination therapy arm died. Most patients died owing to disease progression: 21 (60.0%) patients and 30 (78.9%) patients randomized to the monotherapy arm and combination therapy arm, respectively. A total of four (11.4%) patients randomized to the monotherapy arm and one (2.6%) patient randomized to the combination therapy arm experienced a fatal serious AE/grade 5 event. These included disease progression and failure to thrive, disease progression and abnormal hepatic function, pneumonia, respiratory failure (one patient each in the monotherapy arm) and septic shock (one patient in the combination therapy arm). AEs resulting in study medication modification occurred in only two (5.3%) patients in the combination therapy arm and no patients in the monotherapy arm. AEs leading to study drug discontinuation occurred in five (14.3%) patients and seven (18.4%) patients in the monotherapy arm and combination therapy arm, respectively (table 2).
Efficacy analysis
The overall response rate was 0% (95% CI: 0% to 10%) in the monotherapy arm and 7.9% (95% CI: 1.7% to 21.4%) in the combination therapy arm (figure 1A). The DCR was 14.3% (95% CI: 4.8% to 30%) in the monotherapy arm and 21.1% (95% CI: 9.6% to 37.3%) in the combination therapy arm. The median duration of response in the combination therapy arm was 3 months (95% CI: 3.0 to 4.2 months). A reduction in CA 19–9 of >50% was seen in 8.6% of patients in the monotherapy arm and 15.8% of patients in the combination therapy arm. One patient, exceptional responder 1, demonstrated a partial response, with a reduction in extensive peritoneal disease along with a corresponding CA 19–9 reduction. Interestingly, this patient subsequently experienced progressive liver metastases without corresponding peritoneal progression (figure 2A). A second patient, exceptional responder 2, initially treated with monotherapy for 7 months, demonstrated a partial response when crossed over to combination therapy, showing shrinkage of liver metastases and a corresponding CA 19–9 reduction (figure 2B).
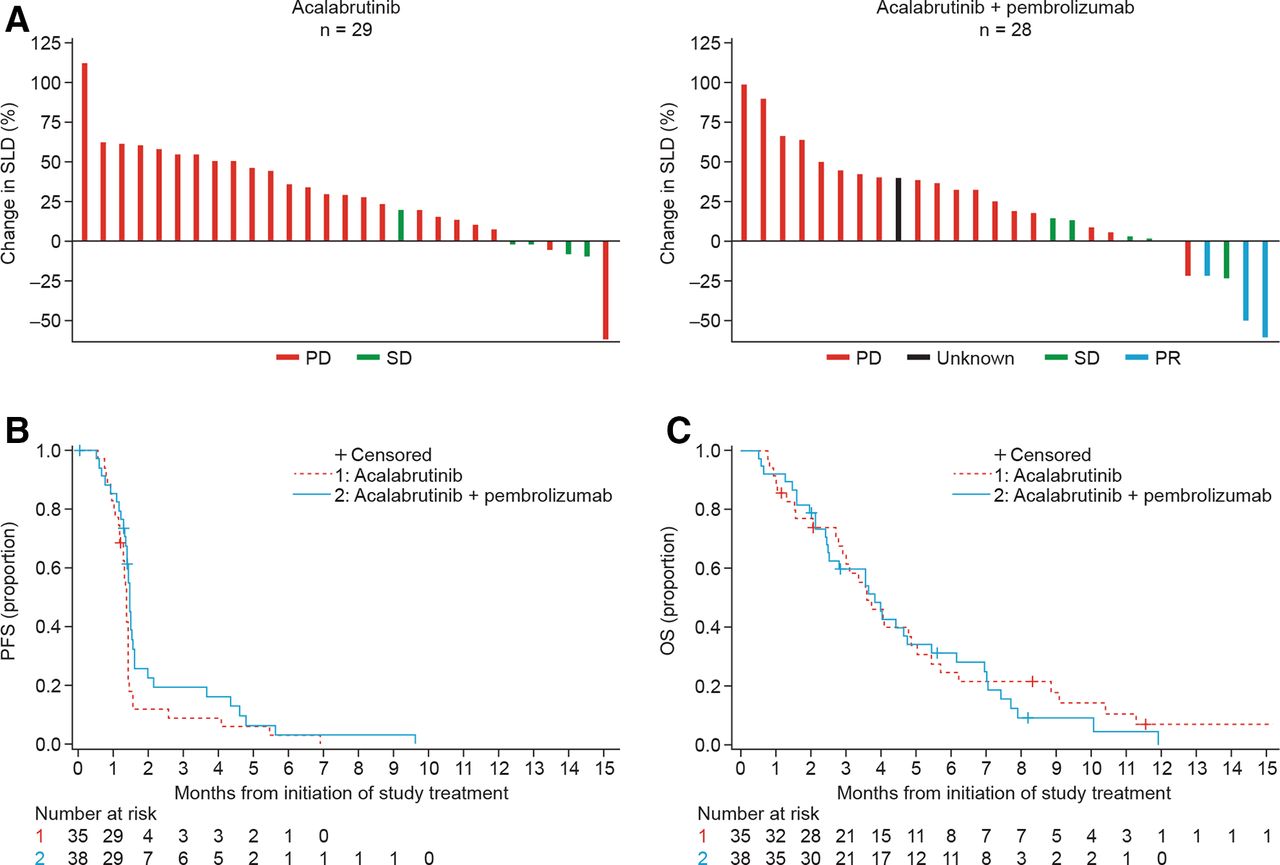
Efficacy outcomes stratified by treatment arm (monotherapy and combination therapy). (A) Best radiographic response according to RECIST V.1.1: data show maximum change from baseline in SLD. (B) Kaplan-Meier plot for PFS based on objective tumor assessment by the investigator per RECIST V.1.1, based on the safety analysis set. (C) Kaplan-Meier plot for OS based on the safety analysis set. OS, overall survival; PD, progressive disease; PFS, progression-free survival; PR, partial response; RECIST V.1.1, Response Evaluation Criteria in Solid Tumors version 1.1; SD, stable disease; SLD, sum of longest diameters.
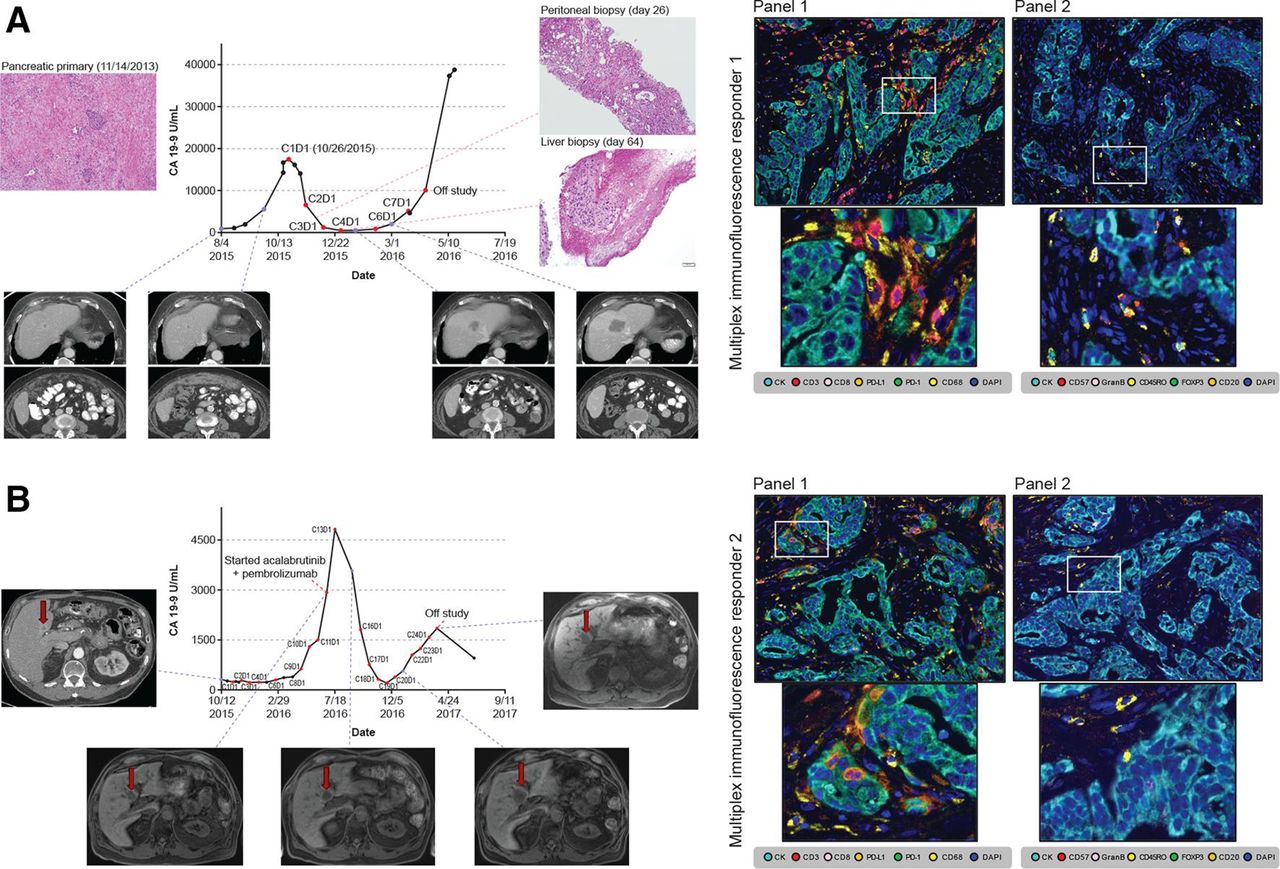
Exceptional responders showing CA 19–9 trend, representative radiographic images, histopathological tissue sampling and pretreatment multiplex immunohistochemistry. (A) Exceptional responder 1. (B) Exceptional responder 2. Baseline mIF images of tumor sections from exceptional responders 1 and 2 analyzed with panel 1 and 2 markers. Upper images: exceptional responder 1 showing increased number of macrophages expressing PD-L1+ and low density of total CD3+ T cells, with details of mIF showing TAMs expressing PD-L1+ (left) and high density of activated natural killer (CD57+granzyme B+CD45RO−) cells (right). Lower images: exceptional responder 2 showing similar findings to responder 1, with details of mIF again showing TAMs expressing PD-L1+ (left) and high density of CD45RO+ memory T cells (right), reflecting the variations in cell phenotypes observed in such cases. Images ×200 with high-power magnification of the positive cells. mIF, multiplex immunofluorescence; PD-L1+, programmed cell death ligand-1 positive; TAM, tumor-associated macrophage.
Median PFS was 1.4 months (95% CI: 1.3 to 1.4 months) and 1.4 months (95% CI: 1.3 to 1.5 months) and median OS was 3.6 months (95% CI: 2.8 to 4.9 months) and 3.8 months (95% CI: 2.5 to 4.8 months) for monotherapy and combination therapy, respectively (figure 1B,C). The median time on study was 3.4 months (range 0.8–23.8 months) for monotherapy and 3.3 months (range 0.5–11.9 months) for combination therapy.
Of the 15 patients who crossed over from the monotherapy arm to the combination therapy arm, the overall response rate and DCR were both 0% (95% CI: 0% to 21.8%). The median time on study was 3.8 months (range 1.5–23.8 months) ().
Flow cytometry analysis and gene expression
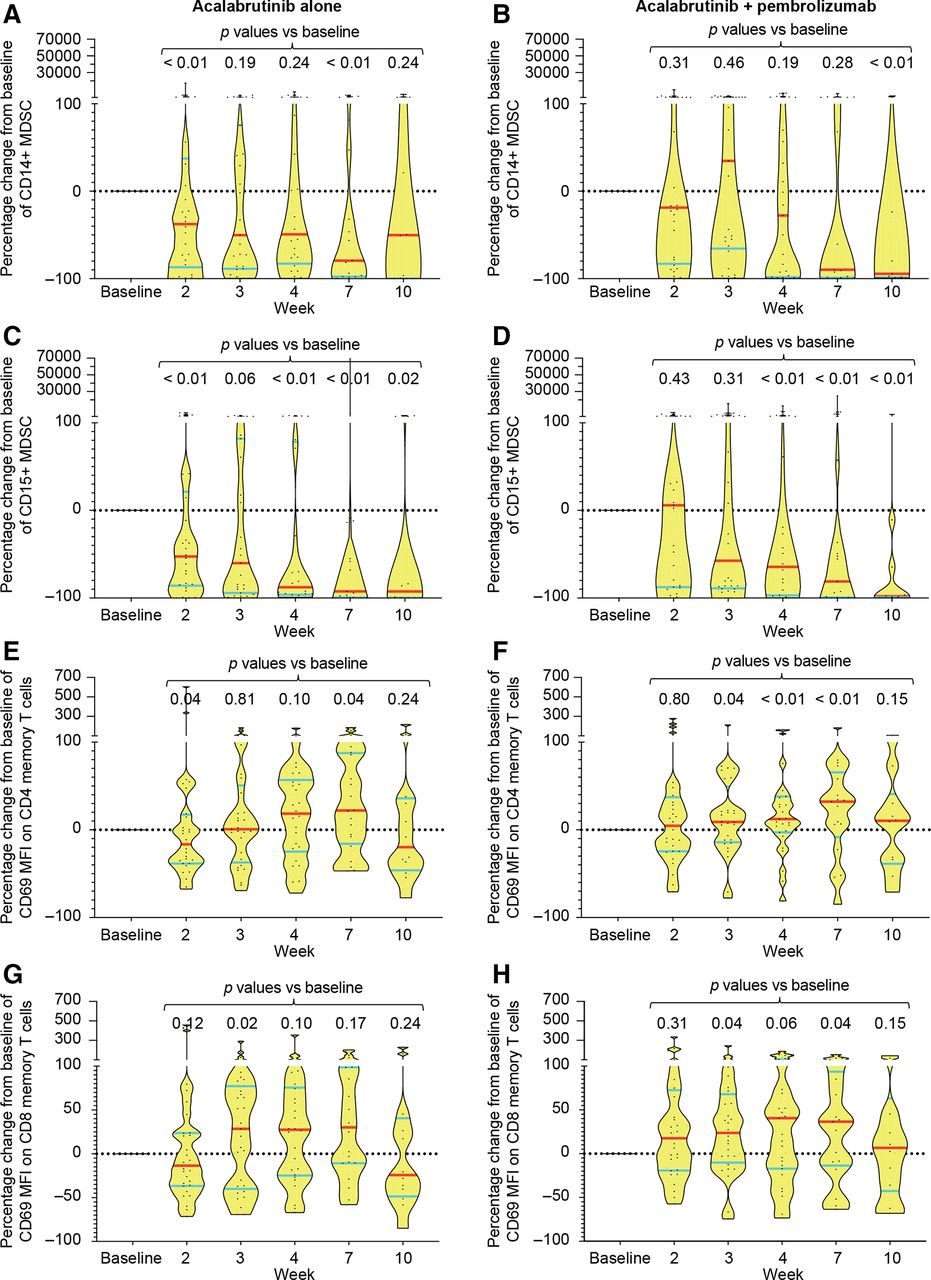
Flow cytometric analysis of PBMC demonstrated consistent and durable reductions in granulocytic (CD15+) but not monocytic (CD14+) MDSCs over time, with median reduction of >50% achieved after 2–3 weeks of therapy (figure 3A–D). These changes were observed in both monotherapy and combination arms, suggesting that it was probably mediated by acalabrutinib. In contrast, evidence of T-cell activation as detected by an increase in MFI of CD69 on both CD4 and CD8 memory (CD45RO+) T cells was observed predominantly in the combination arm, suggesting an effect mediated by pembrolizumab (figure 3E–H). These changes were not associated with any significant changes in the absolute number of PB CD4 or CD8 T-cell subsets or other immune markers (data not shown). Additionally, consistent changes in the activation markers of monocytes including CD40, CD54, CD80, CD86 and HLA-DR were not found in either treatment arm (data not shown).

Changes in immune cell subsets and immune markers in peripheral blood mononuclear cells. Flow cytometry was performed on serial blood samples from both the monotherapy and the combination therapy arms at the indicated time points (baseline=week 1). (A–D) Percentage change in absolute number of monocytic (defined as CD3−CD20−CD56−HLA-DRlo/CD33+/CD11b+/CD14+) (A, B) and granulocytic (defined as CD3−CD20−CD56−HLA-DRlo/CD33+/CD11b+/CD15+) MDSC (C, D) in the PB in each treatment arm is shown for all samples assessed. Data shown as violin plots with median indicated by red horizontal lines and IQRs shown by blue horizontal lines. Each dot in the plot represents a sample. P values were calculated by Mann-Whitney two-tailed U test by comparing each time point with baseline. (E–H) Percentage change in MFI of CD69 on CD4 (E, F) or CD8 (G, H) memory (CD45RO+) T cells is shown as violin plots as above for each treatment arm. MDSC, myeloid-derived suppressor cells; MFI, mean fluorescence intensity; PB, peripheral blood.
Gene expression profiling (GEP) was performed by Illumina HT12v4 whole-transcriptome microarrays on 107 pretreatment and on-treatment PB samples. There were paired pretreatment (week 1) and on-treatment (week 7) samples from 38 patients, and pretreatment-only samples from 31 patients. Comparison of paired week 1 and week 7 samples showed that, on average, the probes most highly downregulated at week 7 were enriched for pan-B cell genes (IGJ, TNFRSF17, IGLL1, FCRL5, CD19, TNFRSF13B, BLK, CD79A and IGLL3), as expected for treatments with a BTK inhibitor. Probes most highly upregulated at week 7 were enriched for genes indicative of interferon signaling: IFIT3 (two probes), IFITM3, IFI44 and IFI44L (data not shown).
Comparing GEP data for responders versus non-responders within the separate treatment groups (ie, within the monotherapy arm or within the combination therapy arm) failed to yield striking differences. However, although of low significance, the effector T-cell checkpoint inhibitor, LAG3, is expressed less by responders than non-responders in the monotherapy arm, and interferon (IFN)-γ is expressed more by responders than non-responders in the combination therapy arm. We also performed Spearman’s correlations between pretreatment PB GEP data and two quantitative measures of response (percentage tumor size reduction by RECIST, and reduction in serum CA 19–9 for CA 19–9-expressing tumors), but failed to observe compelling implication of genes or processes driving responses (data not shown).
The volcano plot of the week 7–pretreatment differences in log2 values comparing data for patients with disease control (responders) versus progressive disease (non-responders) in the monotherapy arm (see online supplementary figure S1a) shows striking differences, even with the significance threshold implied by uncorrected p values. One intriguing finding is high upregulation in responders of BOAT (gene symbol=ATXN1 L), which cooperates with Capicua (CIC, also upregulated in these patients) in cell cycle regulation.24 Similarly, the volcano plot for the combination therapy arm (see online supplementary figure S1b) shows many differences; one of these, with modest fold-change but apparent high significance, is TBX21 (T-bet), a Th1 cell-specific transcription factor that controls the expression of IFN-γ. We also performed Spearman’s correlations between paired differences in PB GEP data and two quantitative measures of response (percentage tumor size reduction by RECIST, and reduction in serum CA 19–9 for CA 19–9-expressing tumors), but failed to observe compelling implication of genes or processes driving responses (data not shown).
Supplemental material
Focused, immune-relevant GEP of pretreatment biopsy samples was performed, using the NanoString nCounter, for the 18 patients whose tumor biopsies yielded satisfactory RNA. A heat map of the ~50% of genes that varied most highly (see online supplementary figure S2a) showed an intriguing dichotomy: one group of nine tumors had high expression of complement genes, most likely from arginase-expressing myeloid cells, while the other group had high expression of fibrotic stromal genes. Treatment arms were distributed equally between these two groups, and there was no obvious correlation to the three patients who were clinical responders. Two patients had marked evidence of T-cell and B-cell infiltration; one of those was not treated, and the other did not respond.
Since all but one of the patients with tumor biopsies (who was not treated) had GEP successfully performed on PB samples, we examined whether the PB GEP data differed between complement-high and stroma-high patients, as defined by their tumor biopsies. A volcano plot of the comparison (see online supplementary figure S2b) suggested that the PB reflects tumor composition; one of the most differentially expressed genes, upregulated in the complement group, is arginase 2.
Transcriptome sequencing was used to estimate gene expression data for several immune cell markers (eg, PDCD1, CD274, CD4, CD28, ITGB2 and ITGAL). The expression data for these immune cell markers in the two responder cases (figure 2A,B) demonstrated low-to-intermediate expression relative to patients with advanced pancreatic cancer sequenced under the Michigan Oncology Sequencing Program.18
Exceptional responder analysis
To better understand the limited number of responding patients, an extensive characterization including multiplex immunohistochemical analysis and DNA and RNA sequencing was conducted for two patients, exceptional responders 1 and 2 (figure 2 and see online supplementary figure S3). Exceptional responder 1 was treated with combination therapy and had a dramatic partial response with near resolution of bulky peritoneal disease, but eventually demonstrated progressive disease in her liver. Exceptional responder 2 was initially treated in the monotherapy arm with stable disease for 7.5 months, and on crossover demonstrated stable disease in response to combination therapy and remained on combination therapy for 8.7 months before progression. mIF analysis performed on pretreatment tissue from both exceptional responders demonstrated low PD-L1 expression on tumor cells, but did show expression on TAMs (figure 2). A BRCA2 variant of unknown significance (3174A>G) had previously been determined from clinical care testing in exceptional responder 1, but neither additional somatic alteration nor loss of heterozygosity was present in this patient’s tumor tissue, suggesting that this was not a pathogenic alteration. No germline alteration was found in exceptional responder 2. In addition, both exceptional responders 1 and 2 were microsatellite stable, and neither patient demonstrated somatic mutations in the homologous DNA repair pathway. In both exceptional responders, tumor mutational load and predicted neoantigen load were lower than those seen in the tested progressing patients. Despite both exceptional responders undergoing early on-treatment biopsies, no tumor was found on either peritoneal biopsy for exceptional responder 1, nor on liver biopsy for exceptional responder 2.
Discussion
The current trial has demonstrated the safety of acalabrutinib as a monotherapy and in combination with pembrolizumab; however, the overall response rate was limited for both regimens, with responses in 0% of patients undergoing monotherapy and 7.9% of those receiving combination therapy. PFS was short in both arms, as was the duration of response in the few responding patients. Extensive characterization of two exceptional responders demonstrated them to be microsatellite stable with low tumor mutation burdens and no defects in the homologous DNA repair pathway. Across all patients, acalabrutinib treatment reduced PB granulocytic MDSCs and the combination treatment induced activation of CD4 and CD8 memory T cells.
Acalabrutinib and pembrolizumab appeared to be relatively well tolerated in this patient population with advanced pancreatic cancer. There did not appear to be significant differences in safety findings when patients were treated with acalabrutinib plus pembrolizumab compared with acalabrutinib alone. No clinically relevant safety findings were observed when acalabrutinib and pembrolizumab were combined.
Whereas inhibition of BTK and PD-1 is associated with improved survival in mouse models of pancreatic cancer, the results of this study did not reflect the preclinical findings.14 25–27 In part, this relates to the great complexity of human pancreatic cancer tumor biology and tumor microenvironment. Analyses of PB demonstrated consistent reductions over time in granulocytic MDSCs, suggesting pharmacodynamic target modulation by acalabrutinib at the PB level. Moreover, the combination therapy was associated with increased expression of CD69 by both CD4 and CD8 memory T cells, suggesting activation of effector memory T cells by pembrolizumab. However, due to a lack of formal on-treatment tumor biopsies, it was not possible to assess changes in MDSCs and T-cell subsets in the tumor microenvironment.
Despite the limited overall efficacy seen within this trial, it is of interest that two patients demonstrated remarkable cancer courses; with one patient having a dramatic reduction in extensive bulky growing peritoneal disease, while the other patient demonstrated prolonged treatment benefit from monotherapy followed by combination therapy and remained on clinical trial for a total of 16.2 months. To better understand these two patients, both multiplex immunohistochemistry, and DNA and RNA sequencing were conducted. Despite both cases having little to no tumorous PD-L1 expression, PD-L1 expression by TAMs was observed, suggesting this cell type as a potential target for PD-1 inhibition. Despite one of these two cases having clinically conducted BRCA2 testing demonstrating a variant of unknown significance, we did not demonstrate an additional somatic BRCA2 mutation or loss of heterozygosity, suggesting this alteration was not playing a role in exceptional responder 1. In addition, neither patient demonstrated germline or somatic alterations in homologous recombination genes. Despite the known correlation between mutation load and immune response, both exceptional responders demonstrated neither a high mutation load nor a defect in mismatch repair. Although these findings do not provide an answer as to why these two patients showed such pronounced anticancer immune responses, they do reinforce the need for improved biological understanding of the pancreatic immune microenvironment and provide hope for future success with immunotherapy-based approaches.
Although the efficacy results of this trial were negative, the randomized design enabled an attempt to delineate the additive or synergistic clinical benefit of the addition of anti-PD-1 therapy to BTK inhibition. While no firm conclusions can be drawn given the limited activity seen over the entire trial, it is notable that only those patients treated with combination therapy demonstrated objective tumor responses to therapy. This trial supports the previously demonstrated lack of efficacy of anti-PD-1 therapy6 and suggests a synergistic benefit of PD-1 blockade combined with an immune stromal targeting agent. Consistent with our results, in a recent phase II pancreatic cancer trial no patients responded to anti-PD-L1 monotherapy and one patient (3.1%) responded to combination therapy with anti-PD-L1 plus anti-CTLA-4.28 Although efficacy with combination therapy was limited, these results do support further mechanistic exploration in preclinical models regarding the pancreatic tumor microenvironment. The limited efficacy of acalabrutinib monotherapy seen here is also consistent with the recently reported negative phase III clinical trial investigating the addition of the BTK inhibitor ibrutinib to gemcitabine and nab-paclitaxel in the first-line treatment of metastatic pancreatic adenocarcinoma (NCT02436668).29 The role of targetable mutations remains to be explored more fully. BRCA1 or BRCA2 mutations are present in about 5% of patients with pancreatic cancer30 31 and are associated with improved response to platinum-based therapy and poly (ADP-ribose) polymerase inhibition.32 33 In our trial, deficiency in homologous repair did not appear to play a role in the observed response.
As the results were negative overall, analyses of subsets and specific patients should be viewed as exploratory in nature. In addition, our analysis of the immune cell subsets was performed in an exploratory fashion, without correction for multiplicity. We were unable to assess intratumoral changes in the two exceptional responders due to a lack of pancreatic tumor tissue in on-treatment biopsies.
Conclusions
In conclusion, acalabrutinib and pembrolizumab were relatively well tolerated in this patient population with advanced pancreatic cancer. Acalabrutinib monotherapy or the combination of acalabrutinib and pembrolizumab did not demonstrate meaningful clinical activity in patients with advanced pancreatic ductal adenocarcinoma. However, the observation of clear anticancer responses in a limited number of patients who had low tumor mutation loads suggests the potential for demonstrating effective immune responses in this aggressive cancer. Continued efforts to understand and target the pancreatic tumor microenvironment are warranted.
Acknowledgments
The authors would like to thank all patients, families and caregivers who participated in the study. The authors would like to thank Arul Chinnaiyan, Xuhong Cao, Fengyun Su and Rui Wang who performed the exceptional responder tumor RNA/DNA analyses. The authors would like to thank Kumudha Balakrishnan, who helped with compiling the flow cytometry data; Jingjing Cao, who performed the staining, acquisition and analysis of flow cytometry of PB mononuclear samples; Zhiqiang Wang, who performed DNA/RNA extraction and generation of GEP data and Man Chun John Man, who analyzed GEP data and performed correlation with clinical outcome.
References
Footnotes
Contributors Study design and conception: MO, AM and MJ. Clinical investigators: MO, NM, AB and CDL. LT: clinical trial statistical analysis. SN designed immune profiling studies and performed data analysis and interpretation of results from flow cytometry and correlation with clinical outcome. MO drafted the initial version of this manuscript. VM interpreted the data, and helped draft and review the manuscript. All authors participated in review and revision of the manuscript. All authors read and approved the final manuscript.
Funding This work was supported by the Department of Defense Grant W81XWH-16-1-0122 and by the National Cancer Institute through Cancer Center Support Grant P30CA16672. This study was supported by Acerta Pharma, a member of the AstraZeneca Group.
Competing interests MO reports research funding from Merck. SN reports fees and research support from Allogene, Celgene, Kite (a Gilead Company), Merck and Unum Therapeutics; research support from Acerta Pharma, Bristol-Myers Squibb, Cellectis, Karus and Poseida and fees from Cell Medica, Incyte, Novartis, Pfizer and Precision Biosciences. NBM receives research funding to institution from Amgen, ARMO Biosciences, BMS, Genentech, Incyte, MedImmune and OncoMed and research funding from the Lustgarten Foundation. LT, VM and PP are employees of Acerta Pharma. VM owns stock in AstraZeneca and Gilead Sciences. MJ, RED, CK-S, PV, CDL, ERP and LX report no relevant conflicts of interest. AM receives royalties from Cosmos Wisdom Biotechnology for a biomarker test related to pancreatic cancer early detection.
Patient consent for publication Not required.
Ethics approval The study was conducted with the approval of appropriate Institutional Review Boards, and all participants provided written informed consent.
Provenance and peer review Not commissioned; externally peer reviewed.
Data availability statement Data are available on reasonable request. Acerta Pharma, a member of the AstraZeneca Group, is committed to data transparency and will consider data sharing requests on a case-by-case basis. Any requests for deidentified patient data can be submitted to Acerta Pharma 3 months postpublication and ending 5 years following article publication with the intent-to-achieve aims of the original proposal. In addition, Acerta Pharma will provide the study protocol, statistical analysis plan and informed consent form, as well as post results on clinicaltrials.gov, as required.