Article Text

Abstract
Background PD1/PDL1-directed therapies have been unsuccessful for multiple myeloma (MM), an incurable cancer of plasma cells in the bone marrow (BM). Therefore, other immune checkpoints such as extracellular adenosine and its immunosuppressive receptor should be considered. CD39 and CD73 convert extracellular ATP to adenosine, which inhibits T-cell effector functions via the adenosine receptor A2A (A2AR). We set out to investigate whether blocking the adenosine pathway could be a therapy for MM.
Methods Expression of CD39 and CD73 on BM cells from patients and T-cell proliferation were determined by flow cytometry and adenosine production by Liquid chromatograpy-mass spectrometry (HPCL/MS). ENTPD1 (CD39) mRNA expression was determined on myeloma cells from patients enrolled in the publicly available CoMMpass study. Transplantable 5T33MM myeloma cells were used to determine the effect of inhibiting CD39, CD73 and A2AR in mice in vivo.
Results Elevated level of adenosine was found in BM plasma of MM patients. Myeloma cells from patients expressed CD39, and high gene expression indicated reduced survival. CD73 was found on leukocytes and stromal cells in the BM. A CD39 inhibitor, POM-1, and an anti-CD73 antibody inhibited adenosine production and reduced T-cell suppression in vitro in coculture of myeloma and stromal cells. Blocking the adenosine pathway in vivo with a combination of Sodium polyoxotungstate (POM-1), anti-CD73, and the A2AR antagonist AZD4635 activated immune cells, increased interferon gamma production, and reduced the tumor load in a murine model of MM.
Conclusions Our data suggest that the adenosine pathway can be successfully targeted in MM and blocking this pathway could be an alternative to PD1/PDL1 inhibition for MM and other hematological cancers. Inhibitors of the adenosine pathway are available. Some are in clinical trials and they could thus reach MM patients fairly rapidly.
- adenosine
- hematologic neoplasms
- immunotherapy
- tumor microenvironment
This is an open access article distributed in accordance with the Creative Commons Attribution Non Commercial (CC BY-NC 4.0) license, which permits others to distribute, remix, adapt, build upon this work non-commercially, and license their derivative works on different terms, provided the original work is properly cited, appropriate credit is given, any changes made indicated, and the use is non-commercial. See http://creativecommons.org/licenses/by-nc/4.0/.
Statistics from Altmetric.com
Introduction
Novel targets for immunotherapy are needed for many cancers that fail to respond to anti-PD1/PDL1 checkpoint therapy. PD1/PDL1 therapy has given little benefit for patients suffering from multiple myeloma (MM), a cancer characterized by neoplastic proliferation of plasma cells (PC) in the bone marrow (BM)1 and associated with profound immune dysfunction.2 Adenosine and adenosine-generating enzymes are implicated in immunosuppression in different cancers3 and are attractive but unexplored new therapeutic targets for MM,4 particularly as we and others5 have found that the BM in MM patients has elevated level of adenosine.
Adenosine activates immunoregulatory responses through specific receptors, which protect tissues from damage caused by excessive inflammation.6–8 Extracellular adenosine level is kept low under physiological conditions, but it increases during inflammation and cell death.9 In T cells, the high-affinity adenosine receptor A2A (A2AR) is activated by adenosine to increase cytoplasmic cyclic AMP level. This suppresses T-cell functions such as proliferation and cytokine secretion.10 Adenosine is produced from extracellular ATP by the sequential activity of two extracellular enzymes, CD39 and CD73.11 CD39 (ectonucleoside triphosphate diphosphohydrolase-1 (ENTPD1)) converts ATP and ADP to AMP, and CD73 (ecto-5′-nucleotidase (NT5E)) converts AMP to adenosine.12 13 CD73 is expressed on various stromal cells in the BM such as mesenchymal stem cells, fibroblasts and endothelial cells, and on some hematopoietic cells including Tregs.14 CD39 is expressed by regulatory B and T cells (Bregs and Tregs), which contributes to the regulation of immune responses.15 16 An alternative pathway for generating adenosine uses ectoenzymes CD38 and CD203a.17 CD38 is highly expressed on myeloma cells, and this enzyme converts extracellular nicotinamide adenine dinucleotide (NAD)+ to ADP-ribose, which can be further converted to AMP by CD203a.18 CD203a can also convert ATP directly to AMP and thus bypass CD39.
Clinical trials with drugs against adenosine-generating enzymes (NCT02503774) or adenosine receptor (NCT02740985, NCT03454451) have been initiated in advanced solid tumors. Preliminary results from NCT03454451 indicated clinical benefit of the A2AR antagonist CPI-444.19 CD73 expression was associated with poor survival in several cancers, including triple-negative breast cancer, non-small cell lung cancer, and renal cell carcinoma.3 Indeed, immunotherapy with combinations of anti-CD73 and anti-PD1 reduced tumor load in a mouse model of colon cancer.20 Moreover, mice deficient in both CD73 and A2AR were highly resistant to several different tumors.21 Blockade of CD39 reduces adenosine production and immune suppression.22 It was recently published that combinations of antibodies against CD39 and CD73 reduced the growth of different mouse tumors.23 CD39 is found in cancers such as chronic lymphocytic leukemia24 and subgroups of gastric cancers,25 which makes these cancers targets for anti-CD39 antibodies and inhibitors. Although CD39 is not expressed by healthy PC,26 we found that a large proportion of MM patients expressed CD39 on their myeloma cells. This suggests that MM patients could benefit from anti-CD39/CD73 therapy. We therefore determined whether inhibition of CD39 and CD73 could reduce immunosuppressive adenosine production of BM cells from MM patients and reduce immune suppression and tumor load in a mouse model of MM.
Methods
Antibodies and chemicals
Antihuman CD39-BV421, CD73-APC, CD3-BV421, CD56-FITC, CD29-AF700, CD90-PECy5, CD105-PE, and CD31-APC/Cy7 were purchased from BioLegend (San Diego, USA). Anti-CD45-V500, CD19-APC/Cy7, and CD56-FITC Ab were purchased from BD BioSciences (San Jose, USA). Isotype control antibodies as well as human Fc Receptor-binding inhibitor (eBioscience, San Diego, USA) were used in all experiments. Antihuman (clone 2C5-TM) and anti-mouse CD73 mAb (clone 2C5) and their isotype controls (clone R347 IgG1-TM for human experiments and NIP228 IgG1 for mouse experiments) were kind gifts from MedImmune (Gaithersburg, USA). Anti-mouse mAbs were from BioLegend: anti-CD45-Percp, anti-CD39-Alexa-Flour-647, anti-CD138-PE,anti-CD3-APC, anti-CD4-FITC, anti-CD8-BV510, anti-CD138-BV421, anti-NK1.1-APC/Cy7 (with Rat IgG2b,κ isotype Ctrl antibody), anti-CD62L-PECy7, anti-FASL-PE, anti-CD11b-FITC, anti-Ly6C-PerCp, anti-Ly6G-APC, anti-MHCII-Pacific blue, anti-F480-PE, anti-Granzyme B-Pacific blue (with mouse IgG1,κ isotype Ctrl antibody), anti-CD8-PE, anti-interferon gamma (IFN-γ)-PECy7 (with Rat IgG2a,κ isotype Ctrl antibody), anti-TNF-α-BV421 (with Rat IgG1,κ isotype Ctrl antibody), and anti-IL2-BV510 (with Rat IgG2b,κ isotype Ctrl antibody). Red blood cell (RBC) lysing buffer (eBioscience) and mouse Fc block (BioLegend) were also used in mouse experiment. Cell stimulation cocktail (Lot 1973566) and protein transport inhibitor (Lot 1991195) were from Invitrogen. Fixation/permeabilization solution kit was bought from BD Biosciences. 2-Chloroadenosine (CADO-A2AR agonist) was obtained from Sigma-Aldrich (St Louis, USA). ZM241385 (A2AR antagonist), AMP and ATP were obtained from Sigma-Aldrich. AZD4635 (A2AR antagonist) was a kind gift from AstraZeneca. POM-1 (CD39 inhibitor) was from Santa Cruz (CAS 12141-67-2). Cell tracker carboxyfluorescein N-succinimidyl ester (CFSE) kit was from Invitrogen. Adenosine stop solution were from Sigma-Aldrich and it contains: dipyridamole, Erythro-9-(2-hydroxy-3-nonyl) adenine,(EHNA) hydrochloride, α,β-methylene adenosine-5′-diphosphate, and Ethylenediaminetetraacetic acid (EDTA). Vital dye (LIVE/DEAD Fixable Dead Cell Stain Kits) was from Invitrogen (Carlsbad, USA).
Patient samples
BM cells from the iliac crest from healthy controls and MM patients were collected in sodium heparin (Wockhardt, Wrexham, UK). The donors were classified as healthy, monoclonal gammopathy of undetermined significance (MGUS), or MM according to the International Myeloma Working Group criteria.27 BM PC percentage was determined in May Grünwald–Giemsa-stained smears. BM aspirates for Flow cytometry (FACS) analysis and adenosine measurement from healthy donors (mean age 56, 5 women, 3 men) were collected the same way as from patients (mean age 65, 10 women, 15 men) and MGUS (mean age 55, 1 woman, 1 man).
Gene expression analysis (CoMMpass)
RNA sequencing data, sequencing-based Fluorescence In Situ Hybridization (FISH (Seq-FISH)) data, and clinical data were downloaded from the Multiple Myeloma Research Foundation CoMMpass IA10 release (https://research.themmrf.org). RNA sequencing data were available for 736 diagnostic samples, and survival data were available for 685 of the patients. Seq-FISH data were available for 572 of the diagnostic patient samples. Differentially expressed genes between patient groups were examined using GeneSpring GX software (Agilent), and the resulting ranked list was analyzed using Gene Set Enrichment Analysis (GSEA, V.2.2.1; Broad Institute).
Flow cytometry
Crude BM cells were stained with a cocktail of antibodies for 30 min on ice after 20 min pre-incubation with human Fc Receptor-binding inhibitor. RBCs were lysed and the cells were fixed after staining. Human Myeloma Cell Lines (HMCLs) were stained with anti-CD39, anti-CD73, or isotype controls for 30 min on ice. Flow cytometry was performed using LSR II (BD Biosciences) with FACS Diva software (BD Biosciences). Samples were analyzed with FlowJo V.10.4 (TreeStar, Ashland, Oregon, USA). Gates were set on live cells with forward and side scatter and doublets gated out. Proliferation of CFSE-labeled T cells was measured by flow cytometry as previously described.28 All CFSE data were analyzed using FlowJo V.7.6.4 software.
Animal experiments
C57BL/KalwRij mice (Envigo Laboratories, Horst, Holland) were housed and treated according to the procedures approved by the Ethical Committee for Animal Experiments of the Vrije Universiteit Brussel. Female mice were injected intravenously on day 0 with 2×10⁵ 5T33 MM cells and treated intraperitoneally with 10 mg/kg monoclonal anti-CD73 antibody on days 2, 4, 8, 11, 15, and 18. Of note, 5 mg/kg of POM-1 was injected intraperitoneally once per day from 0 to day 4, day 7–11, and day 14–18. AZD4635 nanosuspension formulation (Aptuit, Verona) was reconstituted in sterile water and mice were gavaged once per day at 25 mg/kg starting from day 11 until culling on day 21 in the first experiment. In the other experiments, AZD4635 was gavaged once per day from day 0 and the mice were culled on day 15. Number of tumor cells in the spleen was determined using FACS analysis. Percentage of PC in the BM was determined on May Grunwald–Giemsa-stained BM smears from one femur. M spike was measured as described.29 Mouse spleens were mashed through a 40 µm cell strainer. BM was flushed from tibia and femur. RBCs were lysed with 0.16 M ammonium chloride/0.017 M Tris-HCl pH 7.65 for 3 min at room temperature. Of note, 106 mouse spleens cells and BM cells were blocked with anti-Fc block for 10 min prior to surface staining with a cocktail of antibodies for 30 min on ice. During intracellular staining, Granzyme B cells were fixed with 2% Paraformaldehyde (PFA), permeabilized with perm buffer, and stained following the manufacturer’s recommendation. Cytokines were detected after stimulation with cell stimulation cocktail for 4 hours. Protein transport inhibitor was added 2 hours before surface staining, followed by intracellular staining. 106 cells were stained with different cocktails: (anti-CD138, CD45), (anti-CD3, CD4, CD8) and (anti-CD3, CD4, CD8, CD138, NK1.1), CD62L, FASL), (anti-CD11b, Ly6C, Ly6G, MHCII, F480), (anti-CD3, CD8, NK1.1, Granzyme B), (CD3, CD4, CD8, NK1.1, IFN-γ, TNF-α, interleukin (IL)-2, and appropriate isotype controls). Cells were analyzed on LSRII Flow Cytometer as described in the Methods section. Mouse IFN-γ was measured by mouse IFN-γ ELISA Kit (R&D, Minnesota, USA; cat#DY485-05).
Mass spectrometry
Detection of adenosine in BM plasma: 500 µL BM aspirate was mixed immediately with 500 µL stop solution (20 µM dipyridamole; 120-µM erythro-9-(2-hydroxyl-3-nonyl) adenine hydrochloride, 60 µM α,β-methylene adenosine-5′-diphosphate, 5 mmol/L sodium Ethylenediaminetetraacetic acid (EDTA).30 After centrifugation (2300 g, 2 min at 4°C), supernatants were frozen at −80°C. Detection of AMP and adenosine in cell culture: supernatants were boiled for 2 min to stabilize adenosine, centrifuged (2300 g, 2 min at 4°C), and kept at −80°C. All sample dilutions were made with water prior to sample processing. 13C5-labeled adenosine internal standard was added to samples and standards. Samples were precipitated with three volume equivalents of ice-cold acetonitrile, and the supernatants were freeze-dried and dissolved in water for analysis. Separation was performed with a LC-20AD HPLC system (Shimadzu) and an Ascentis Express C18 2.7 µm 150×2.1 mm i.d. column protected with an Ascentis Express Cartridge Guard Column (Supelco Analytical) with an Exp Titanium Hybrid Ferrule (Optimize Technologies Inc.) at 35°C. The mobile phase solutions consisted of (A) water and 0.1% formic acid and (B) methanol and 0.1% formic acid. Elution was with 0.16 mL/min flow, starting at 5% B for 0.5 min, ramping to 90% B over 5.5 min and re-equilibrating with 5% B for 5.5 min. Mass spectrometry was performed using an API 5000 triple quadrupole (ABSciex) operating in positive electrospray ionization mode. The following mass transitions were monitored with the multiple reaction monitoring: 268.1/136.1 (adenosine); 348.1/136.1 (AMP); 269.1/137.1 (inosine); and 273.1/136.1 (13C5-adenosine) (online supplementary figure S2D).
Supplemental material
Results
Elevated levels of adenosine and CD39 in BM indicate an active adenosine pathway in the myeloma tumor microenvironment
In order to investigate the role of adenosine signaling in MM, we measured adenosine level in BM plasma from healthy controls and MM patients. Patients had higher level than the controls (figure 1A), indicating that there was an adenosine-enriched environment in the BM of patients with MM. MGUS is a benign condition with a monoclonal immunoglobulin component (M component) in serum, but normal numbers of MM cells in the BM. Although MGUS causes no symptoms, it always precedes MM and 1%–2% of individuals with MGUS get converted to MM per year.31 MGUS patients, as previously reported,5 had significantly lower adenosine level in the BM than MM patients (figure 1A). To investigate what led to the elevated adenosine content, we measured the expression of CD39 on HMCLs and MM cells from patients. Enriched CD138+ MM cells were stained with antibodies against CD38, CD19, CD56, and CD39. CD39 expression was found on gated CD19−CD56+CD138+CD38high MM cells (figure 1B, online supplementary figure S1A). There was considerable variation in the expression of CD39 between the patients (median 71.5 %, coefficient of variation 46.1), as some expressed CD39 on almost 100% of their MM cells while others had 20%–30% CD39+ MM cells. Similar to published data, CD39 was not detected on PCs from healthy controls (online supplementary figure S1B).26 Most HMCLs expressed CD39, although to a varying degree. While almost all of the IH-1 and JJN-3 cells expressed CD39, very few or none of the ANBL-6, RPMI-8226, and U266 cells were CD39+ (figure 1C). None of the HMCLs expressed functional CD73 (data not shown). Cell surface CD73 was not detected on MM cells from patients (data not shown), but CD73+ cells were found in BM samples of both patients and healthy controls (figure 1D,E). Only a few of the BM cells, around 1%–3% of the total cell number, expressed CD73. The expression level of CD73 was also similar between patients and controls (data not shown). Nevertheless, CD73 was found on a variety of cell types: T cells, B cells, and CD45− stromal cells such as fibroblasts, endothelial cells, and mesenchymal stem cells (figure 1E). HS-5, a human mesenchymal stromal/stem cell (MSC) line, expressed high level of CD73, but it was CD39− (figure 1F). These results indicate that the BM microenvironment of MM is characterized by elevated adenosine pathway activity, possibly mediated by increased expression of CD39 on malignant PC.

Adenosine and CD39 levels were elevated in the BM microenvironment of myeloma. (A) Adenosine level (mean±SD) in BM plasma from healthy controls (n=4) or from individuals with MM (n=5) or MGUS (n=2). Adenosine concentration was measured by HPLC-MS as described in the Methods section. (B–E) Expression of CD39 and CD73 on patient MM cells and HMCLs, and cell populations in BM as determined by FACS analysis. (B) Percentage of CD39+ MM cells from patients (n=20). Enriched CD138+ MM cells were stained with anti-CD39, anti-CD19, anti-CD38, and anti-CD56. CD39 expression was determined on CD138+, CD19−, CD38 high, CD56+ MM cells (gating shown in Figure S1B). Percentage of CD39+ cells was determined using CD39− FMO controls. (C) CD39 expression, percentage positive (I), and histogram of CD39 expression (II) on eight different HMCLs (dashed line is isotype control). Gates were set on isotype controls. The figure shows one representative of three independent experiments performed. Results show the mean (±SD). (D) Percentage of CD73+ cells in BM cells from MM patients (n=7) and healthy controls (n=7). Crude BM was stained with a cocktail of anti-CD73, anti-CD3, anti-CD19, anti-CD45, anti-CD31, anti-CD90, anti-CD29, and anti-CD105. CD73− FMO controls were used to set the gates for CD73 expression. (E) CD73-expressing cell populations in BM. Plots show cell populations within the CD73+ gate from a representative sample. (F) Expression of CD39 and CD73 on HS-5 cells (solid lines). Gates were set on isotype controls (dashed lines). BM, bone marrow; FMO, fluorescence minus one; HMCL, myeloma cell lines; MGUS, monoclonal gammopathy of undetermined significance; MM, multiple myeloma.
CD39 on myeloma cell lines and PC from patients converts ATP to AMP, and CD73 on BM mononuclear cells (BMMC) from myeloma patients converts AMP to adenosine.
To show that CD39 was functional, MM cells and HMCLs were cultured in the presence or absence of synthetic, exogenous extracellular ATP (eATP) for various time periods before measuring AMP concentration in culture supernatants by quantitative mass spectrometry. MM cells from patients converted ATP to AMP (figure 2A). CD39+ IH-1, INA-6, and JJN-3 HMCLs produced AMP, while CD39− ANBL-6 cells failed to do so (figure 2B). Generation of AMP by patient MM cells (figure 2C) and JJN-3 cells (figure 2D) was significantly inhibited by POM-1, a small-molecule inhibitor of CD39.32 33 POM-1 did not induce death or reduce intracellular ATP level of JJN-3 cells (figure 2E).

Production and inhibition of AMP and adenosine by cells from MM patients and HMCLs using anti-CD73 and POM-1. CD138+ MM cells enriched from BM aspirate from three patients (>95% purity); MM (1–3) (A) and 4 HMCLs (B) were incubated with 100 µM ATP for indicated time periods before collection of supernatants for measurement of AMP by HPLC-MS. Figure shows mean±SD. (C) POM-1 (100 µM) inhibited AMP generation by primary MM (4–6) cells and (D) by JJN-3. Cells were incubated with or without 100 µM POM-1 for 3 hours and cultured with 100 µM ATP for 1 hour. (E) POM-1 did not reduce intracellular ATP level, an indirect measurement of cell death, in JJN-3 cells. Cell viability was measured by CTG cell viability assay. Human BM stromal/stem cell line (HS-5) (F) and BMMC from 3 MM patients (H) were incubated with 100 µM AMP for various time periods before collection of supernatants for HPLC-MS. (G) 150 µg/mL anti-CD73 or isotype controls were used to inhibit adenosine generation by HS-5 cell line and by BMMC from 3 MM patients (I). B, D, E, F, and G show one representative out of three independent experiments. BM, bone marrow; BMMC, BMmononuclear cells; CTG, CellTiter-Glo luminescent; HMCL, myeloma cell lines; MM, multiple myeloma.
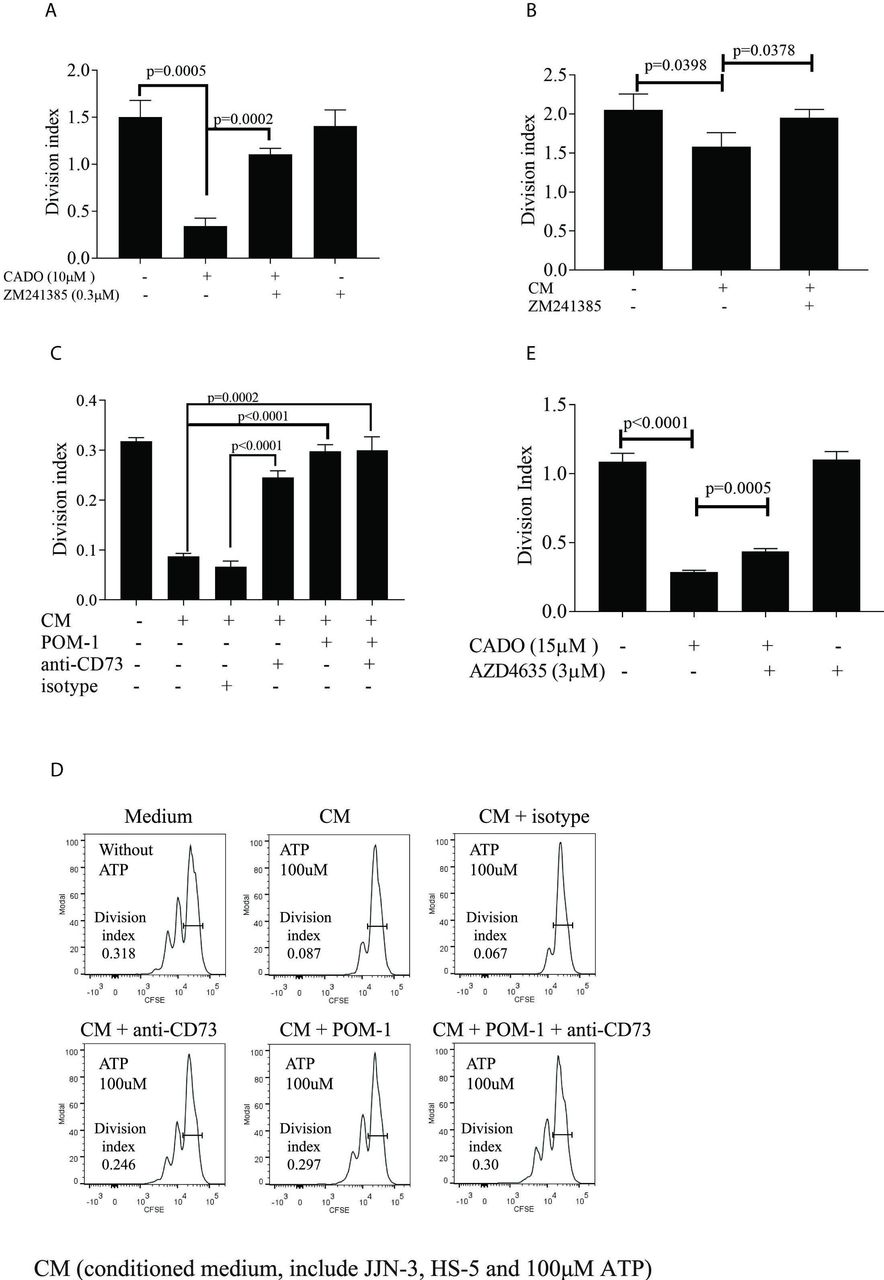
T-cell proliferation in the presence and absence of CADO, ZM241385, AZD4635, POM-1, anti-CD73, and supernatants from cell culture. MM patients’ T cells were isolated from BMMC (A) or from peripheral blood mononuclear cells (PBMC) (B–E), labeled with CFSE, and cultured in the presence of IL-2 and anti-CD3/CD28 as described in online supplementary materials and methods. Division index was determined on day 5 of culture. (A) A2AR antagonist ZM241385 restored T-cell proliferation abolished by CADO. (CFSE histogram is shown in online supplementary figure S3A). T cells were cultured as described with and without 10 µM CADO and 0.3 µM ZM2413850 for 5 days. (B) A2AR antagonist ZM241385 restored T-cell proliferation inhibited by adenosine from cocultures of JJN3 and HS-5. (A representative CFSE histogram is shown in online supplementary figure S3B.) Cells were cultured as described, in the presence or absence of 0.3 µM ZM241385. (C) POM-1 and anti-CD73 restored T-cell proliferation inhibited by adenosine from cocultures. JJN-3 cells were pretreated with or without 100 µM POM-1 and cultured for 1 hour in the presence of 100 µM ATP. T cells were cultured together with HS-5 in the presence of 150 µg/mL anti-CD73 or isotype controls as described before. Supernatants containing AMP from JJN-3 cells (CM) were added to the culture. (D) CFSE histogram of T cells from a representative T-cell culture from (C). (E) AZD4635 restored proliferation in T cells inhibited by CADO. T cells were cultured as described in the presence of 15 µM CADO and 3 µM AZD4635. Division index was determined on day 5 of culture. Data were means with SD. Statistical differences were calculated with Student’s t-test. Three independent experiments were performed. A2AR, adenosine receptor A2A; BMMC, BMmononuclear cells; CFSE, carboxyfluoresceinN-succinimidyl ester.
MSCs are one of the CD73+ cell types in the BM (figure 1E). The mesenchymal stromal cell line HS-5 expressed high level of functional CD73 (figure 1F), as it converted AMP to adenosine (figure 2F). The adenosine level in the supernatant peaked after 30 min and then declined gradually, presumably due to the low stability of adenosine.34 Production of adenosine was inhibited by an antibody to CD73 (figure 2G). CD73 was active in the tumor microenvironment (TME) of patients since BMMC incubated with extracellular AMP converted AMP to adenosine (figure 2H), which could be inhibited by anti-CD73 (figure 2I). Thus, our data demonstrate that CD39 and CD73 expressed in the BM of MM patients were enzymatically active and converted ATP to AMP, and AMP to adenosine.
Coculture of CD73+ HS-5 stromal cells and CD39+ myeloma cells converts eATP to adenosine
To simulate the generation of adenosine in the BM, CD39+ JJN-3 and CD73+ HS-5 stromal cells were cocultured in the presence of eATP for 1 hour. ATP was converted to adenosine when both HMCLs and stromal cells were present, but not when the cell lines were cultured separately (figure 3A). Adenosine was also generated when another CD39+ HMCL, IH-1, was cocultured with MSC in the presence of eATP (online supplementary figure S2B). HMCLs or MM cells cultured alone with ATP produced high level of AMP (online supplementary figure S2A), but no significant adenosine (figure 3A, online supplementary figure S2C). HS-5 stromal cells could not convert ATP to AMP (online supplementary figure S2A), or to adenosine (figure 3A), but was able to convert AMP to adenosine (figure 2F). The CD39 inhibitor POM-1 reduced the adenosine generation from ATP in coculture of JJN3 and HS-5 cells by about 10-fold. Anti-CD73 antibody did the same, although less efficiently (about threefold reduction). Minimal level of adenosine was measured when both POM-1 and anti-CD73 were added (figure 3B). These experiments show that CD39+ HMCLs and CD73+ MSC, both present in the BM of MM patients, could convert ATP to adenosine. It was also evident from the experiments that these ectoenzymes could be inhibited functionally in vitro.

Production of adenosine during coculture of CD39+ JJN-3 HMCL and CD73+ HS-5. (A) JJN-3 and HS-5 cells, cultured separately or together, were incubated as described in online supplementary methods with 100 µM ATP for indicated time periods. Adenosine concentration in supernatants was measured by HPLC-MS. Medium (CM) from JJN-3 and HS-5 cells cultured in the absence of ATP was used as control. (B) POM-1 and anti-CD73 inhibited adenosine generated by JJN-3 and HS-5. HS-5 cells were incubated with 100 µM ATP, JJN-3, or POM-1-pretreated JJN-3, 150 µg/mL anti-CD73, or isotype for 1 hour. Then the supernatants were collected and adenosine concentration was measured by HPLC-MS. Data were means±SD. Statistical differences were calculated using Student’s t-test. Three independent experiments were performed.
Adenosine generated from coculture of myeloma and stromal cells suppressed T-cell responses in vitro
To test whether adenosine generated from ATP could suppress T-cell responses, T cells from the BM of MM patients were stimulated with anti-CD3/CD28 beads and cultured in the presence of an adenosine analog, CADO (figure 4A, online supplementary figure S3A), which is more stable than adenosine. Similar to adenosine, CADO can suppress T-cell responses via A2AR.16 CADO inhibited T-cell proliferation, which was alleviated in the presence of the A2AR inhibitor ZM241385 (figure 4A). CADO did not induce death of T cells (online supplementary figure S3D) and the T cells proliferated in response to CD3/CD28 when both CADO and ZM241385 were present (figure 4A).

The effect of inhibiting CD39, CD73, and A2AR in vivo in the 5T33MM model. (A) Schematic picture for the experiment (mpk=mg/kg). (B) FACS analysis of CD39 expression on CD138+ 5T33 MM cells. (C–G) C57Bl6KalwRij mice were treated with either a CD39 inhibitor (POM-1), CD73 antibody, and/or an A2AR inhibitor as described in the Methods section. Spleens were weighed (C) and cells from five of the mice were further analyzed for CD138+ MM cells by FACS analysis, CD138+ cells/spleen were calculated (n=5) (D). BM was collected for analysis of BM plasmacytosis on cytosmears (E) and serum was collected for M-protein analysis by protein electrophoresis (F). Analysis of spleen cells by FACS as described shows the ratio of CD3+ cells per number of CD138+ tumor cells in the spleen (n=5) (G). Results are expressed as mean and SD. Statistical differences were calculated using one-way Analysis of variance (ANOVA). A2AR, adenosinereceptor A2A; BM, bone marrow; MM, multiple myeloma.
We next investigated whether adenosine generated from ATP during coculture of CD39+ JJN-3 HMCL and CD73+ HS-5 stromal cells could suppress T-cell proliferation. Supernatants containing adenosine after coculture were added once per day to the T cells (figure 4B, online supplementary figure S3B). The adenosine-containing culture supernatants resulted in a suppression of T-cell proliferation. While CADO is stable in culture, adenosine degrades rapidly. We could therefore not expect similar levels of inhibition as in figure 4A. When the A2AR inhibitor ZM241385 was added together with the culture supernatant, no suppression was observed, suggesting that the suppression was mediated through the A2AR (figure 4B).
We then tested if POM-1 and anti-CD73 could restore the T-cell response from the suppression caused by adenosine. To this end (figure 4C,D), JJN-3 was pretreated with POM-1 before ATP was added as described in the Methods section. Supernatants from these POM-1-pretreated cells were then added to cocultures of HS-5 and T cells (together with either anti-CD73 or isotype controls). This two-step method of generating adenosine retained high levels of adenosine and T cells at a density necessary for optimal growth. As can be seen in figure 4C,D, the inhibition of T-cell proliferation was abolished or reduced when POM-1, anti-CD73, or both were added. These experiments show that adenosine generated from eATP by HMCLs and stromal cells could inhibit T-cell proliferation.
AZD4635 is an oral antagonist of the high-affinity A2A receptor, which reversed T-cell suppression ex vivo when incubated with the adenosine analog 5′-N-ethylcarboxamidoadenosine.35 This inhibitor is presently undergoing Phase I clinical trials in patients with various solid tumors (NCT02503774). Similar to ZM241385, AZD4635 partially restored CADO-mediated inhibition of T-cell proliferation (figure 4E, online supplementary figure S3C).
High expression of CD39 gene is associated with poor prognosis of MM patients
As MM cells from patients express CD39, a trait potentially contributing to immunosuppression, we determined whether gene expression of ENTPD1 (CD39) in MM cells correlated with disease outcome. To this end, we used the publicly available CoMMpass database (CoMMpass IA10 release; https://research.themmrf.org). Here, ENTPD1 gene expression (RNAseq), as well as survival data for 685 of the patients, was available for 736 patients at the time of diagnosis (figure 5A). Of note, 43% (n=320) of patients expressed the ENTPD1 gene (cut-off set to more than two transcripts per million (TPM)). The patients who expressed ENTPD1 had significantly worse progression-free survival (PFS) (HR 1.27; 95 % CI 1.03 to 1.56; p=0.0223) and overall survival (OS) (HR 1.75; 95 % CI 1.29 to 2.37; p=0.0003) than the patients with no expression (TPM <2) (figure 5B,C). In multivariate Cox regression, ENTPD1 expression remained a statistically significant predictor of shorter OS (HR 1.54; 95 % CI 1.08 to 2.2; p=0.02), but not PFS (HR 1.21; 95 % CI 0.96 to 1.53; p=0.111) after adjustment for International Staging System (ISS) stage, induction therapy, hyperdiploidy, and chromosome 14 translocations. We further defined 10% (n=76) of the patients to express high level of ENTPD1 (TPM >10). We observed more (ISS) III patients in the group expressing high level of ENTPD1 than those with low (2–10 TPM) and no expression (online supplementary figure S4A). We observed an enrichment of t(11;14), involving the oncogene CCND1, in tumors expressing ENTPD1, and at the same time a reduction of HRD (hyperdipoid) samples. This was particularly evident in the patients expressing high level of the gene (>10 TPM) (online supplementary figure S4C) and could potentially contribute to the proliferative ability of the tumor. We performed GSEA analysis on all ENTPD1 expressers (>2 TPM) and on patients who expressed high level of ENTPD1 (>10 TPM). In both instances, the two top gene lists were E2F targets and G2M checkpoint, which contained genes related to cell proliferation (online supplementary figure S4C). This observation may suggest that the CD39 expression was induced by or during the proliferation process itself, or as consequence of changes in the environment generated by the increased tumor load.

Expression of CD39 mRNA level and correlation with disease progression of MM patients. Data from the CoMMpass database IA10 release. (A) Expression of ENTPD1 (TPM, log2) in 736 diagnostic MM patient samples. (B) PFS and (C) OS curves generated from the CoMMpass data by comparing the ENTPD1 expressers (TPM >2; n=320) with the low expressers (TPM <2; n=416). MM, multiple myeloma; OS, overall survival; PFS, progression-free survival; TPM, transcript per million.

Impact of inhibiting CD39, CD73, and A2AR in vivo on immune cells. C57BlKalwRij myeloma-bearing mice (n=11) were treated with POM-1, CD73 antibody, and A2AR inhibitor as described in figure 6 and in the Methods section, or saline as control (n=11). Mice were killed on day 15 after tumor injection. Cells from spleen and BM were collected for FACS analysis. Graphs show (A) the percentage of IFN-γ expressing cells in spleen; (B) the percentage of CD4+ T cells from spleen expressing IFN-γ; (C) the percentage of activated CD4+ T cells (CD62LlowCD4+) in spleen; (D) the percentage of FasL+ cells of CD8+ T subsets in spleen; (E) the percentage of FasL+ cells of total NK (CD3−NK1.1+) cells in spleen; (F) the percentage of monocytes (CD11b+Ly6G−Ly6C+) in spleen; (G) the percentage of IFN-γ expressing cells from BM; (H) the MFI of IFN-γ in BM; and (I) the percentage of monocytes (CD11b+Ly6G−Ly6C+) in BM. Results are expressed as mean and SD. Statistical differences were calculated using Mann–Whitney U test. A2AR,adenosine receptor A2A; BM, bone marrow; MFI, median fluorescence intensity.
Reduced tumor load in mice treated with inhibitors of the adenosine pathway
C57BL/KaLwRij mice develop MM within 3 weeks of injection of 5T33MM cells.36 We treated mice with inhibitors of the adenosine pathway, POM-1, anti-CD73, and AZD4635, as shown in figure 6A. We used the A2AR antagonist AZD4635 rather than ZM241385 as AZD4635 is in clinical trials. The 5T33MM tumor expressed CD39 (figure 6B). In this model, tumor cells secrete M component, reside in the BM, and migrate to hematopoietic organs such as the spleen. The migration to the spleen causes up to a 20-fold increase in spleen weight, and it is, in addition to M component, used as an indicator of tumor load in the model.36 Administering AZD4635 alone had no effect on any parameter analyzed. However, mice treated with the CD39 inhibitor POM-1 in combination with anti-CD73 antibody and AZD4635 had significantly lower spleen weights (figure 6C), fewer tumor cells in the spleen (figure 6D) as well as significantly lower M component level in circulation (10.6 g/L vs 19.4) than untreated control mice (figure 6F), which suggests that the treatment reduced tumor load. Although not found to be significant, a similar trend was found in the BM where the POM-1/anti-CD73/AZD4635 combination resulted in a 32% tumor reduction (22% PC vs 33% in control) (figure 6E). Three out of five mice had more CD3+ cells per tumor cell suggesting that the treatment may have influenced immune cells (figure 6G). In an attempt to reduce the number of drugs used, we performed an experiment treating mice with POM-1 and AZD4635 without anti-CD73. We found that the combination of POM-1 and AZD4635 was sufficient to reduce M component significantly (online supplementary figure S5A). To investigate the mechanism behind the tumor reduction, we stained spleen and BM cells from controls and mice treated for 15 days with all three inhibitors. Changes in the immune cells are easier to detect at day 15 than at day 22 when the tumor exerts extensive immune suppression. Significantly reduced numbers of CD138+ MM cells were found in the spleen of treated mice on day 15 with a trend of lower percentage of PC in the BM and less M component (data not shown). There was more immune activation in the spleens of the treated mice with higher proportion of IFN-γ+ splenocytes (figure 7A, online supplementary figure S5B). Eighty percent of the CD8+ T cells in the spleens of both treated and untreated mice were CD62Llow and around 30% produced IFN-γ (data not shown). However, more IFN-γ-producing CD4+ T cells (figure 7B) and CD4+CD62Llow (figure 7C, online supplementary figure S5C) cells in the treated mice than in untreated mice suggested that the treatment had an effect on CD4+ T cells. Splenic CD8+ T cells and NK cells were also affected by the treatment as they expressed significantly higher level of FASL (figure 7D,E, online supplementary figure S5D), but not Granzyme B (data not shown), suggesting that FASL/FAS killing could also reduce the tumor load. IFN-γ induces myelopoiesis37 and activation of monocytes/macrophages. We found more CD11b+Ly6G−Ly6C+ monocytes in the spleens of treated mice (figure 7F, online supplementary figure S5E). The proportion of MHCII-high monocytes was elevated in the treated mice (online supplementary figure S5F), suggesting that there were not only more monocytes, but also more activated monocytes in the spleen after treatment.
Importantly, there was also a much larger proportion of IFN-γ+ cells as well as higher IFN-γ MFI on the BM cells in the treated mice compared with controls (figure 7G,H, online supplementary figure S5G). Indeed, this was mirrored by elevated level of serum IFN-γ (online supplementary table S1). Similar to the spleen, higher proportions of monocytes were detected in the BM of the treated mice compared with controls (figure 7I, online supplementary figure S5H). Taken together, treatment with POM-1, anti-CD73, and AZD4635 led to increased activation of T cells in the spleen as well as higher levels of IFN-γ and monocytes in both the spleen and BM.
Discussion
Interfering with the adenosine pathway is under investigation as an immunotherapeutic approach for many cancers. Checkpoint therapies with anti-PD1 or anti-PDL1 have given disappointing results in MM. When anti-PD(L)1 therapy was used in combination with the standard immunomodulatory drugs, lenalidomide or pomalidomide, severe side effects and/or lack of significant benefit were observed. It is therefore important to explore immunotherapies for MM outside of the PD-1 axis.
Confirming previous findings in MM BM,5 we detected high level of adenosine in the BM of myeloma patients. The presence of enzymatically active CD39 on myeloma cells and enzymatically active CD73 on other BM cells indicates that these enzymes are involved in generating adenosine. Interfering with the adenosine pathway reinvigorated human T cells suppressed by adenosine in vitro and reduced myeloma cell growth in vivo in mice. Thus, targeting the adenosine pathway could be a potential immunotherapy in MM. Significantly lower OS in patients expressing CD39 on their MM cells at diagnosis further supports the notion that the presence of CD39 on the tumor cells could be important for generation of immunosuppressive adenosine. However, adenosine-mediated immune suppression could still take place in the BM of patients not expressing CD39 on their PC, since other CD39+ cells may also contribute to adenosine production. Indeed, we detected CD39 on CD4+ and CD8+ T cells in some of the patients (data not shown). Interestingly, these CD39+CD8+ T cells also expressed PD1 similar to the CD8+TILs associated with antigen-specific exhaustion in colon and lung cancer.38 39 In the BM, we also detected CD39+CD4+ T cells (data not shown), which were possibly Tregs.15 We do not know how CD39 expression is regulated on myeloma cells. CD39 expression can be transcriptionally induced and upregulated on endothelial cells under hypoxic condition. The BM in myeloma patients is hypoxic,40 which could influence the expression level of CD39 and the adenosine production. In addition, CD73 expression is upregulated by hypoxia.41 Thus, the patients who do not express CD39 on their myeloma cells at diagnosis could still develop an adenosine-rich TME throughout the course of the disease.
Although the alternative pathway can generate adenosine from ATP via CD38 and CD203a, very little or reduced AMP was detected in cultures of HMCLs and MM cells after inhibition by the CD39 inhibitor POM-1 (figure 2), therefore this played a minor, if any, role in our in vitro experiments. Also, CD203a was not expressed on CD138+ myeloma cells from myeloma patients in the CoMMpass data bank (IA10 CoMMpass data). However, since CD203a can be upregulated on immune cells by inflammatory cytokines and adenosine can be generated from NAD+,42 we cannot rule out the contribution of the alternative pathway in vivo. Therefore, it might be important to block CD73 and A2AR in addition to CD39.
Although CD73 was expressed on a low number of BM cells, enzymatic activity was detected in BMMC. CD73 is a Glycophosphatidylinositol (GPI)-linked molecule that can be shed and has been detected in circulation. However, we found only high level of soluble CD73 in blood plasma in 1 of 25 patients tested (data not shown). Enzymatically active CD73 and CD39 found on micro-vesicles from BM of MM patients could also possibly contribute to adenosine generation.17
Treatment with either the A2AR antagonist AZD4635 or anti-CD73 alone did not reduce tumor load. There is a strong synergy between A2AR inhibitors and CD73.21 A2AR inhibitors are competitive inhibitors and their activity will diminish in high adenosine concentrations.
In addition, it is possible that adenosine could signal through another adenosine receptor. Thus, reducing adenosine level with anti-CD73 would make the inhibitors more efficient. Presence of CD73 in soluble form and in exosomes would hamper the effectiveness of anti-CD73. Mice treated with all three inhibitors had lower tumor load than controls. High level of IFN-γ produced both in spleen and BM cells suggested that the reduced tumor load was due to the effect on the immune cells. Alongside the elevated IFN-γ level, monocyte numbers in spleen and BM were higher, indicating that the monocytes could be involved in restricting tumor load.43 However, it is likely that several different mechanisms and cell types were involved in the tumor reduction since FASL was also found to be upregulated on T and NK cells. It is tempting to speculate that more efficient CD4 activation and IFN-γ production in the mice would increase killing and phagocytosis of the tumor. High concentration of ATP could also be the ensuing result of adenosine pathway blockade. This would be inflammatory and it stimulates T cells by acting as an adjuvant to DCs. Whether this is the case in vivo in our experiments remains to be investigated.
Although POM-1 at high doses can be toxic to cells in vitro,33 we do not think POM-1 killed myeloma cells directly in vivo as there was no evidence of toxicity in the mice or any significant reduction in the number of myeloma cells or CD3+ cells in the spleens of mice that received POM-1 alone (figure 6D). It must be considered, however, that POM-1 can inhibit other phosphatases. This could influence the response in the BM microenvironment. Thus, due to its toxicity and off-target effects, POM-1 should not be used in humans. There are now CD39 antibodies that block enzymatic activity available23, these are ideal for further experiments and possible clinical trials.
In conclusion, our data show that interfering with the adenosine pathway in MM inhibits adenosine production, invigorates T cells in vitro, and reduces tumor load in vivo, suggesting that inhibiting this pathway could be an alternative therapy for MM.
Acknowledgments
We thank Lill Anny Grøseth and Biobank1. for collecting samples.
References
Footnotes
Twitter @EHRustad, @zaccoop
Contributors Conceptualization: RY, MB, AMS; Methodology: RY, EM, KM, AK, GS, CH, RW, AB, ZC, AS; Investigation: RY, SE, EM, SHM, KM, ER, AK, PA; Formal analysis: RY, AMS, KM, ER, EM; Writing original draft: AMS, RY, MB; Writing–editing: GS, TSS, TBR, AS, AW, TS, EM, AB, ZC, RW, ENV, ER, SE; Resources: TSS, AW, ENV; Project administration: RY, AMS, MB; Supervision: MB, AMS; Funding acquisition: MB, RY, TBR.
Funding The work was supported by The Liaison Committee for education, research, and innovation in Central Norway (Samarbeidsorganet) (Grant No. 223255/F50 and 90369600) and RY was funded by the Chinese Sponsorship Council (CSC). The HPLC-MS/MS analyses were performed at the Proteomics and Modomics Experimental Core Facility (PROMEC), Norwegian University of Science and Technology (NTNU). PROMEC is funded by the Faculty of Medicine and Health Sciences at NTNU and the Central Norway Regional Health Authorities.
Competing interests None declared.
Patient consent for publication Not required.
Ethics approval The study including human bone marrow and blood was approved by the Regional Committee for Medical Research Ethics—Mid Norway (REK 2016-81, REK 2018-467) and all subjects signed informed consents. All animal experiments were performed in accordance with the Ethical Committee for Animal Experiments of the Vrije Universiteit Brussel (license No. LA1230281, CEP 17-281-9 and 18-281-7).
Provenance and peer review Not commissioned; externally peer reviewed.
Data availability statement Data are available upon reasonable request. All data relevant to the study are included in the article or uploaded as supplementary information. All data is available upon request to corresponding author.