Article Text

Abstract
Background Prostate cancer (PCa) has a profoundly immunosuppressive microenvironment and is commonly immune excluded with few infiltrative lymphocytes and low levels of immune activation. High-dose radiation has been demonstrated to stimulate the immune system in various human solid tumors. We hypothesized that localized radiation therapy, in the form of high dose-rate brachytherapy (HDRBT), would overcome immune suppression in PCa.
Methods To investigate whether HDRBT altered prostate immune context, we analyzed preradiation versus postradiation human tissue from a cohort of 24 patients with localized PCa that received HDRBT as primary treatment (RadBank cohort). We performed Nanostring immune gene expression profiling, digital spatial profiling, and high-throughput immune cell multiplex immunohistochemistry analysis. We also resolved tumor and nontumor zones in spatial and bioinformatic analyses to explore the immunological response.
Results Nanostring immune profiling revealed numerous immune checkpoint molecules (eg, B7-H3, CTLA4, PDL1, and PDL2) and TGFβ levels were increased in response to HDRBT. We used a published 16-gene tumor inflammation signature (TIS) to divide tumors into distinct immune activation states (high:hot, intermediate and low:cold) and showed that most localized PCa are cold tumors pre-HDRBT. Crucially, HDRBT converted 80% of these ‘cold’-phenotype tumors into an ‘intermediate’ or ‘hot’ class. We used digital spatial profiling to show these HDRBT-induced changes in prostate TIS scores were derived from the nontumor regions. Furthermore, these changes in TIS were also associated with pervasive changes in immune cell density and spatial relationships—in particular, between T cell subsets and antigen presenting cells. We identified an increased density of CD4+ FOXP3+ T cells, CD68+ macrophages and CD68+ CD11c+ dendritic cells in response to HDRBT. The only subset change specific to tumor zones was PDL1- macrophages. While these immune responses were heterogeneous, HDRBT induced significant changes in immune cell associations, including a gained T cell and HMWCK+ PDL1+ interaction in tumor zones.
Conclusion In conclusion, we showed HDRBT converted “cold” prostate tumors into more immunologically activated “hot” tissues, with accompanying spatially organized immune infiltrates and signaling changes. Understanding and potentially harnessing these changes will have widespread implications for the future treatment of localized PCa, including rational use of combination radio-immunotherapy.
- prostatic neoplasms
- radiotherapy
- gene expression profiling
- computational biology
This is an open access article distributed in accordance with the Creative Commons Attribution Non Commercial (CC BY-NC 4.0) license, which permits others to distribute, remix, adapt, build upon this work non-commercially, and license their derivative works on different terms, provided the original work is properly cited, appropriate credit is given, any changes made indicated, and the use is non-commercial. See http://creativecommons.org/licenses/by-nc/4.0/.
Statistics from Altmetric.com
Introduction
Standard curative-intent treatment options for localized prostate cancer (PCa) include radical prostatectomy or radiotherapy.1 Radiation therapy is delivered using external beam radiotherapy (EBRT) or via radioactive sources implanted within the prostate (brachytherapy). High dose-rate brachytherapy (HDRBT) is a common form of brachytherapy which uses a temporary needle implant to deliver high doses of radiation over a very short time (~10–15 min). Alternatively, low dose-rate brachytherapy (LDRBT) use permanent seed implants to deliver the radiation over a longer period of time (weeks to months). HDRBT has traditionally been used to deliver high fractional doses of radiation (upwards of 10 Gy per fraction usually) to exploit the known resistance of PCa to small doses per fraction,2 attributed to an enhanced ability of PCa to repair sublethal DNA damage.3 Conventional EBRT has most often utilized doses of approximately 2 Gy per fraction necessitating large total doses (>70 Gy) to be effective, while LDRBT is delivered by the permanent implantation of a radioactive source which delivers very high total radiation doses (>140 Gy is prescribed with an 125I source). HDRBT can also minimize radiation exposure to nearby normal tissue, but is often combined with a short course of boost EBRT to treat the surrounding tissues. These factors result in excellent responses for the majority of patients; however, at least a third of men will ultimately relapse4 and progress to advanced and incurable disease.
Normal prostate has an immune infiltrate characterized by intraepithelial lymphocytes in the prostate glands, and low numbers of lymphocytes and macrophages distributed throughout the interstitial tissue.5 Localized PCa has an immunosuppressed phenotype, where tumor-associated lymphocytes are present at the tumor margin, with only sparse numbers within the tumor.6 This suggests that an antitumor immune response exists in these patients, but is held in check by the immunosuppressed prostate tumor.
In addition to direct effects on tumor cells and supporting stromal cells, radiotherapy can provoke immunological effects.7 Clinical evidence of this can be found in case studies where distant untreated metastases undergo apparent spontaneous regression postradiotherapy of an index lesion; an abscopal effect.8 This is thought to be mediated via a systemic immune response triggered by the initial RT. The mechanisms implicated include immunogenic tumor cell death, antigen cross-presentation and T cell priming to tumor-derived antigens.9 However, there is preclinical evidence that hypofractionated and hyperfractionated RT have different immunological effects on tumor tissue. Specifically, high dose-rate hypofractionated radiation, which includes HDRBT, can break immunosuppressive tumor microenvironments, promote immune cell infiltration, and induce anti-tumor responses.10 However, establishing these differences in clinical samples has been difficult due to heterogeneity in dose regimens and RT delivery methods.
Presently, it is also unclear whether the clinical response seen with HDRBT results from direct action toward PCa cells, cancer associated fibroblasts, the immune system or any combinations of these. For this reason, we have specifically explored these three potential response mechanisms to HDRBT in a cohort of patients with localized PCa. We previously revealed PCa stromal cell gene expression and proteomic responses to HDRBT as well as dosimetric features.11–13 In this current study, we used the same patient cohort to evaluate localized PCa immune response to HDRBT. To do this, we assessed a cohort of 24 paired pre-HDRBT and post-HDRBT PCa samples for changes in tumor inflammation gene signatures and multiplex immunohistochemistry (IHC). Contrasting this information with alterations in immune cell densities, cell associations and spatial relationships revealed the capacity for HDRBT to fundamentally alter the tumor immune microenvironment.
Materials and methods
Complete methods and materials, including supporting quality control information, are provided in online supplementary information.
Supplemental material
Patient cohort and sample collection
Table 1 shows the clinical characteristics of 24 patients with localized PCa analyzed in this study. Patients had two HDRBT treatments performed 14 days apart with a 10 Gy fraction prescribed to the target volume (whole prostate) on each occasion. Full details of radiation therapy delivery, including sample processing, histopathological assessment, and ethics approval are provided in online supplementary information.
Clinical characteristics of cohort
Multiplex IHC
Three-micrometer formalin-fixed paraffin-embedded (FFPE) tissue sections from each biopsy were mounted on an adhesive slide, deparaffinized, and rehydrated by serial passage through changes of xylene and graded ethanol for multiplex IHC staining with the T cell Panel and Pan Immune Panel as described previously.14 Full details for imaging, cell segmentation, data processing, and quality control are provided in online supplementary information. An example of the experimental pipeline is shown in online supplementary figure S1 and quality control data are shown in online supplementary figures S2–S4. Further information is provided in the online supplementary material.
Nanostring and 3’ RNAseq immune gene expression profiling
RNA was isolated and purified from 10 µm tissue sections using the RNeasy FFPE kit (Qiagen) according to the manufacturer’s instructions. Full details for nCounter PanCancer Immune Profiling Panel and 3’ RNAseq analyses are provided in the online supplementary information.
Digital spatial profiling
Three-micrometer serial sections of post-HDRBT biopsies from patients RB019 and RB023 were processed by Nanostring Technologies using the ImmunoOncology (IO) RNA and protein panels and analyzed using a GeoMx. Sections were stained prior to ROI selection (12 ROIs per section) with CD3, CD68, Pan-Cytokeratin (PanCK) and DAPI to enable rational selection of regions. Raw data were normalized to both External RNA Control Consortium spike-in and signal-to-noise control. These normalized data were used for generation of TIS signature (mean of all normalized values in TIS signature).
Data analysis, bioinformatics, and statistical considerations
Full details for data analyses as well as statistical tests and power calculations are provided in the online supplementary information.
Results
Clinical and histopathological features of the 24 patients who underwent HDRBT for localized PCa are summarized in table 1. The patients in this cohort were representative in terms of age (65.6±6.2 years), diagnostic serum prostate-specific antigen (PSA) levels (15.1±20.7 ng/mL), tumor stages (T1c-T3b), Gleason grade group, and neoadjuvant androgen deprivation therapy use. None of the patients exhibited clinical signs of lymph node (N0) or distant metastasis (M0) at time of treatment. Under the Gleason grade group scoring system, which reflects pathological features as well as disease risk, the cohort consisted of 33% intermediate favorable risk (GG2), 46% intermediate unfavorable (GG3), and 21% high-risk (GG4 and GG5) patients. Six patients were undergoing neoadjuvant androgen deprivation therapy (Gosrelin) during the period of HDRBT treatment. Three patients (RB006; GG3, RB031; GG3, and RB040; GG5) have presented with PSA relapse subsequent to treatment at 20, 16, and 15 months, respectively. Forty eight tissue samples were obtained from these patients and analyzed as depicted in figure 1A. H&E sections from these paired biopsies were viewed by an experienced uropathologist to mark the location of tumor-bearing tissue within the core (figure 1B). Immune gene expression changes in response to radiation were evaluated using the Nanostring PanCancer Immune Profiling panel, digital spatial profiling (DSP), and the TIS gene signature. Serial sections were used as input for multiplex IHC (mIHC) on two different multiplex panels (pan-immune or T cell-specific) to enumerate 12 distinct cell subsets (refer to table 2 for cell phenotypes). Using the multiplex IHC data, we derived immune subset density (cells per mm2) and spatial characteristics (median cell-to-cell distance) and correlated this with immune gene expression data, immune network signaling, and the Nanostring tumor inflammation score.

Overview of experimental plan. (A) Twenty-four patients with localized prostate adenocarcinoma were treated with a single 10 Gy dose of HDRBT with image-guided biopsies taken immediately prior to and 2 weeks post-HDRBT. Following formalin fixation and sectioning, samples were processed for (i) histopathological examination and tumor zone categorization, (ii) Nanostring nCounter Pan-cancer immune gene panel RNA profiling, (iii) digital spatial profiling, (iv) multiplex IHC, and (v) computation spatial analysis. (B) Schematic showing tissue zones categorized by histopathology and incorporated into subsequent immune density analyses. DC, dendritic cells; HMWCK, high molecular weight cytokeratin; HDRBT, high dose-rate brachytherapy; mIHC, multiplex immunohistochemistry; Mφ, macrophage; NT, nontumor; T, tumor; Treg, regulatory T cells.
Immune subsets assessed by multiplex IHC
Profiling the transcriptional activation response of PCa to HDRBT
We hypothesized that HDRBT alters the local immune signaling network of PCa, and that this would be evident in changes in immune activation and signaling at the transcriptional level. We therefore used an established immune profiling gene expression platform and robust signature of clinically relevant immune activation to broadly assess how immune-related genes and regulatory pathways were perturbed by radiation.
The tumor inflammation signature (TIS) depicts heterogeneity in prostate cancer response to HDRBT
To gain a better understanding of the functional state of the immune system in the biopsies, we first employed a modified investigational 18-gene expression profile (GEP) known as the TIS.15 This signature identifies the presence of an inflamed immune infiltrate in tissues associated with activation of the IFNγ pathway, antigen presentation and T cell activation—and classifies tissues into three broad categories: high, intermediate, or low.16 The TIS is also associated with an inflamed but immunosuppressed phenotype in many different cancer types that is also correlated with good responses to checkpoint blockade.16 We used a modified TIS signature containing 16 of the 18 genes available from the full signature, as two of the genes (NKG7 and HLA-DRB1) are not present on the Nanostring PanCancer Immune Profiling Panel. We used hierarchical k-means clustering of the z-score-normalized expression data of the 16 genes in 46 biopsy samples to delineate categories based on the TIS genes. The results of this analysis, shown in figure 2A, revealed a smooth distribution of the 46 pre-HDRBT samples over the three clustered categories (19 low, 14 intermediate, and 13 high). These three immune GEP categories were driven by discrete clusters of genes as indicated by the dotted boxes in figure 2A. These gene clusters included increased expression of IFN-γ response genes (eg, CXCL9, PDL1, STAT1, and PSMB10 bottom box), as well as CD8+ T cell infiltration, costimulation and chronic activation genes (CD8A, TIGIT, Lag3, CD27, CCL5, CXCR6 upper box). The TIS-high category samples had increased expression of IFN-γ response and chronic T cell activation genes; in contrast, the TIS-intermediate samples had increased expression of the IFN-γ response genes only. The TIS-low samples had no evidence of an IFN-γ response or T cell activation (figure 2A). Importantly, this heatmap depicts the pre-HDRBT samples and their change in TIS category post-HDRBT, shown as white circles (low TIS), orange circles (intermediate TIS), and red circles (high TIS) (figure 2A). A more extensively annotated heatmap, including clinical characteristics, is also provided in online supplementary figure S5. Prior to HDRBT, only 34.8% of the tissues were classified as either high or intermediate TIS—with 65.2% (15/23) of the biopsies being classified as low TIS. Following HDRBT, we observed a statistically significant (χ² test; p=0.008) increase in the proportion of tissues harboring a high or intermediate class TIS signature (82.6%; 19/23 tissues) (figure 2C). Following radiation, the overall mean TIS expression significantly increased post-HDRBT, with only 4/23 (17.4%) patients exhibiting a low TIS score after HDRBT (figure 2D). TGFβ (in the form of its mRNA transcript TGFB1) is also strongly and significantly upregulated following radiation (figure 2E).
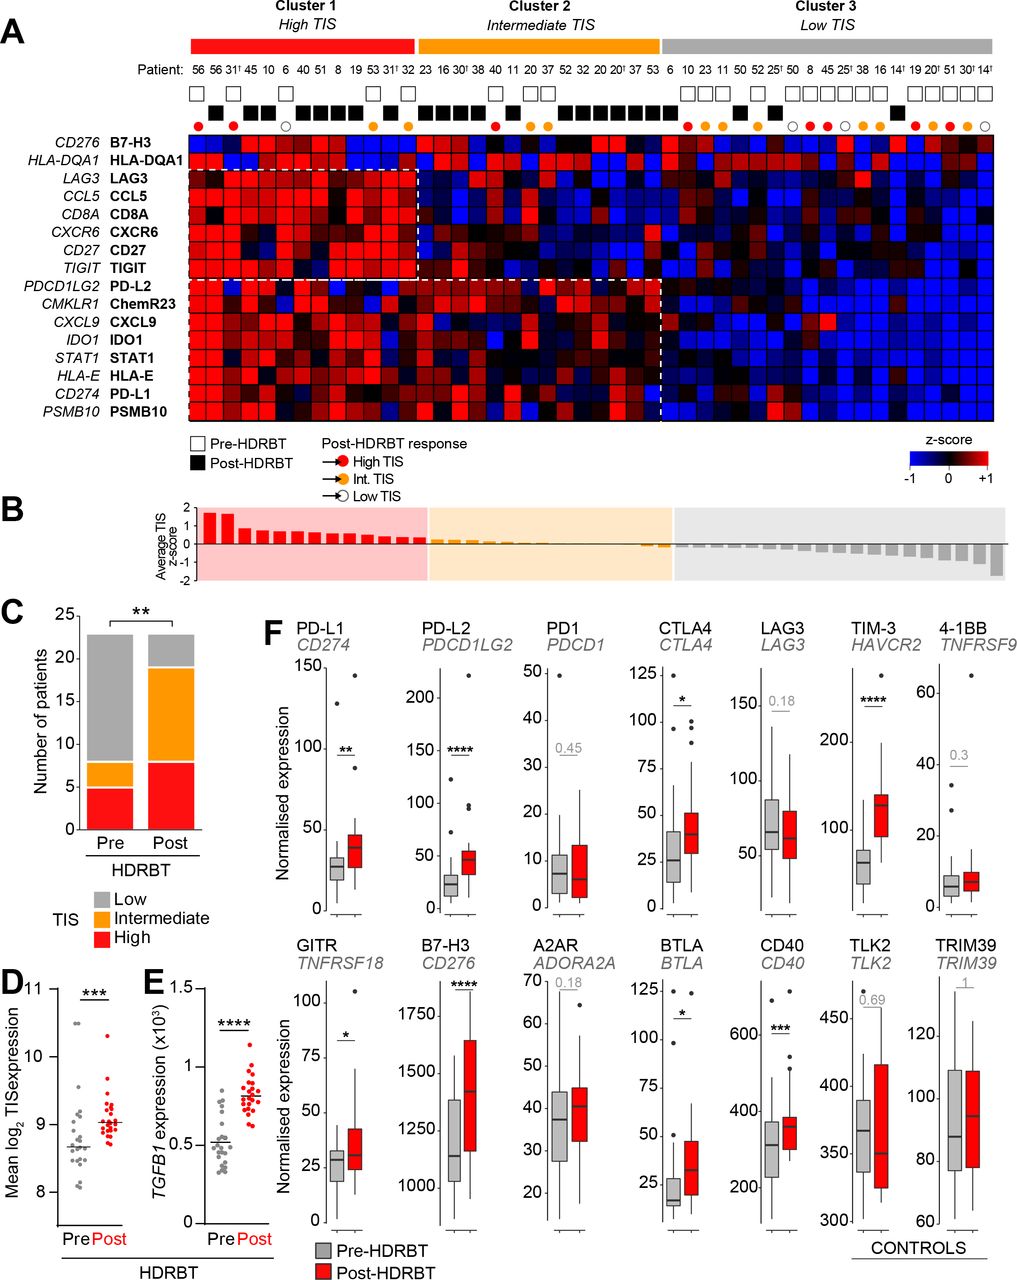
HDRBT induced a 16-gene TIS in localized PCa. (A) Heatmap of normalized expression levels of 16 genes in TIS and categorization by k-means clustering into three groups: (i) Cluster 1, high TIS, (ii) Cluster 2, intermediate TIS, and (iii) Cluster 3, low TIS. White and black boxes indicate either pre-HDRBT or post-HDRBT tissue, respectively. Colored circles indicate pre-HDRBT samples and their TIS category change post-HDRBT. (B) Averaged and ranked z-scores for the 16 genes in TIS indicated three categories. (C) Proportion of pre-HDRBT or post-HDRBT tissues in each of the three TIS categories identified in (A), the p value was calculated from χ² test. (D,E) Dot plots of (D) mean TIS expression and (E) TGFB1 mRNA levels in patient-matched pre-HDRBT or post-HDRBT-treated PCa tissue. Wilcoxon matched pair test. *P<0.05, **p<0.01, ***, p<0.001, ****p<0.0001. (F) Box-and-whisker plots of expression levels of immune checkpoint molecules in pre-HDRBT and post-HDRBT tissues from all patients in cohort. TLK2 and TRIM39 are provided as invariant controls. Significance was assessed using a Wilcoxon matched pair test. *P<0.05, **p<0.01, ***, p<0.001, ****p<0.0001. † represents RadBank-V1. HDRBT, high dose-rate brachytherapy; PCa, prostate cancer; TIS, tumor inflammatory signature.
We also confirmed that the HDRBT-induced PCa TIS increase was patient-specific and not stochastic (online supplementary figure S6). We then focused our analysis on the pre-HDRBT low TIS samples and found the vast majority (80%; 12/15) were converted to either an intermediate TIS (46.7%) or high TIS (33.3%). The remaining three patients did not respond to the radiation in terms of TIS (RA014, RA025, and RB050), with no clear underlying clinical (eg, Gleason Grade) or experimental cause (online supplementary figure S6). A bioinformatics analysis suggested that latent immune activation in baseline tissue (eg, IFNγ and TNFβ pathways) was associated with a good TIS response to HDRBT (online supplementary figure S7).
Immune checkpoint (IC) molecules were significantly changed (Paired Wilcoxon test; p<0.001, figure 2F) in response to HDRBT, including genes encoding PDL2, TIM-3, B7-H3, PDL1, CTLA4, GITR, BTLA, and CD40. HDRBT-unresponsive IC molecules included PD-1, LAG3, 4-1BB, and A2AR.
Immunotranscriptomic profiling the response of PCa to HDRBT
To more broadly describe immune gene expression changes induced by HDRBT, we interrogated all 770 genes evaluated by the Nanostring nCounter PanCancer Immune Profiling platform. Using a two-sample t-test, we identified 59 highly significant (false discovery rate=0) genes that were differentially expressed in response to HDRBT (online supplementary figure S8A). More in-depth analysis of these candidates revealed the strong overexpression of the p53 pathway and DNA damage-related genes (eg, CDKN1A/p21 and BAX) (online supplementary figure S8B). The monocyte/macrophage markers CD163 and CD14 were also highly expressed genes—both were identified in our previous pilot studies.11–13 Among the T cell specific markers, we identified LILRB2, CD86, and IL2RA—the latter of which is typically expressed on CD4+FOXP3+ Tregs and activated CD4+ T cells. Gene pathway analysis of the 59 candidates using EnrichR confirmed the enrichment of genes associated with CD14+ monocytes and the CD33+ myeloid lineage (online supplementary figure S8C: Human Gene Atlas database), and macrophage, inflammation, and complement activation markers (online supplementary figure S8D: Wiki Pathways). We identified the immune response was diverse and included the four main immune pathways assessed by the gene panel (innate, humoral, adaptive, and inflammatory; online supplementary figure S8E). Importantly, we verified that changes in gene transcripts encoding the mIHC markers used for Opal analysis reflect the overall density changes observed via multiplex IHC in later results—which was an important cross platform validation of our findings (online supplementary figure S9).
Taken together, our gene expression data suggest that HDRBT induced inflammation (as measured by TIS) exists in the majority of samples. However, this gene expression data are derived from bulk RNA, with several samples not harboring tumor zones. This supports the concept that the overall response is at least partially driven by the surrounding stromal tissue compartment rather than explicitly by tumor cells alone. Assessing these changes at a more detailed cellular level is crucial for unraveling the role of different immune cell types and tissue areas in driving differential responses to HDRBT. Therefore, we next employed digital spatial gene and protein expression profiling to understand this response in more detail in representative patients.
Digital spatial profiling identifies tissue-specific TIS changes driven by complex immune infiltrate
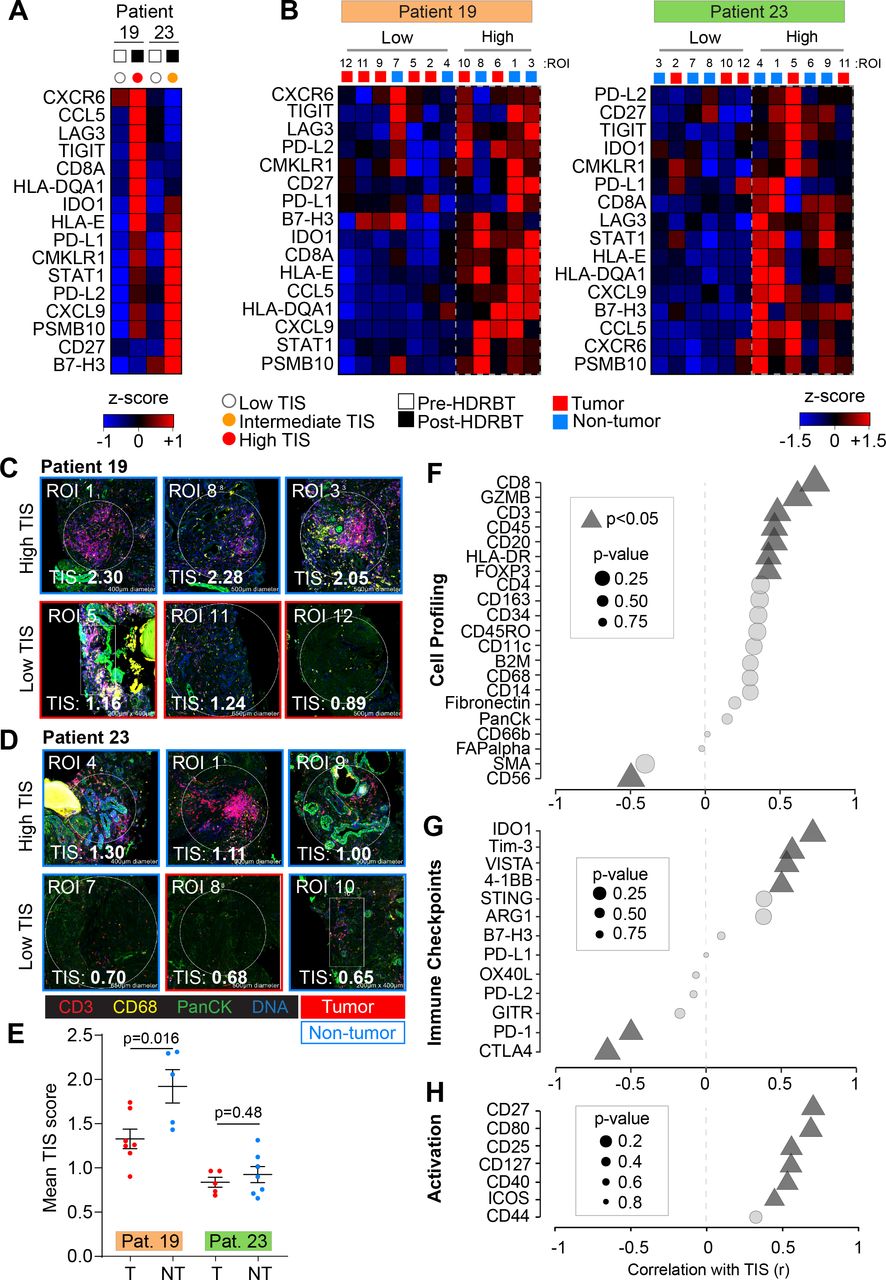
We then explored the cellular source of TIS expression, its dependency on the presence of tumor and the cause of the different two TIS expression patterns (ie, intermediate and high). To do this, we selected two patients that exhibited either an intermediate (RB023) or high (RB019) TIS response to HDRBT (figure 3A) and used Nanostring DSP to determine TIS expression. IHC staining was performed with DAPI, CD3, CD68 and Pan-cytokeratin targets to define cell distribution (online supplementary figure S10A) prior to regions of interest (ROIs) selection. Twelve ROIs were selected per patient sample (24 total) to include either tumor or nontumor zones (online supplementary figure S10B) and to contain a variety of T cell and Mφ infiltration (online supplementary figure S11) (marked by CD3+ or CD68+, respectively). Using matched ROIs in adjacent serial sections, we performed either RNA or protein IO (immuno-oncology) analyses using 78-plex RNA or 55-plex protein DSP IO panels, respectively. We first evaluated the relative expression of TIS in each patient ROI (figure 3B). K-means hierarchical clustering identified two groups of ROIs (high or low) on the basis of total TIS expression in both patients. This analysis did not completely segregate nontumor and tumor-bearing ROIs. We also confirmed that minor differences in surface area of the ROIs did not affect TIS expression (online supplementary figure S10C). To further explore the nature of TIS expression, we profiled the 24 ROIs for mean TIS expression and identified the highest and lowest-expressing tissue sites. This analysis, shown in figure 3C, revealed that the top TIS-expressing sites in both patients were in nontumor zones. This analysis also revealed the highest TIS ROIs (figure 3C–D, upper panels) also contained a large gross immune infiltrate characterized by both CD3+ T cells and CD68+ Mφ. The lowest TIS ROIs were more variable between the patients. RB019, an overall high-TIS class tissue, exhibited low TIS expression in tumor sites irrespective of immune infiltrate levels (figure 3C; lower panel). Conversely, low TIS ROIs in RB023 (intermediate TIS responder) were marked by a combination of tumor and nontumor sites, yet largely absent T cell and Mφ infiltrate (figure 3D; lower panel). To more robustly define this difference, we directly compared the mean ROI TIS levels between nontumor and tumor sites for both patients (figure 3E). This analysis revealed that patient RB019 exhibited significantly higher TIS expression in nontumor zones, while RB023 indicates a similar but not statistically significant difference. This analysis also confirmed that post-HDRBT tissue in RB019 has a higher overall TIS activation as a whole when compared with RB023 (p<0.0001) - consistent with the analysis in figure 2.

Digital spatial gene and protein expression profiling reveals cellular and immune checkpoint drivers of high and intermediate TIS. Heatmaps of normalized Nanostring TIS gene z-scores in two patients using (A) bulk tissue from pre-HDRBT and post-HDRBT tissues or (B) post-HDRBT ROIs (n=24) assessed using DSP human IO RNA panel. Tissue sites were determined using tumor histopathology (tumor and nontumor) and immune cell IHC staining for T cells (CD3) and Mφ (CD68) (12 ROIs per patient). High magnification examples of highest and lowest TIS-expressing ROIs in post-HDRBT tissue from patient (C) RB019 and (D) RB023. (E) Mean Nanostring DSP-derived TIS scores by tumor category in two patient samples (tumor zones: n=7/12(RB019) and n=5/12(RB023)). Pearson correlation of DSP IO proteins in (F) cell profiling, (G) immune checkpoint, or (H) activation protein classes with DSP RNA TIS score. DSP, digital spatial profiling; HDRBT, high dose-rate brachytherapy; ROIs, regions of interest; TIS, tumor inflammatory signature.
To understand which immune proteins are linked with TIS expression, we correlated the DSP protein data (55 proteins) with RNA TIS scores for matched ROIs in the full set of 24 ROIs. The protein results were also subdivided into cell profiling (figure 3F), immune checkpoints (figure 3G), immune activation (figure 3H) and pan-tumor markers (online supplementary figure S10D) categories to identify the primary molecules in each group. Using all 24 ROIs, we detected positive associations between markers of CD8+ T cells (CD45, CD3, CD8, and GZMB), MHC Class II (HLA-DR), Tregs (FOXP3), and B cells (CD20). Interestingly, we also identified a strong inverse correlation between CD56 protein levels (primarily a marker of NK, γδ T cells and activated CD8+ T cells) and TIS. We next investigated if IC protein levels may be related to TIS. VISTA, IDO1, 4-1BB, and Tim-3 were all positively associated with TIS (figure 3G). Conversely, CTLA4 and PD-1 were higher in areas of low TIS, which may indicate activated Tregs and corresponding immunosuppression. Importantly, many of these molecules were also shown to be upregulated overall in the tissue following HDRBT in figure 2E. Finally, we interrogated associations with proteins involved in immune activation and costimulation (figure 3H). Similar to previous results, we identified that CD27, CD80, CD25, CD127, CD40, and ICOS were all positively correlated with TIS.
In summary, the DSP data in two cases suggest that the HDRBT-induced TIS we observed in figure 2A is broadly driven by a mix of infiltrative immune cells that includes CD8+ T cells, Tregs, macrophages, and DCs. Immune-absent surrounding tissue possessed a relatively low TIS. Moreover, TIS responses were more pronounced in the case with a high TIS category (patient RB019) in nontumor areas. Such areas also do not seem to correlate with any other cell types aside from CD8+ T cells. Alternatively, intermediate TIS zones (patient RB023) appeared to be unaffected by the presence of tumor and possess a highly diverse immune context (T cells+Mφ+DC and so on). Our results also suggest that TIS levels were linked with IC expression including IDO1, VISTA, and Tim3 and potentially inhibited by PD-1 and CTLA4.
HDRBT-induced immune cell density alterations in PCa are dominated by regulatory T cells, DCs, and macrophages
The next stage of the study used multiplexed immunochemistry (mIHC) and computational analysis of major immune cell types and how they are altered following HDRBT in PCa. In order to further understand the impact of radiation on the immune contexture of PCa, we first evaluated cell density (cells per mm2) for all subsets in all tissue regardless of the presence of tumor. The results, shown in figure 4A, revealed that the overall density of immune cell subsets was not affected by radiation. The dominant cell populations present in the tissue were T cells, primarily comprised of CD4+ T cells and DNTs. Minor cell populations included PDL1+ macrophages and DCs, Tregs, and CD8+ T cells. Statistical analysis revealed that Tregs and PDL1- macrophage densities significantly increased post-HDRBT.

HDRBT significantly increased the density of CD4+FOXP3+ T cells and antigen presenting cells. Multiplex IHC was performed on PCa biopsies pre-HDRBT and post-HDRBT (n=24 patients). (A) Cumulative barplots of mean immune cell density either pre-HDRBT or post-HDRBT. P values calculated from two-tailed student’s t-test with * indicating p<0.05. (B) Immune subset density calculated from total number of identified immune phenotypes (see table 2) per square millimeter pre-HDRBT or post-HDRBT in each of the two designated tissue zones: (i) nontumor or (ii) tumor-containing. Statistical significance was calculated using a nonparametric Wilcoxon signed-rank test. P values indicated were appropriate. *P<0.05, **p<0.01, ***p<0.001. HDRBT, high dose-rate brachytherapy; IHC, immunohistochemistry; PCa, prostate cancer.
As radiation is hypothesized to drive differential immune responses in prostate tumor tissue, we next assessed the impact of the presence of tumor on the immune context. The results revealed that the changes established by looking at whole tissue (ie, Tregs and PDL1- macrophages) were largely maintained in both tumor and nontumor zones (figure 4B). However, we did observe that PDL1- DCs exhibited an increase in density post-HDRBT in both nontumor (p<0.05) and tumor zones (p=0.17). PDL1- macrophages exhibited the most interesting pattern of infiltration, with a small but statistically robust density increase that was higher in tumor zones compared with nontumor—potentially driven by the preferential phagocytotic response to tumor cell damage and apoptosis following HDRBT. PDL1+ antigen presenting cell (APCs) (Mφ and DC) were a very minor population and exhibited no change in response to HDRBT. As expected, the density of HMWCK+ cells was lower in tumor zones and highly sensitive to HDRBT. PDL1+ HMWCK- cells, a mix of tumor and normal stromal cells, were uniquely decreased in tumor zones. The decreased density of stromal/tumor cells that express PDL1, along with increased PDL1-expressing APCs in the tumor sites, is potentially indicative of zone-specific cell death from ionizing radiation (eg, DNA damage-induced apoptosis), inflammation, and subsequent recruitment of macrophages to the irradiated site. The results of this analysis revealed the immune cell density in prostate tissue is heterogeneous and surprisingly resilient to HDRBT; evident in only modest changes in cell densities.
The tumor inflammation signature is associated with radioresponsive immune cell relationships
Localized immune network signaling occurs following key interactions between immune cells (eg, antigen presentation between DCs and cytotoxic T cells). We hypothesized that HDRBT also alters relative density associations as well as spatial features (ie, distance) between key immune cell subsets. Similar to the overall density of certain immune subset, this is also hypothesized to influence TIS activation levels.
Cell density associations in nontumor and tumor zones are perturbed by HDRBT
We first performed an analysis of the correlations between different immune subsets in all samples and included both tumor and nontumor tissue zones. This revealed that numerous immune cell densities were significantly correlated in our PCa cohort (online supplementary figures S12A and S12B) regardless of tumor content. These subset pairs include T cells/B cells, CD4+ T cells/Tregs and PDL1- APCs (DC and Mφ) with CD4+ T cell subsets (CD4+ T cell and Treg). When cell densities were subdivided by tissue zone and irradiation status, only a proportion of these associations are retained in common (eg, CD4+ T cell and Treg) and most were restricted to each tissue type without a clear pattern (online supplementary figure S12C). We therefore performed a differential Pearson correlation analysis to better resolve these differences. The results of this analysis (figure 5A) revealed that only two association gains were conserved between the two tissue zones, between PDL1+ DC and PDL1+ Mφ, and Tregs and B cells. The strongest postradiation changes in tumor zones only included a gained association between T cells and PDL1+ HMWCK+ cells. Interestingly, this occurred in parallel with lost associations between T cells and both PDL1+ macrophages and B cells. Following HDRBT, both Tregs and CD4+ T cells were more associated with PDL1+ HMWCK- in the tumor zone only. The interaction of PDL1- DCs with their PDL1+ counterparts, as well as with PDL1+ macrophages and B cells, was also preferentially lost in tumor zones. Taken together, this analysis renders a picture of radiation-induced changes in associations between T cells and APC subsets that appears to be influenced by the presence of tumor.
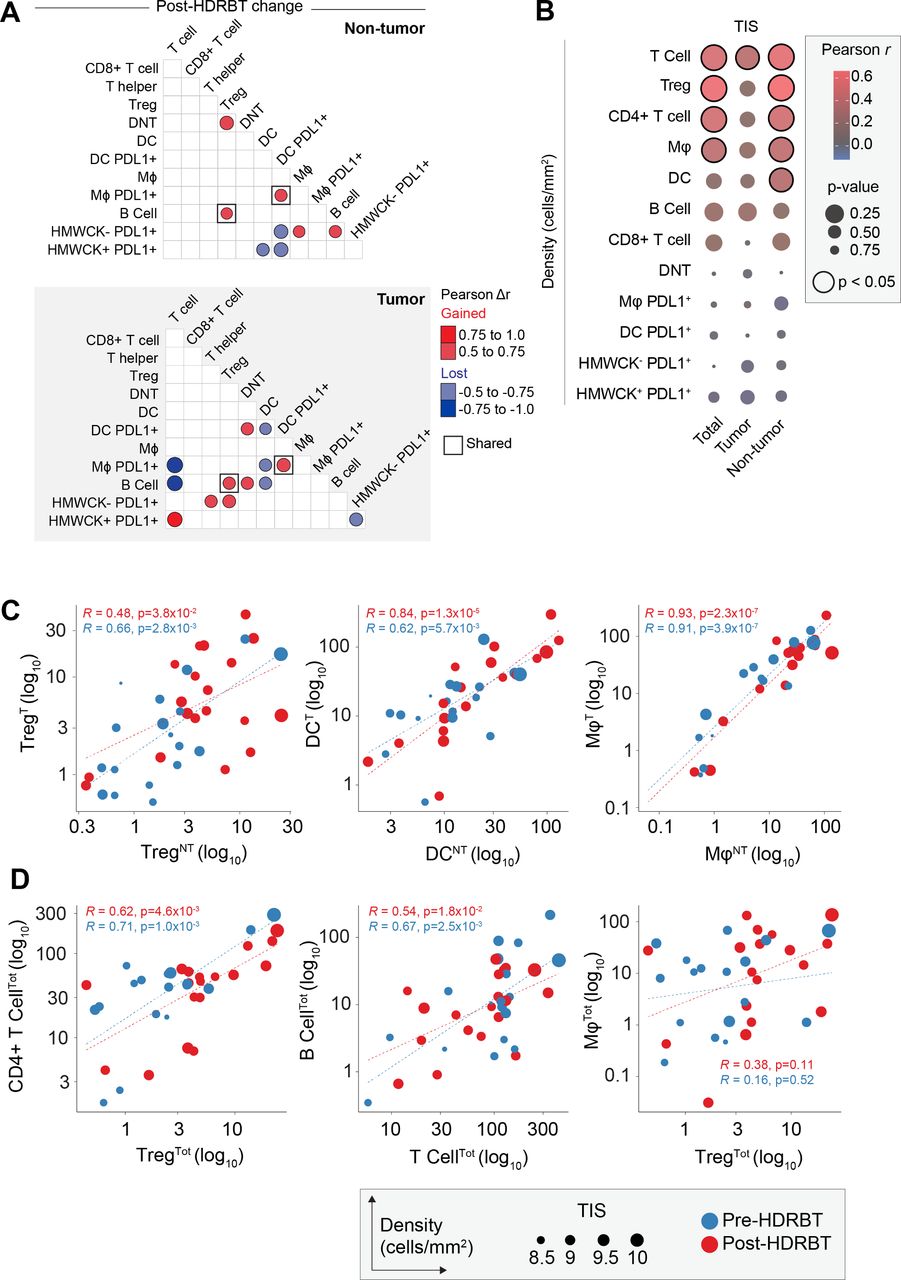
Immune cell density relationships correlate with TIS signature. (A) Computed differences in Pearson correlation (Δr) for either (i) nontumor and (ii) tumor following HDRBT. Color indicates direction of change, that is, red=gained association, blue=lost association. Only significant associations are shown. (B) Bubblechart of correlation (Pearson r) between immune cell densities in different tissue zones (total, tumor, or nontumor) and TIS signature. Significant correlations indicated. (C) Scatterplots of highly significant immune cell subset correlations between tumor and nontumor tissue zones, and (D) highly significant cross-subset correlations in total tissue, with relative TIS level and HDRBT radiation-status indicated. (T: tumor zone, NT: nontumor zone, Tot: all tissue zones). Pearson correlation r values and corresponding p values indicated. HDRBT, high dose-rate brachytherapy; TIS, tumor inflammatory signature.
To understand if the densities of immune subsets correlate with changes in tumor inflammation (TIS), we next correlated total, tumor and nontumor immune subset densities with the TIS signature using Pearson r analysis. The results (figure 5B and online supplementary figure S13) confirmed that CD3+ T cells, Tregs, CD4+ T cells, and Mφ all correlate significantly with TIS. Perhaps most interesting was that these correlations were most significant in nontumor tissue, with the exception of CD3+ T cells. DCs were also observed to correlate with TIS in nontumor zones. Overall, this suggests that immune cells in nontumor areas are responsible for changes in TIS. To support this, we next compared the relative density of Treg, DC, and Mφ between tumor and nontumor zones (figure 5C). This analysis confirmed that all were strongly correlated, suggesting other factors are likely involved. These data suggest that many immune subsets are strongly correlated and also responsive to radiation in terms of TIS. We therefore compared the most potent combinations (figure 5D) and revealed that some are highly correlated (CD4+ T cells/Tregs and B cell/T cell) and some noncorrelated (Treg/Mφ). Overall, this density analysis reinforces the notion that specific combinations of immune cell relationships are more important to the HDRBT TIS response than others.
Tumor-specific immune cell distance relationships are tightly linked with the TIS response to HDRBT
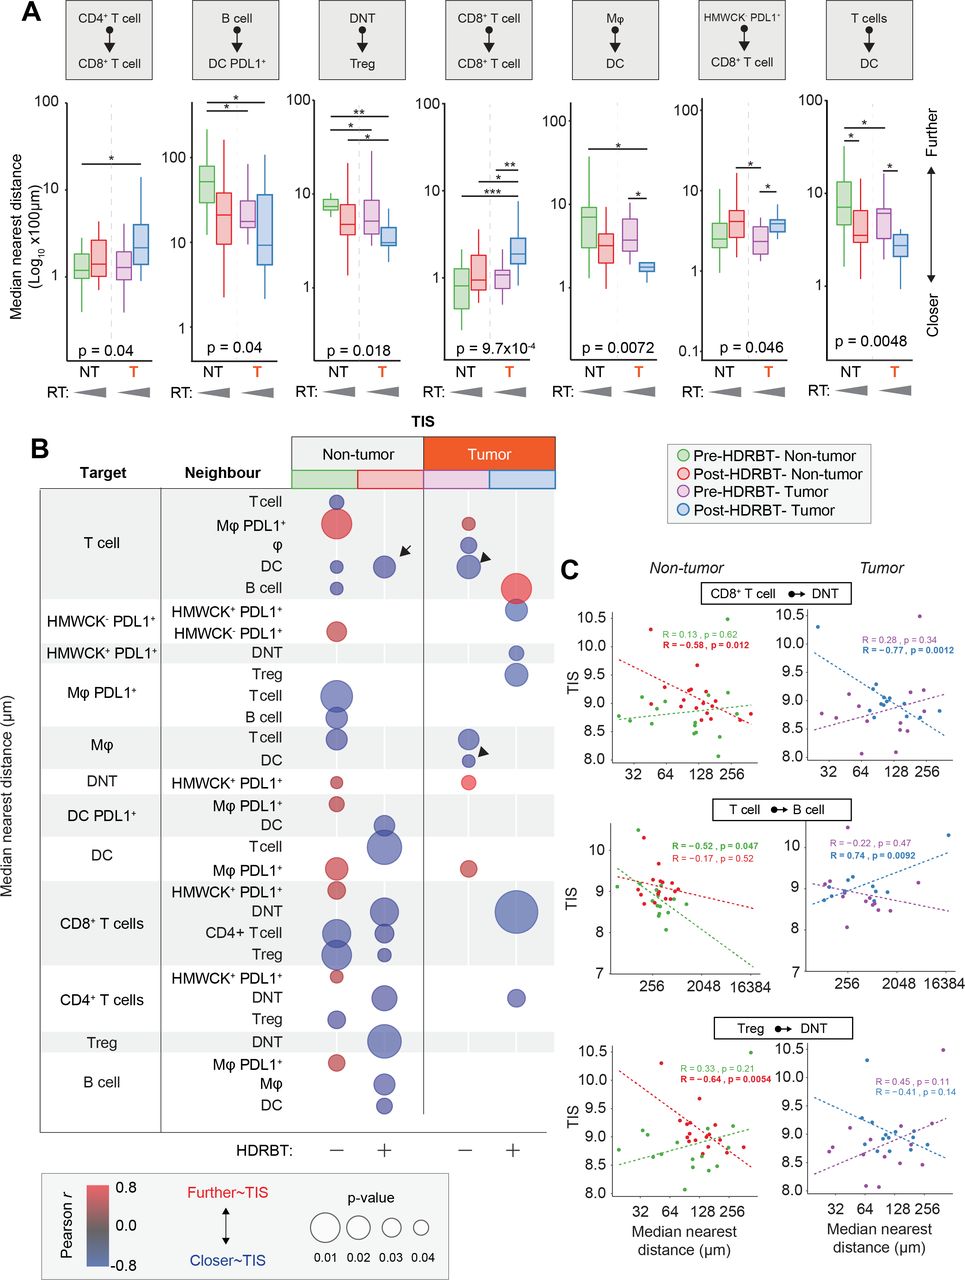
Another major determinant of immune signaling in tissue is the spatial relationships between key immune cell subsets. To address this, we used the spatial information within the multiplex IHC dataset to characterize the median distance between all immune cell subsets (online supplementary figure S14). This resulted in a total of 72 unique interactions over the two multiplex IHC panels in each of the four tissue types according to tumor and radiation status. We first used ANOVA analysis to shortlist those spatial relationships with statistical difference and identified seven with some degree of variation between the four groups (online supplementary table 3). The most significant changes were observed between CD8+ T cell/CD8+ T cell (p<0.00097), T cells/DCs (p<0.0048), and Mφ/DC (p<0.0072)(table 3). Other significant differences were observed between DNT/Treg, B cells/DC PDL1+, CD4+ T cells/CD8+ T cells, and HMWCK-PDL1+/CD8+ T cells. We next performed a statistical pairwise Wilcoxon test analysis to resolve specifically where these changes occurred (figure 6A). We revealed that the main spatial response to radiation was a decrease in distance between T cells/DC and Mφ/DC decreases in both tumor and nontumor zones. Conversely, the only spatial proximity which was lost was between CD8+ T cells as a whole. We also observed that DNT and Tregs were closer together in tumor areas.
Top 20 significantly perturbed median spatial relationships in PCa tissue in response to HDRBT
Immune cell spatial interactions change following HDRBT and uniquely associate with TIS signature. (A) Box-and-whisker plots of median cell-cell distance in seven significantly altered immune cell subset pairs in four major tissue zones: (i) pre-HDRBT: nontumor zone, (ii) post-HDRBT: nontumor zone, (iii) pre-HDRBT: tumor zone, and (iv) post-HDRBT: tumor zone. Significance between group is calculated using uncorrected Wilcoxon test. n=17 patients. (B) Bubblechart plot of significant target-cell and neighbor-cell median distance correlations with TIS signature in four tissue groups. Positive correlations indicate a higher median cell-cell distance association with higher TIS. Only significant (p<0.05) correlations are shown. (C) Examples of highly significant median distance to TIS correlations with Pearson r calculations for each of four categories of tissue. *P<0.05, *p<0.01, ***p<0.001. HDRBT, high dose-rate brachytherapy; TIS, tumor inflammatory signature.
Similar to the previous density analysis, we next compared the median distance between all 72 subsets and the normalized TIS expression level. The results, shown in figure 6B, showed that 29/72 interactions were influenced TIS. There was a significant difference according to tumor status, with 67% and 33% being associated with TIS in nontumor and tumor zones, respectively. This corroborates our previous density analysis, which suggested that the nontumor areas are most important for TIS activation. Also, the bulk of these correlations (70%) were negative, largely in post-HDRBT tissue (100% of nontumor, 83% of tumor zones). Some of the most significant examples of these changes are provided in figure 6C. Overall, this analysis suggests that close cell-cell interactions are key for increased TIS activation following HDRBT. However, we did observe one post-HDRBT increase at a distance that was specific to tumor zones, between T cells and B cells.
Discussion
Clinical outcomes for patients with localized PCa are linked to features such as the serum prostate-specific antigen level, tumor stage, and grade, along with treatment factors. Patients with more aggressive clinical features, however, have higher rates of recurrence with all treatment options,1 4 including with HDRBT, and these recurrences may be either local or metastatic17 and significantly impact survival.18
Key to improving outcomes from HDRBT is the detailed understanding of cellular and molecular responses to the radiation, with a view to design of rational combination approaches. Here, we have specifically explored HDRBT-induced immune responses in PCa at the level of gene expression signatures and infiltrative immune cells, and also asked whether these changes were driven by tumor cells or surrounding tissue. This is the first study to analyze immune responses to HDRBT in localized human PCa. The immune context of localized PCa has thus far only been explored in cells isolated from radical prostatectomy samples.6 19–23 Prior studies showed PCa infiltrating lymphocytes (PILs) included CD8+ effector memory T cells21 which were oligoclonal and PD-1+,22 accompanied by increased regulatory CD4+ and CD8+ T cells with suppressor function.19 20 In addition, IHC showed PCa lesions were surrounded by lymphocyte clusters enriched for FOXP3+, PD-1+, and PDL1+ cells.6 Thus, the emerging picture for PCa is one of immune exclusion and immune suppression.
Our results revealed that PCa tissues have immune activation states in three distinct TIS levels with two-thirds of pre-HDRBT tissues having a low TIS—indicating an inactive immune microenvironment. This distribution was reversed following radiation, with over 80% of tissues possessing a high or intermediate TIS after HDRBT. Using a combination of multiplex IHC and digital spatial gene and protein profiling (DSP), we showed this TIS change is intimately linked with several immune cell densities, specifically those of active T cell subtypes and APCs—supporting the notion that the two processes are linked. The DSP analysis also revealed that the strongest TIS responses are driven primarily by nontumor zones and was associated primarily with CD8+ T cells. Conversely, intermediate TIS is agnostic to tumor and is linked with a much more diverse group of T cell and APC cell subtypes. Here, we showed an association between increased CD20 (B cells) and TIS within the selected ROI. B cells traffic into tissue via the CXCL13-CXCR5 axis,24 25 CXCL13 is secreted by stromal cells and follicular dendritic cells in B cell26 and by resident memory CD8+ T cells in human cancers where CXCL13 participates in tertiary lymphoid structure formation.27 CXCL13 is also secreted in PCa by myofibroblasts in an androgen deprivation context.28 In contrast, CD56 (Neural Cell Adhesion Molecule, NCAM) was negatively correlated with TIS. CD56 is expressed on cytotoxic lymphocytes including natural killer cells, γδ T cells and natural killer T cells, CD56 is also expressed on prostate neuroendocrine cells and their malignant counterpart.28 Taken together, our findings suggest that the ROI with high TIS attract B cells, but not cytotoxic lymphocytes and/or neuroendocrine cells.
The presence of numerous therapeutically significant IC molecules in conjunction with TIS in two selected cases, including VISTA, IDO1, 4-1BB, and Tim3, raises possibilities for combination treatment with HDRBT. Both VISTA and IDO1 were associated with tumor resistance in ICB-treated PCa.29 30 Whether these IC molecule changes are drivers or responders to HDRBT-induced responses remain to be seen but warrants further investigation in additional patients and radiation states. Overall, these results reveal that immune signaling gene expression is profoundly influenced by HDRBT and is not confined to tumor areas. Interestingly, we did find three patients (all intermediate risk GG2 and GG3 adenocarcinoma) that did not respond to HDRBT in terms of TIS immune activation and possessed low levels of latent IFNγ activation. While there were was no clear clinical or pathological reasons for this, identifying if there are other underlying reasons (eg, genetic mutation or rare pathology) responsible could shed further light on the drivers of TIS activation in the context of HDRBT. A published study of patient responses to stereotactic body radiotherapy combinations with anti-PD1 immunotherapy have suggested that IFNγ pathway activation is important for the fidelity of patient responses.31 A caveat of our study is that the biopsy procedure, in conjunction with HDRBT, could contribute to inflammatory and wound healing responses in the tissue. It is important to note that while we assessed the TME after a single high dose of radiation, the patients received additional radiation doses of 10 Gy HDRBT and 46 Gy of conventionally fractionated external beam radiation therapy (EBRT). This additional radiation, as well as any androgen deprivation, could further modulate the immune response subsequent to the initial dose of HDRBT. This should be investigated further to determine its impact on immune checkpoint therapies in localized PC.
To further understand the potential cellular drivers of this response, we used multiplexed IHC to characterize the immune cell environment before and after HDRBT. This revealed that Tregs, Mφ, and DCs were the predominant cellular density change in response to HDRBT. TGFβ, which was highly expressed postradiation, is also an immunosuppressive cytokine in PCa and linked with the presence of Tregs and Mφ.32 This occurred in the context of the majority of other immune cell types which did not alter in density, yet likely repopulated the TME to a similar level following the large dose of radiation. Interestingly, DNTs represented a relatively large fraction of T cells in both pre-HDRBT and post-HDRBT conditions (~35% total T cells). While interesting, our analysis could not further resolve this population due to the absence of appropriate markers for putative sub-types of DNTs (eg, γδ T cells, MAIT cells, NKT cells). Despite relatively few cells significantly changing in overall density, we observed numerous cell association changes following radiation, predominately between PDL1+ APCs and T cell subsets. For Tregs and DCs, this effect was largely observed to occur in all areas of PCa tissue. However, the density of PDL1- macrophages is positively influenced by the presence of tumor– potentially indicating the presence of M2 polarized tumor-associated macrophages (TAMs). This observation was supported by the Nanostring gene expression profiling which revealed markers of M2 TAMs,33 notably CD14, CD163, HLA-DRA, and CD68, were enriched post-HDRBT. This observation was also noted in our existing proteomic analyses of post-HDRBT PCa tissue.13 The presence of large numbers of T cell subsets after this substantial dose of radiation may indicate trafficking of new T cells.
Immune checkpoint molecule expression in cancer tissue is of paramount importance to the efficacy of immune checkpoint blockade drugs.34 We identified a large number of changes in many IC molecules, and all increased following HDRBT. Despite not being certain of the cellular source of these molecules, increased PDL1 and PDL2 expression is consistent with the observed increases in M2 macrophages and DCs; however, our multiplex IHC analysis of PDL1 expression on these cells does not support this conclusion. We instead observed decreases in PDL1+-expressing HMWCK+ (basal glands) and HMWCK- (tumor, epithelial, fibroblast) cells after HDRBT. This suggests that the source of increase in PDL1 expression is likely to be from cells that were not assessed by mIHC, either by differences in antibody clone specificity or simply that its expression is tightly controlled at the translational level. CTLA4 and TIM3 are both highly expressed on Tregs,35 36 and high expression of B7-H3 and CD40 are both observed on licensed APCs. Further work will be required to understand the source of these IC molecule changes and to understand how these changes are relevant to the immune response post-HDRBT.
A striking observation made through this study related to the changes in the magnitude and diversity of spatial relationships between different cells in both tumor and nontumor regions in response to HDRBT. While many associations were acutely affected by radiation (eg, increased proximity of T cell and DCs), further studies exploring T cell function are needed to reveal what this means to the immune response in PCa. These spatial relationship changes could dramatically affect intrinsic immune signaling pathways, we observed that many tissue-specific spatial interactions were strongly linked with TIS signatures (eg, loss of T cell–B cell proximity in tumor zones). Our DSP data suggest that localized factors either control or are responsive to the TIS response. Importantly, patients appear to exhibit very different responses to radiation. Further work will be required to unravel the clinical importance of these relationship, if they are of predictive value and relevance to therapies.
Radiation therapy has the potential to change the solid tumor microenvironment to make this amenable to trafficking and the persistence of T cells. We demonstrated that HDRBT-induced changes in the immune cell density of PCa are restricted to macrophages, DCs, and Tregs. This suggests that the observed changes in TIS levels post-HDRBT are the consequence of altered immune cell network signaling and were correlated with changes in immune subset spatial relationships. This suggests that a significant number of patients with PCa have a pre-existing immune response, which is held in check by peripheral tolerance mechanisms. Likely candidates in PCa include high levels of TGF-β and increased Tregs and immune-suppressive macrophages.
In terms of the clinical relevance of our findings, existing GEP studies have revealed that Th1-mediated adaptive immunity and inflammatory GEPs are positively associated with good outcome in patients with localized PCa.37 Additional work has also focused on generating gene expression profiles associated with clinical outcomes, rather than predicting immune responses, which has ramifications for immune-targeted therapies.38
Conclusion
Taken together, our findings suggest that strategic therapeutic targeting of immunosuppressive mechanisms (eg, TGF-β), plus immune checkpoint inhibitors with HDRBT, could help drive a systemic response to PCa. We envisage that this could be used to improve cancer control in those with high-risk disease where outcomes are currently poor or to enable treatment deintensification to improve the side-effect profile in those with less aggressive disease treated with RT. Larger numbers of patients with assessment of long-term clinical outcomes will be required to fully understand the full potential of immunotherapeutic approaches in PCa radiotherapy.
Supplemental material
Acknowledgments
The authors would like to thank the Molecular Genomics Facility and the Centre for Advanced Histology and Microscopy at the Peter MacCallum Cancer Centre for their assistance with performing experiments.
References
Footnotes
Contributors SPK, HH, SGW, and PJN conceived and designed the study. SPK, HH, TN, NVKL, DB, and GR performed experiments. SPK, MW and FC performed bioinformatic and statistical analyses. CM performed uropathological inspection. SPK and PJN drafted the manuscript. SPK, HH, PJN, SH, YH, CM, DB, GR, PD, SS, and PB critically revised the manuscript.
Funding This study was funded by the PeterMac Foundation, the Victorian Cancer Agency, a Prostate Cancer Foundation USA (Creativity award), Cancer Council Victoria (Grant-In-Aid), and an NHMRC Program Grant.
Competing interests None declared.
Patient consent for publication Not required.
Ethics approval All participants provided consent covering tissue research as part of a prospective tissue collection study for prostate radiobiology research, approved by the Human Research Ethics Committee at the Peter MacCallum Cancer Centre (PMCC; HREC approvals 10/68, 13/167, 18/204).
Provenance and peer review Not commissioned; externally peer reviewed.
Data availability statement Data are available on reasonable request.