Article Text

Abstract
Introduction Local T-cell immunity is recognized for its contribution to the evolution and therapy response of various carcinomas. Here, we investigated characteristics of tumor-infiltrating lymphocytes (TILs), as well as T-cell evasive mechanisms in different soft tissue sarcoma (STS) subtypes.
Methods Liposarcoma, gastrointestinal stromal tumor (GIST), leiomyosarcoma, myxofibrosarcoma and pleomorphic sarcomas were assessed for T-cell numbers and phenotypes using flow cytometry. Next-generation sequencing was used to analyze T-cell receptor repertoire, mutational load, immune cell frequencies, and expression of immune-related genes.
Results GIST, myxofibrosarcoma and pleomorphic sarcoma showed high numbers of CD8+ TILs, with GIST having the lowest fraction of effector memory T cells. These TILs coexpress the immune checkpoints PD1, TIM3, and LAG3 in myxofibrosarcoma and pleomorphic sarcoma, yet TILs coexpressing these checkpoints were near negligible in GIST. Fractions of dominant T-cell clones among STS subtypes were lowest in GIST and liposarcoma, whereas mutational load was relatively low in all STS subtypes. Furthermore, myeloid-derived cells and expression of the costimulatory ligands CD86, ICOS-L and 41BB-L were lowest in GIST when compared with other STS subtypes.
Conclusion STS subtypes differ with respect to number and phenotypical signs of antitumor responsiveness of CD8+ TILs. Notably, GIST, myxofibrosarcoma and pleomorphic sarcoma harbor high numbers of CD8+ T cells, yet in the GIST microenvironment, these T cells are less differentiated and non-exhausted, which is accompanied with a relatively low expression of costimulatory ligands.
- immunology
- oncology
- tumors
This is an open access article distributed in accordance with the Creative Commons Attribution Non Commercial (CC BY-NC 4.0) license, which permits others to distribute, remix, adapt, build upon this work non-commercially, and license their derivative works on different terms, provided the original work is properly cited, appropriate credit is given, any changes made indicated, and the use is non-commercial. See http://creativecommons.org/licenses/by-nc/4.0/.
Statistics from Altmetric.com
Introduction
Soft tissue sarcomas (STSs) are a collection of heterogeneous tumors of mesenchymal origin with over 50 different subtypes that can originate from fat, muscle, nerves, fibrous, endothelial, or deep skin tissues. For most patients with non-metastatic STS, standard care of treatment includes surgical resection with or without perioperative (neo)adjuvant chemotherapy or radiotherapy. Depending on the cancer stage and histological subtype, on average, 25%–50% of these patients develop recurrent and/or metastatic disease. The median survival of metastasized STS after treatment by chemotherapy is only 10–15 months.1 2 Therefore, there is an urgent need for novel and effective therapies for the treatment of advanced STS.3 Gastrointestinal stromal tumor (GIST) is different from most STS subtypes, forming a favorable exception. Of these tumors, 85%–90% harbor a mutation in the genes encoding the tyrosine-protein kinase KIT, CD117 (cluster of differentiation 117) or platelet-derived growth factor receptor α, rendering these tumors highly sensitive to the targeted drug imatinib.4
Immune therapies have demonstrated therapeutic value in various tumors and have also been tested in STS. Currently, an extending number of studies is exploring the efficacy of different immunotherapeutic treatment strategies in sarcomas.5 6 Interferons (IFNs) (α/β),7 8 interleukin-2,9 and cancer vaccines have been tested and were reported to induce limited antitumor activity in small fractions of patients with STS.10 Adoptive transfer of NY-ESO1 T-cell receptor (TCR) gene-engineered T cells, however, showed objective responses in 11 out of 18 (61%) patients with NY-ESO1-positive synovial cell sarcoma.11 12 In addition, immune checkpoint antibodies yield objective though variable responses in STS subtypes.13–17 For example, in a study treating patients with various STS subtypes, partial responses were observed for pleomorphic sarcoma, liposarcoma, and synovial sarcoma.18 A recent study, treating a total of 85 patients with various STS subtypes with nivolumab (n=43) or nivolumab plus ipilimumab (n=42), concluded that nivolumab monotherapy does not warrant further study in an unselected STS cohort of patients, given its limited overall efficacy.19 In contrast, in the nivolumab plus ipilimumab group, 6 out of the 38 evaluable patients demonstrated an objective response. Responses were seen in patients with uterine leiomyosarcoma (n=1), non-uterine leiomyosarcoma (n=1), myxofibrosarcoma (n=1), undifferentiated pleomorphic sarcoma or malignant fibrous histiocytoma (n=2), and angiosarcoma (n=1).19 A third study treating various metastasized STS subtypes and bone sarcoma with pembrolizumab (SARC028 trial) reported a 18% objective response rate, with the majority of responses occurring in patients with undifferentiated pleomorphic sarcoma and dedifferentiated liposarcoma.20 Based on the aforementioned studies, it appears that some STS subtypes respond more often to immune therapies than other subtypes. Interestingly, recent in-depth analysis of the pretreatment tumor biopsies from the SARC028 trial demonstrated that patients responding to pembrolizumab had higher densities of activated T cells. In addition, densities of intratumoral CD8+ T cells at baseline correlated with a better progression-free survival.21 GIST, a subtype that is mostly studied separately from other STS subtypes, was not included in the aforementioned clinical studies. In silico analyses using this STS subtype have demonstrated gene expression patterns associated with immune checkpoint inhibitor responses.22 Studies treating metastasized GIST with nivolumab alone or in combination with ipilimumab are currently pending (NCT02880020).
In various cancer types, numbers and activation state of immune effector cells, in particular, CD8-positive (CD8+) tumor-infiltrating lymphocytes (TILs) have predictive value with respect to the responsiveness to immune therapies.23 24 Among STS subtypes, local CD8+ T-cell immunity varies significantly and may explain the variable clinical effects of immunotherapies observed when treating STS subtypes.25 26 Importantly, numbers and activity of CD8+ T cells are strictly controlled in non-cancerous tissues to avoid collateral tissue damage; such control is generally the result of multiple feedback loops that keep CD8+ T cells in check, and such feedback loops are often ‘hijacked’ by tumors to limit an effective antitumor CD8 T-cell response. Along these lines, CD8+ T-cell immunity is best reflected by multiple parameters,27 including the expressions of major histocompatibility complex (MHC) molecules, immune and metabolic checkpoints, as well as the frequency of suppressor cells.28 29 To better understand differences in immune contextures in STS, across subentities, and the possible clinical consequences thereof, we have in this study assessed numbers and phenotypes of CD8+ TILs, as well as the immune microenvironments of different STS subtypes using single-cell flow cytometry (FCM), immunohistochemistry (IHC) stainings and in silico analyses of mutational load, T-cell clonality, frequencies of immune cells, and expression of immune-related genes.
Materials and methods
Patients and samples
All patients with non-metastatic STS eligible for surgery at the Erasmus MC were included after providing written informed consent and covered the following subtypes: GIST untreated and imatinib treated, leiomyosarcoma, liposarcoma, myxofibrosarcoma and pleomorphic sarcoma. For STS subtypes like angiosarcoma (n=2) or Kaposi sarcoma (n=1), numbers were limited, and therefore, these subtypes were excluded from this study. Lipoma and melanoma lesions eligible for surgery at the Erasmus MC were included as controls. Part of tumor resection specimen was formalin-fixed and paraffin-embedded (FFPE) for routine pathology to confirm STS subtype and were retrieved from the Erasmus MC, Department of Pathology, for IHC stainings. All STS subtypes and melanoma specimen were histologically verified by a pathologist. The remainder of the tissue was processed into a single-cell suspension to analyze numbers and phenotypes of intratumoral T cells. Patient characteristics are shown in table 1, and detailed information is provided in online supplementary table 1. For the IHC stainings, additional STS samples were included to strengthen the statistical power of the analysis. Slides were provided by the Erasmus MC Cancer Institute, Department of Pathology, when tissues were of the STS histologies relevant to our study, and slides were selected according to date (most recent added materials first). All STS subtypes contained a total of n=15 tissue samples, and lipoma and melanoma each had n=10 tissue samples. Two melanoma samples showed a very high melanin content for appropriate evaluation and were therefore excluded from the IHC analysis.
Supplemental material
Patient characteristics
Tumor-derived single-cell suspensions
Freshly obtained tumor material was dissociated or stored overnight in complete medium (RPMI-1640 with Hepes (Lonza, Verviers, Belgium), supplemented with 10% human serum (Sanquin, Amsterdam, The Netherlands), 1% L-glutamine (Lonza) and 1% penicillin/streptomycin (Lonza)) at 4°C prior to dissociation. The tumor tissue was weighed, cut in small fragments of approximately 1 mm3, placed in RPMI-1640 with Hepes supplemented with 1% penicillin/streptomycin, 0.1 mg/mL collagenase (Type A, Sigma-Aldrich, St. Louis, Missouri, USA) and 10 µg/mL DNAse (Roche), and mechanically dissociated using the gentleMACS Dissociator (program C and program h_tumor_01) (Miltenyi, Bergisch Gladbach, Germany). Subsequently, tumor pieces were incubated for 60 min at 37°C and 5% CO2 under continuous rotation, after which cells were passed through a 70 µm strainer (Greiner Bio-One, Kremsmünster, Austria) and washed once with complete medium.
Flow cytometry
FCM panels were used to assess frequencies of T-cell subsets according to expression of T-cell coreceptors, maturation markers and coinhibitory receptors. For these panels, the following monoclonal antibody (mAb) conjugates were used: CD3-Pacific Blue (clone UCHT1; BD Biosciences, San Jose, California, USA), CD4-BV785 (clone RPA-T4; Sony Biotechnology, San Jose, California, USA), CD8-BV605 (clone SK1, BD Biosciences), CD14-PerCP (clone MϕP9, BD Biosciences), CD272-APC (BTLA, clone MIH26, Sony Biotechnology), CD223-PE-Cy7 (LAG3, clone 3DS223H; eBioscience, San Diego, California, USA), CD279-APC-Cy7 (PD1, clone EH122H7; Biolegend, San Diego, California, USA), CD366-FITC (TIM3, clone F38-2E2, eBioscience), CCR7-PE (clone 150503, R&D Systems, Germany) and CD45RA-BV510 (clone HI100, BD Biosciences). All antibody fluorochrome combinations were selected and titrated to prevent spillover in the different fluorescence channels. For stainings, 100 µL of single-cell suspensions was incubated with antibodies for 15 min at room temperature, washed with phosphate-buffered saline (PBS, Lonza), and resuspended in 1% buffered phosphate-buffered saline (PBS)/paraformaldehyde. FCM data acquisition was performed on a Celesta flow cytometer (BD Biosciences) equipped with FACSDiVa V.8.x software (BD Biosciences) following gating on single live cells (7-AAD negative; 7-AAD from BD Biosciences). Analysis was performed using FlowJo software (Ashland, Oregon, USA). Unstained controls were taken along for every sample and were used to set thresholds (see online supplementary figure S1 for FCM gating strategy). Maturation stages of CD8+ T cells were defined as follows: naïve T cells, TN, are CCR7+/CD45RA+; central memory T cell, TCM, are CCR7+/CD45RA−; effector memory T cells (TEM) are CCR7−/CD45RA−; and effector memory expressing CD45RA T cells (TEMRA) are CCR7−/CD45RA+. T-cell numbers per gram of tumor were derived from CD3+ T-cell counts in 100 µL cell suspension (10% of total volume) divided by tumor weight.
Immunohistochemistry
FFPE tissues were cut into 4 µm sections and stained with anti-CD8+ (clone SP57; Ventana, Basel, Switzerland). Stained slides were developed with DAB chromogen, counterstained with hematoxylin and mounted in Optisure using Ventana coverslips. Whole tissue slides were scanned (magnification: ×10) using Vectra V.3.0 (PerkinElmer, Waltham, Massachusetts, USA). Regions of interest (12 in total: 6 at the tumor margins and 6 at the tumor centers, all evenly distributed) were selected for multispectral imaging (×20). Subtype-specific tissue-finding algorithms were generated using InForm software (PerkinElmer) that enabled calculation of densities of marker-positive T cells. Spatial distribution of CD8+ T cells was categorized according to (1) CD8+ T cell-poor (with <10% of all nucleated cells being CD8+ T cells); (2) CD8+ T cell-rich (low, medium and high with 10%–29%, 30%–60%, and >60% of cells being CD8+ T cells, respectively); and (3) CD8+ T cell-excluded (with >10% of cells being CD8+ T cells and >90% of these CD8+ T cells at tumor border). See figure 1C for representative IHC sections that reflect the different spatial distribution patterns and scores. Spatial distributions of CD8+ T cells according to the aforementioned categories were assessed independently by two authors (YK and RW) with high concordance (86.5%). All non-concordant slides were discussed, and when not resolved, a third author re-evaluated and categorized the slide.
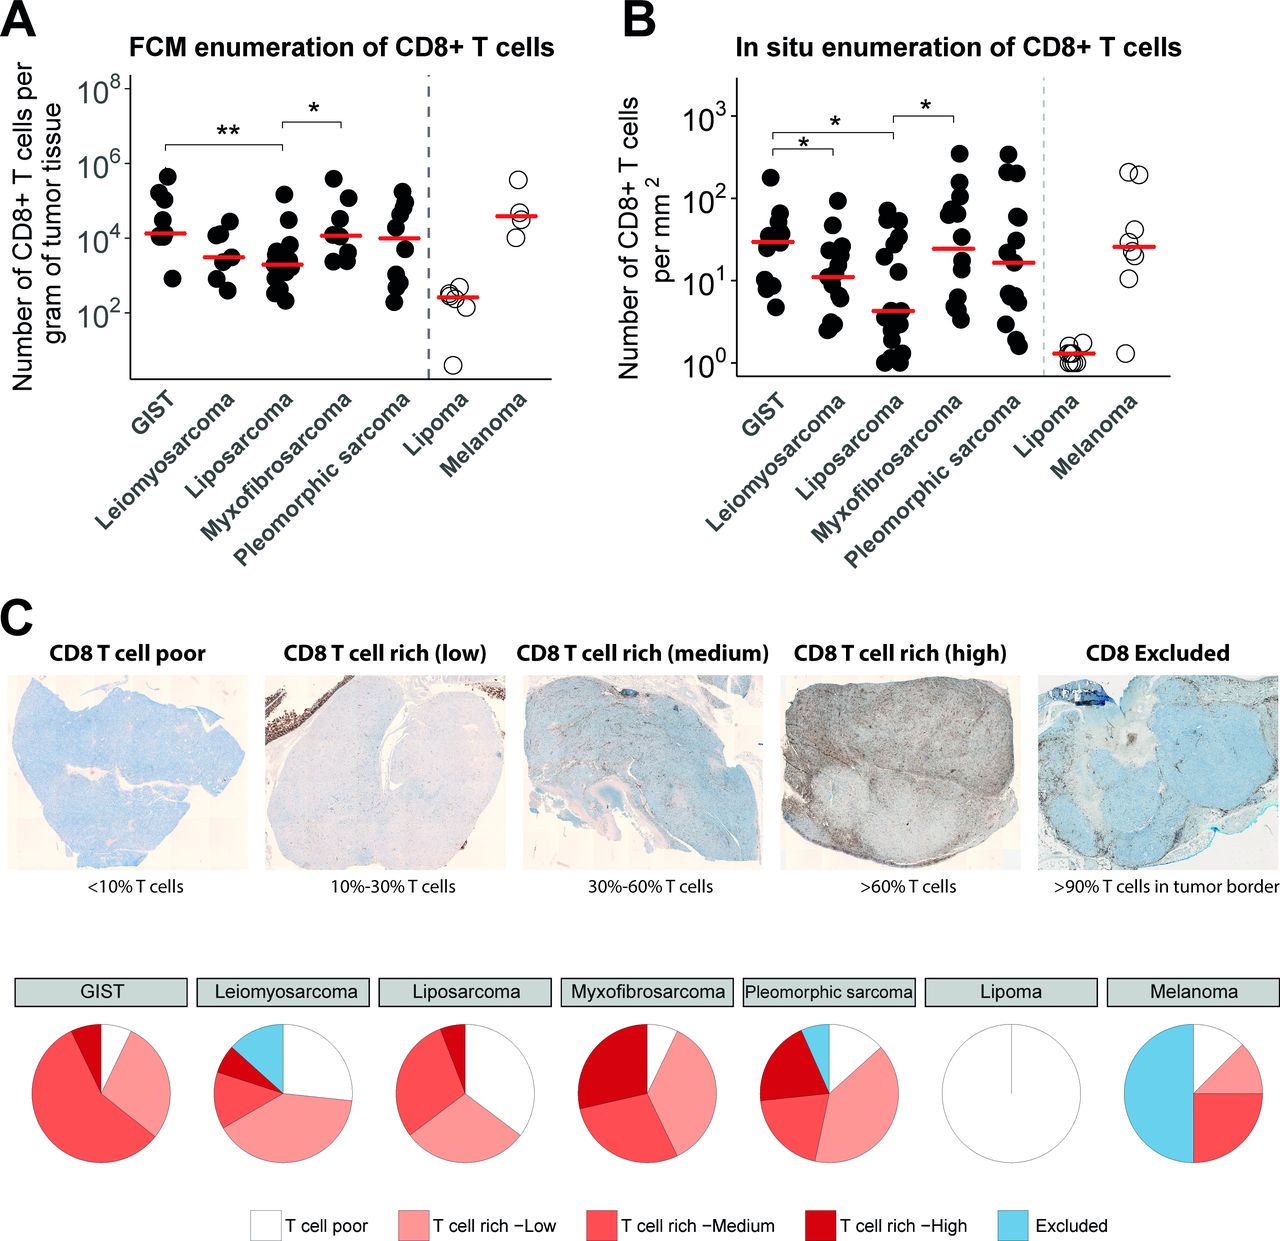
(A) Absolute numbers of CD8+ T cells per gram of tumor tissue assessed by FCM after tissue dissociation of surgical specimen of GIST (n=9), leiomyosarcoma (n=7), liposarcoma (n=12), myxofibrosarcoma (n=8), pleomorphic sarcoma (n=9), lipoma (n=5) and melanoma (n=4). Individual (symbols) and median (horizontal lines) observations are shown, Kruskal-Wallis test: p = 0.049. (B) Quantification of CD8+ T cells in IHC stainings per square millimetre in formalin-fixed and paraffin-embedded tissue sections of different STS subtypes (n=15 specimen per STS subtype), Kruskal-Wallis test: p = 0.038. (C) Upper panel, representative IHC stainings of different categories of CD8+ T-cell distributions (brightfield whole slide images; see Materials and methods section for details); lower panel: pie charts displaying the frequencies of the different categories of T-cell distributions for the different STS subtypes. *, represents p value of <0.05 according to the Mann-Whitney U test. **, represents p value of <0.01 and ***, represents p value of <0.001. FCM, flow cytometry; GIST, gastrointestinal stromal tumor; IHC, immunohistochemistry; STS, soft tissue sarcoma.
In silico analyses
Relative frequencies of immune cell populations
Affymetrix U133A data were collected from the Gene Expression Omnibus (GEO) (http://www.ncbi.nlm.nih.gov/geo/) entries GSE17743 and GSE71121. The numbers of samples per STS subtype are displayed in online supplementary table 2. Raw.cel files were processed using Return Material Authorisation (RMA) normalization (per entry), and subsequently uploaded and analyzed with the CIBERSORT algorithm with permutations set at 100 (https://cibersort.stanford.edu/).30 From CIBERSORT output, only samples with a significant threshold for deconvolution of the immune cell populations were selected (p<0.05 in 257 out of 295 samples).
Differential gene expression
RNAseq data were gathered from the GEO entry GSE71121. The number of samples per STS subtype is again displayed in online supplementary table 2. Raw FASTQ files were aligned with STAR31 using reference genome GRCh38, and gene expression read counts were processed in R. Genes with lower than 0.5 read counts per million in at least 15 patient samples were excluded from analysis. The Limma package32 33 with Voom transformation (with trend) was used to estimate the mean–variance relationship of log counts, and the Limma empirical Bayes analysis pipeline was used to compute differential expression of selected sets of immune-related genes among STS subtypes.
Mutational load
Whole exome sequencing (WES) data were obtained from The Cancer Genome Atlas (TCGA) and downloaded from the GDAC Firebrowse website as ‘level 4’ data. Mutational load was determined by the sum of synonymous and non-synonymous mutations per Mb DNA. Since GIST samples are not present in TCGA, publicly available raw WES data from the Sequence Research Archive (https://www.ncbi.nlm.nih.gov/sra), entry SRP042250 (FASTQ files, paired tumor and blood samples), were downloaded and subsequently analyzed by the TCGA DNAseq Variant calling pipeline to determine the mutational load (https://docs.gdc.cancer.gov/Data/Bioinformatics_Pipelines/DNA_Seq_Variant_Calling_Pipeline/).
TCR clonality
MiXCR software (https://mixcr.readthedocs.io/en/latest/quickstart.html) was used to analyze TCR-Vβ diversity.34 RNAseq FASTQ files (GSE71121) were used to determine number of different TCR-Vβ sequences.
Statistical analysis
Statistical tests were performed in R. Significant differences between continuous variables of two groups were tested with the Mann-Whitney U test. Significant differences between continuous variables of three or more groups were tested with the Kruskall-Wallis test. Results were considered significant when p<0.05.
Results
GIST, myxofibrosarcoma and pleomorphic sarcoma have high numbers and ‘T cell-rich’ distributions of CD8+ T cells
Tumor specimens from STS subtypes were analyzed by FCM as well as in IHC to quantify intratumoral T cells. FCM analyses revealed considerable variation in numbers of CD8+ T cells per gram of tissue across STS subtypes, but these quantities were nonetheless significantly higher in GIST and myxofibrosarcoma when compared with liposarcoma, but not when compared with leiomyosarcoma and pleomorphic sarcoma (figure 1A). T-cell enumeration in lipoma (considered benign and relatively non-immunogenic) and melanoma (considered immunogenic) revealed very low (almost absent) and high numbers of T cells per gram of tissue, respectively. Numbers of intratumoral T cells in melanoma were comparable to those in GIST and myxofibrosarcoma. Quantification of IHC stainings showed similar heterogeneity in numbers of CD8+ T cells per square millimetre of tissue across STS subtypes, and again higher numbers were observed in GIST and myxofibrosarcoma when compared with liposarcoma (figure 1B).
Next, we assessed the spatial distribution of CD8+ T cells within STS subtypes, which were categorized according to CD8+ T cell-poor; CD8+ T cell-excluded and different extents of CD8+ T cell-rich (for details, see the Materials and methods section). Representative IHC stainings of these different CD8+ T-cell distribution patterns are shown in figure 1C (upper panel), and frequencies of these patterns per STS subtypes are summarized in figure 1C (lower panel). About one-third of leiomyosarcoma and liposarcoma tumors demonstrated the ‘CD8+ T cell-poor’ phenotype (27% and 35%, respectively), whereas only about one-tenth of GIST, myxofibrosarcoma and pleomorphic sarcoma demonstrated lack of CD8+ T cells (7%, 7% and 13%, respectively). Though myxofibrosarcoma, pleomorphic sarcoma and GIST showed the highest percentages of the CD8+ T cell rich phenotype, myxofibrosarcoma and pleomorphic sarcomas had higher fractions of CD8+ T cells compared with GIST (29%, 20% and 7%, respectively). Nonetheless, GIST had the highest medium fraction (57%) of the CD8+ T cell-rich phenotype. Melanomas showed the highest fraction (50%) of the CD8+ T cell-excluded phenotype compared with all other STS subtypes, and lipoma only displayed the CD8+ T cell-poor phenotype.
GIST and liposarcoma-derived T cells show less differentiation and expression of coinhibitory receptors compared with other STS subtypes
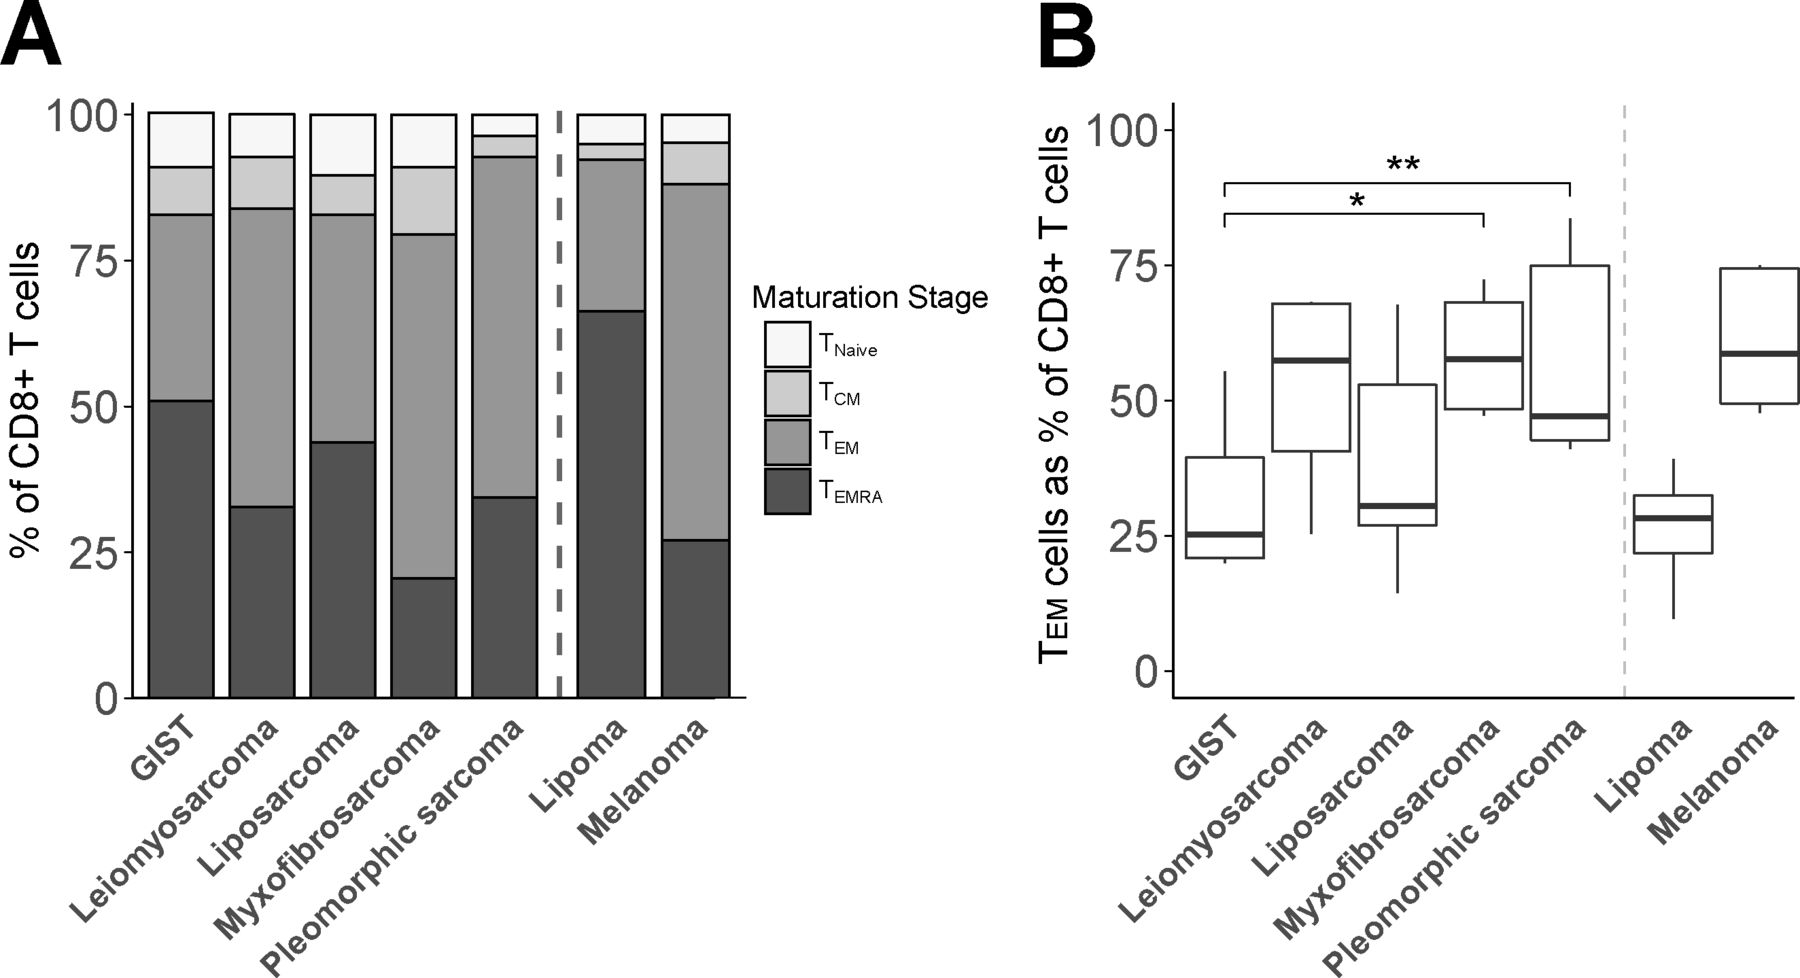
To assess the activation/differentiation status of CD8+ TILs, we measured the expression of T-cell differentiation markers as well as coinhibitory receptors by FCM. With respect to T-cell differentiation, we observed that leiomyosarcoma, myxofibrosarcoma and pleomorphic sarcoma showed the highest fractions of TEM and CD45RA+effector memory (TEMRA) cells (figure 2A). In contrast, GIST showed the lowest fraction of TEM cells within CD8+ TIL, being significantly different from myxofibrosarcoma and pleomorphic sarcoma (figure 2B). Fractions of TEMRA within CD8 +TILs were reciprocally related to those of TEM.

Flow cytometry analysis of maturation stages of CD8+ T cells in different soft tissue sarcoma subtypes using the following definitions: naïve (CCR7+/CD45RA+, TN), central memory (CCR7+/CD45RA−, TCM), effector memory (CCR7−/CD45RA−, TEM), and effector memory expressing CD45RA T cells (CCR7−/CD45RA+, TEMRA). (A) Cumulative maturation stages in CD8+ T cells; (B) TEM cells as percentage of CD8+ T cells. Included in analysis of (A) and (B): GIST (n=8), leiomyosarcoma (n=6), liposarcoma (n=10), myxofibrosarcoma (n=8), pleomorphic sarcoma (n=9), lipoma (n=3) and melanoma (n=4). *, represents p value of <0.05 according to the Mann-Whitney U test. GIST, gastrointestinal stromal tumor; TCM, central memory T cell; TEM, effector memory T cell; TEMRA, effector memory expressing CD45RA T cells; TN, naïve T cell.
With respect to T cell coinhibitory receptors, we observed that PD1 was expressed by the majority of CD8+ TILs (figure 3A). Interestingly, myxofibrosarcoma and pleomorphic sarcoma showed the highest fractions of PD1 +T cells, whereas GIST displayed the lowest fractions of PD1+ T cells among STS subtypes. Also, fractions of TIM3+, but not LAG3+ T cells, were higher in myxofibrosarcoma and pleomorphic sarcoma compared with GIST and liposarcoma. Regarding coexpression of PD1, LAG3 and TIM3, only a relatively small fraction of CD8+ TILs displayed all three coinhibitory receptors (figure 3B). We observed that TIM3 was mostly coexpressed with PD1, or with PD1 and LAG3, whereas LAG3 was mostly coexpressed with PD1. In fact, TIM3 or LAG3 was hardly coexpressed by PD1-negative CD8+ TIL. Although patterns in (co-)expression of coinhibitory receptors were not specific for particular STS subtypes, it was notable that from all STS subtypes, GIST demonstrated the lowest fraction of PD1+LAG3+TIM3+CD8+TIL. Pleomorphic sarcoma had the highest fraction of PD1+LAG3+TIM3+CD8+TIL, being comparable to melanoma.
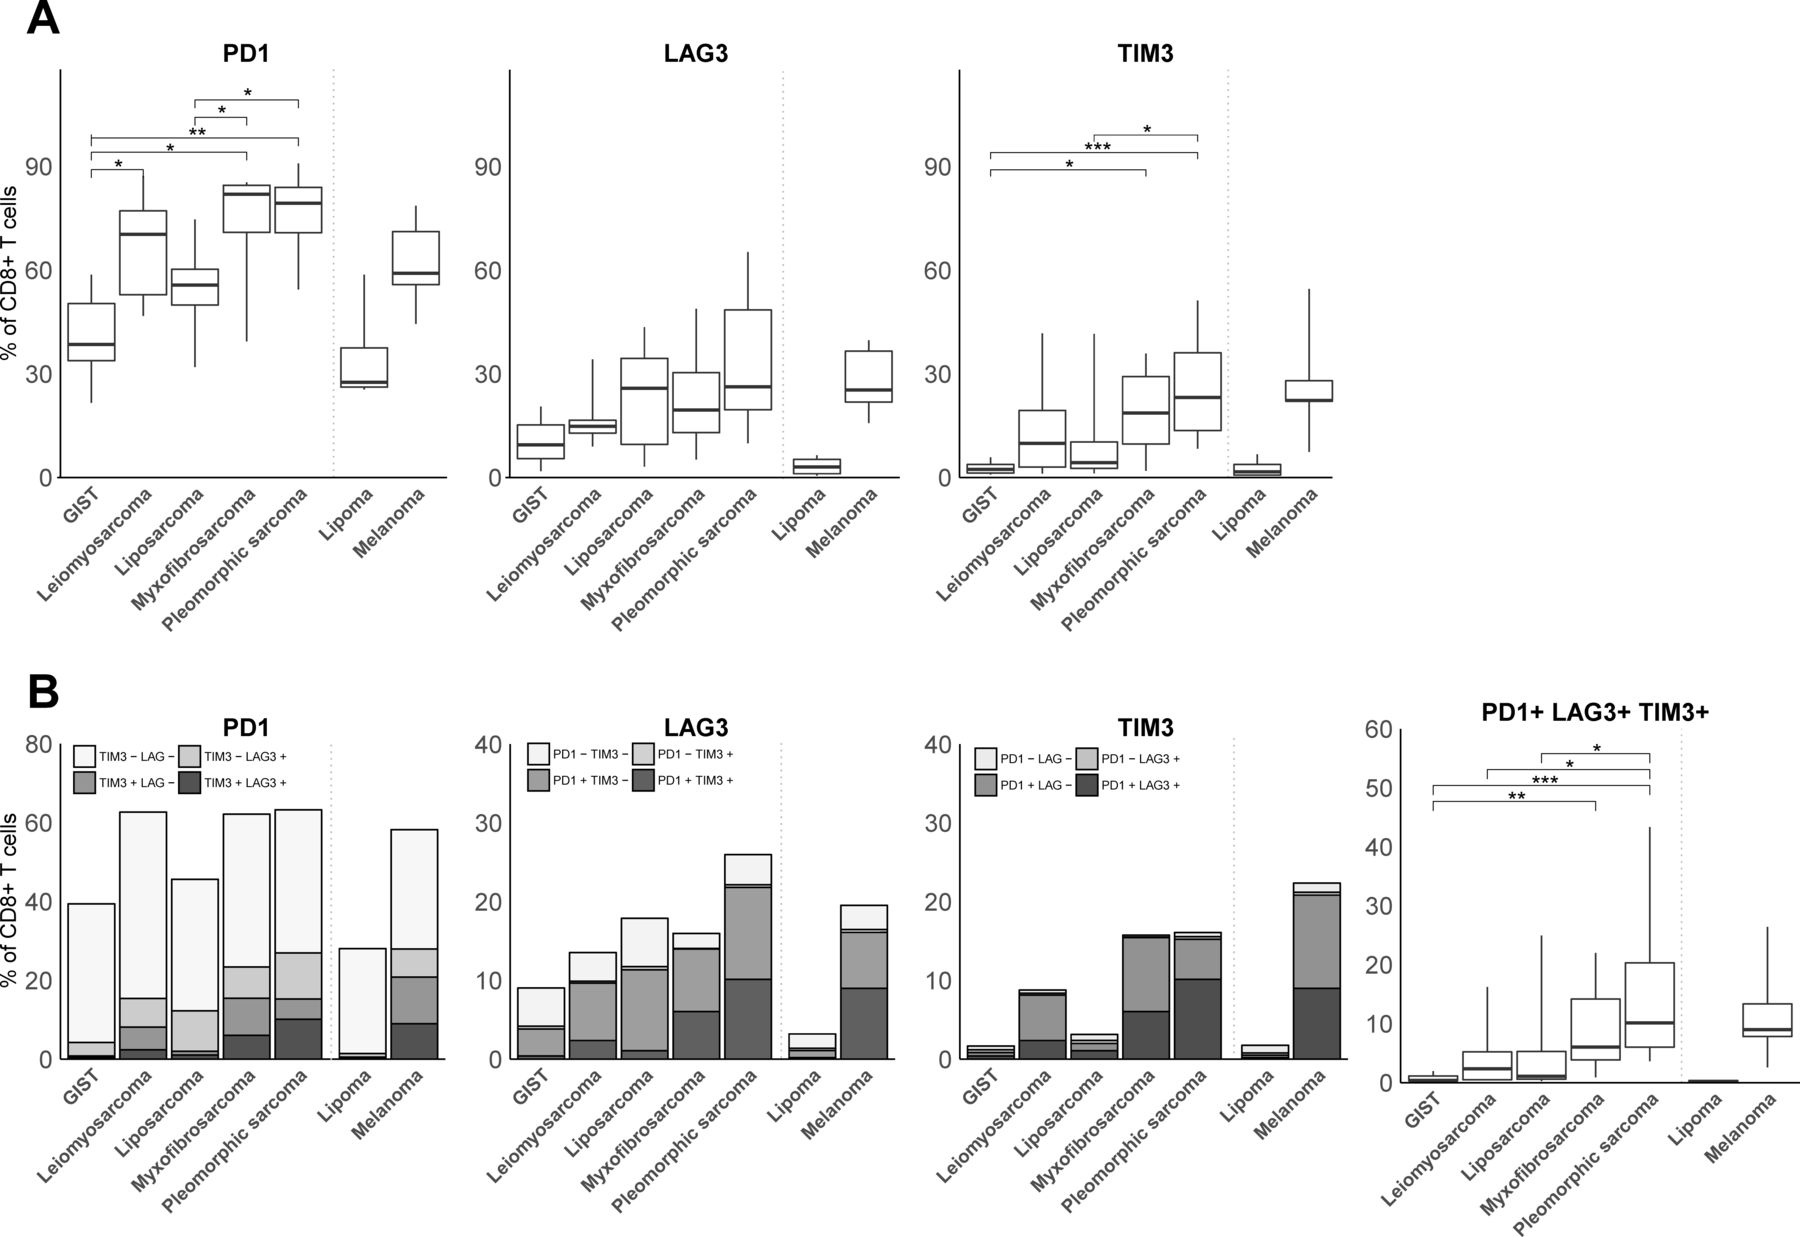
(A) FCM analysis of fractions of PD1, LAG3, and TIM3-expressing CD8+ T cells in different STS subtypes represented by box and whisker plots. (B) FCM analysis of fractions of CD8+ T cells co-expressing PD1, LAG3 and/or TIM3 in different STS subtypes. FCM analysis was only performed on samples with at least 200 CD8+ T cells and included GIST (n=8), leiomyosarcoma (n=6), liposarcoma (n=10), myxofibrosarcoma (n=8), pleomorphic sarcoma (n=9), lipoma (n=3) and melanoma (n=4). *, represents p value of <0.05 according to the Mann-Whitney U test. **, represents p value of <0.01 and ***, represents p value of <0.001. FCM, flow cytometry; GIST, gastrointestinal stromal tumor; STS, soft tissue sarcoma.
GIST and liposarcoma show lower fractions of dominant T-cell clones compared to other STS subtypes
To assess whether numbers of intratumoral CD8+ T cells and levels of T-cell activation in STS subtypes correspond to a changed TCR repertoire diversity and antigen load, we interrogated publicly available next-generation sequencing (NGS) data. First, using the MiXCR tool,34 we have determined the number of unique TCR-Vβ sequences (a measure of different T-cell clones) and observed a high level of variability across STS subtypes (figure 4A), with some subtypes having less than 10 and others having more than 1000 different T-cell clones. Although the number of GIST samples are low, we observed a trend toward a higher diversity in the TCR repertoire in GIST when compared with other STS subtypes. When analyzing the frequency of the 10 most dominant T-cell clones, GIST and liposarcoma had the lowest fractions of these clones when compared with leiomyosarcoma, myxofibrosarcoma and pleomorphic sarcoma. Moreover, the most dominant T-cell clone in GIST was present at a much lower frequency compared with the most dominant T cell clone in any of the other STS subtypes (figure 4B).

(A) Number of unique T-cell receptor-V sequences in STS subtypes determined by MiXCR RNAseq analysis of publicly available data (see Materials and methods section for details) and displayed as box and whisker plots. (B) Mean fraction of the 10 most dominant T-cell clones of all T-cell clones with circles representing individual T-cell clones. Dots align the T-cell clones according to dominance among the different STS subtypes. *, represents p value of <0.05 according to Wilcoxon test. GIST, gastrointestinal stromal tumor; STS, soft tissue sarcoma.
Collectively, investigations of intratumoral CD8+ T cells in STS subtypes demonstrated that GIST, myxofibrosarcoma and pleomorphic sarcoma have relatively high numbers of CD8+ T cells. GIST and liposarcoma harbor low fractions of CD8+ TEM cells, and low fractions of CD8+ T cells expressing PD1 or coexpressing PD1 and TIM3 when compared with myxofibrosarcoma and pleomorphic sarcoma. This phenotype suggests that there is a low level of CD8+ T-cell activation that is accompanied by a low abundance of dominant T-cell clones in GIST and liposarcoma compared with other STS subtypes. These findings are schematically represented in online supplementary figure S4A.
In addition to our analyses of intratumoral CD8+ T cells, we also investigated the immune microenvironment of STS subtypes. To this end, we used NGS data and first assessed tumor mutational burden and expression of genes involved in antigen processing and presentation. Analysis of mutational load, as a surrogate marker for neoantigens, demonstrated differences among STS subtypes (figure 5). In general, the mutational load is low in STS, yet myxofibrosarcoma and pleomorphic sarcoma had the highest mutational load, which was significantly higher than that of leiomyosarcoma and liposarcoma.
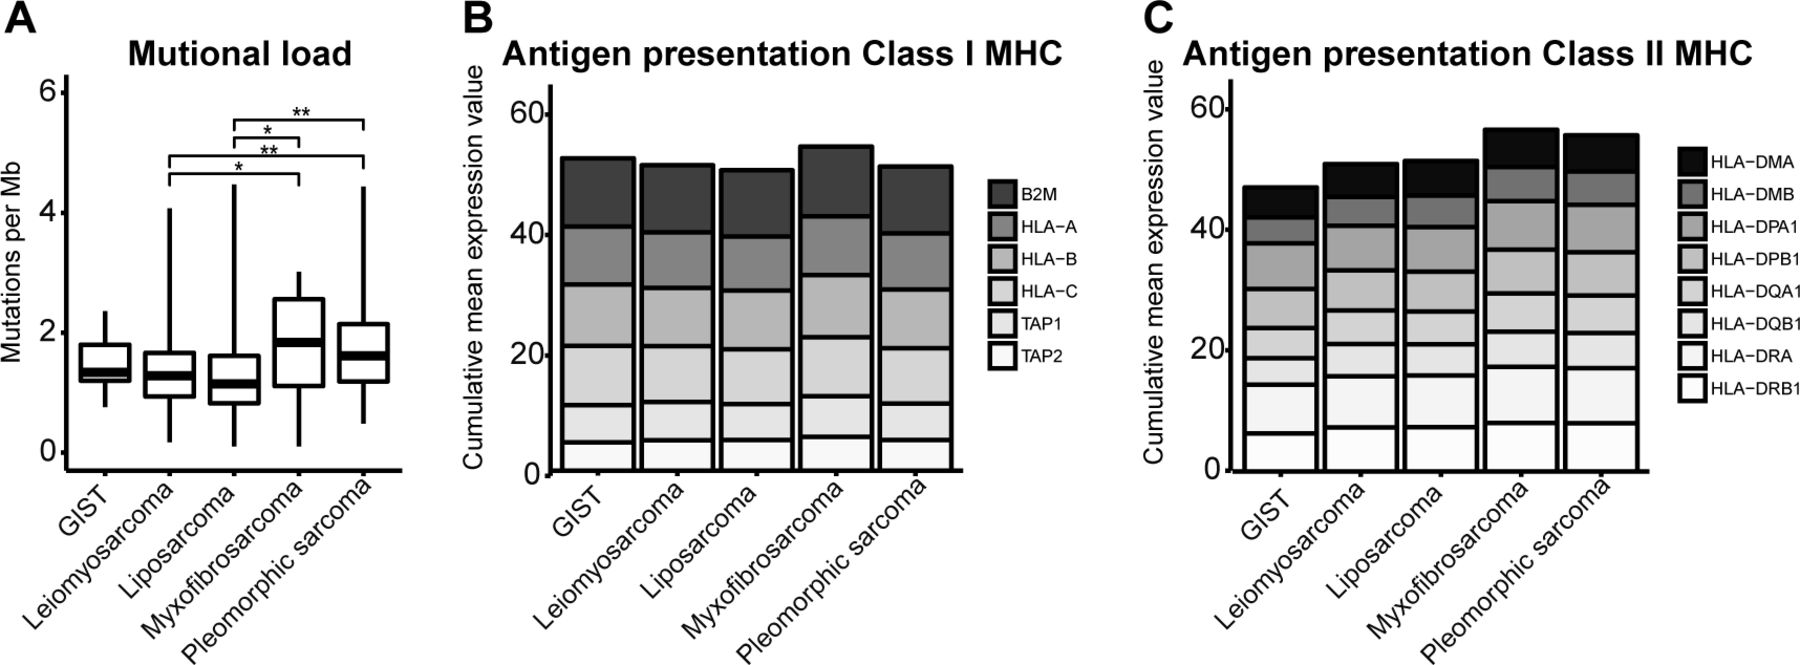
(A) Mutational load in different soft tissue sarcoma subtypes defined as mutations per Mb DNA according to publicly available next-generation sequencing data and displayed as box and whisker plots. (B) Expression level of genes involved in MHC class I antigen processing and presentation. (C) Expression level of genes involved in MHC class II antigen presentation. *, represents p value of <0.05 according to the Mann-Whitney U test. GIST, gastrointestinal stromal tumor; MHC, major histocompatibility complex.
Next, we analyzed the expression of genes involved in antigen processing and presentation via MHC class I (figure 5B) and did not find significant differences between STS subtypes with respect to β2-microglobulin, HLA-A, HLA-B, HLA-C, and transporter associated with antigen processing 1 and 2. Also, the expression of genes involved in MHC class II (HLA-DMB, HLA-DPA1, HLA-DPB1, HLA-DQB1, and HLA−DRB1) did not differ among STS subtypes (figure 5C). Although the expression of some single genes did differ between STS subtypes, the difference in expression was always less than twofold.
GIST shows differential presence of immune suppressor cells and decreased expression of T-cell costimulatory ligands compared with other STS subtypes
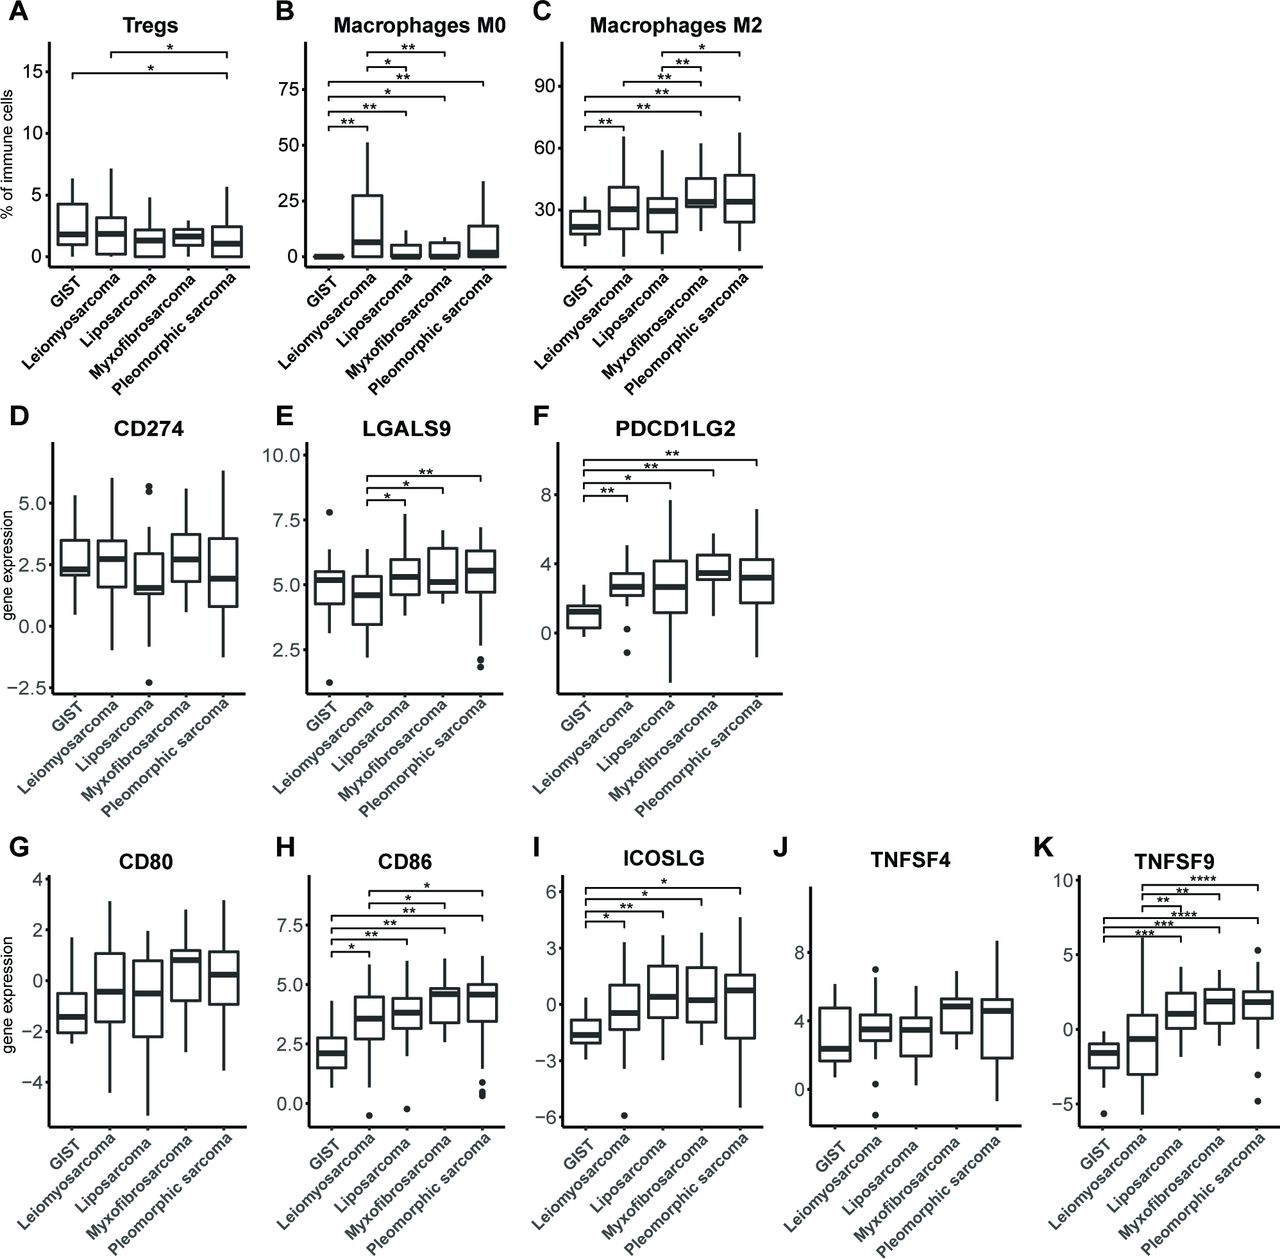
Besides measures of tumor immunogenicity, we also examined parameters of local T-cell suppression, such as the presence of immune suppressor cells or T-cell costimulatory or inhibitory ligands. To determine the relative frequencies of various immune cell types, gene expression data of 257 different STS tissues were analyzed with the CIBERSORT algorithm30 (figure 6A–C). With respect to regulatory T cells (Tregs), we observed that pleomorphic sarcoma has a significantly lower fraction of these suppressor T cells compared with GIST and leiomyosarcoma. The fraction of undifferentiated macrophages (M0), which may represent myeloid-derived suppressor cells (MDSC), was observed to be significantly lower (almost absent) in GIST compared with all other subtypes, and in leiomyosarcoma compared with liposarcoma and myxofibrosarcoma. The fraction of immune-suppressive M2 macrophages was observed to be higher in myxofibrosarcoma and pleomorphic sarcoma compared with all other STS subtypes, and GIST showed the lowest fraction of M2 macrophages among all STS subtypes.

Fractions of immune cell subtypes (A) regulatory T cells, (B) M0 macrophages and (C) M2 macrophages in different STS subtypes as determined by CIBERSORT algorithm according to publicly available RNA data. RNA expression of (D) PDL1 (CD274), (E) Galectin-9 (LGALS9) and (F) PDL2 (PDCD1LG2), in different STS subtypes according to publicly available data and displayed as box and whisker plots. RNA expression of (G) CD80, (H) CD86, (I) ICOS ligand, (J) OX40 ligand (TNFSF4), and (K) 4-1BB ligand (TNFSF9) in different STS subtypes according to publicly available data and displayed as box and whisker plots. The number of analyzed tumors per STS subtype is described in the Materials and methods section. *, represents p value of <0.05 according to the Mann-Whitney U test. GIST, gastrointestinal stromal tumor; STS, soft tissue sarcoma.
Analysis of T-cell coinhibitory ligands revealed that among selected STS subtypes, GIST has the lowest expression of PDL2, but not PDL1 (figure 6D–F). Ligands for LAG3, MHC class II molecules, were already assessed, and these did not differ among STS subtypes (figure 5C). The ligand for TIM3, galectin-9, showed a lowered expression in leiomyosarcoma when compared with liposarcoma, myxofibrosarcoma and pleomorphic sarcoma. Notably, when analyzing T-cell costimulatory ligands, we observed that CD86, but not CD80, had a lowered expression in GIST when compared with all other STS subtypes, and in leiomyosarcoma compared with pleomorphic sarcoma and myxofibrosarcoma (figure 6G–K). Also, the ICOS and the 4-1BB ligands had lowered expression in GIST, whereas for expression of the OX40 ligand, no significant differences were found between STS subtypes.
Collectively, the in silico analyses of the immune microenvironment of STS subtypes revealed that myxofibrosarcoma and pleomorphic sarcoma had a higher mutational burden compared with leiomyosarcoma and liposarcoma. When analyzing genes involved in antigen processing and presentation, we found no statistically significant differences among STS subtypes. Fractions of myeloid cells were lower in GIST compared with other STS subtypes. The expression level of the coinhibitory ligand PDL2 was low in GIST, and the expression level of galectin-9 was lowest in leiomyosarcoma and highest in myxofibrosarcoma and pleomorphic sarcoma. Notably, expression levels of the costimulatory ligands CD86, ICOSL, and 4-1BBL were all low in GIST compared with other STS subtypes. These findings are schematically represented in online supplementary figure S4B.
Discussion
In the current study, we have analyzed five STS subtypes, that is, GIST, myxofibrosarcoma, liposarcoma, pleomorphic sarcoma and leiomyosarcoma, for the quantity and quality of CD8+ TILs as well as immune parameters of the microenvironment using a combination of FCM, microscopy and in silico tools. Both FCM and IHC demonstrated that GIST, myxofibrosarcoma and pleomorphic sarcoma harbor the highest number of intratumoral T cells, comparable with those in melanoma. Our data regarding T-cell enumerations in different STS subtypes are endorsed by a recent study from Pollack and colleagues,35 in which T cells in STS subtypes were quantified using CD3D gene expression data, though GIST and myxofibrosarcoma samples were not considered. In another study, T-cell quantities in GIST were compared with other STS subtypes; however, T cells were presented as frequency of CD45+ cells and not as actual counts.36 Our IHC analyses, addressing T-cell localization within STS tumors, revealed that GIST, myxofibrosarcoma and pleomorphic sarcoma predominantly showed a CD8+ T cell-rich phenotype, featuring an evenly distribution of CD8+ T cells in tumor center and margin. It is noteworthy that FCM and IHC, although representing different technologies each with their own specifics to quantify CD8+ T-cell numbers, revealed a significant concordance with respect to outcomes. Timely multiplex staining technologies are expected to further enhance our understanding of T-cell shortcomings in the tumor microenvironments of STS subtypes.
When studying phenotypical measures reflecting CD8+ T-cell activation using FCM, we observed significantly lower fractions of CD8+ TEM in GIST but not in myxofibrosarcoma nor pleomorphic sarcoma, even though all three STS subtypes harbor equal numbers and similar spatial distributions of CD8+ T cells. In addition, GIST differed from myxofibrosarcoma and pleomorphic sarcoma by having the highest fraction of CD8+ TEMRA. CD8+ TEMRA cells are generally considered to be terminal effector cells; however, differentiation to this phenotype not only is necessarily the result of vigorous T cell receptor (TCR)-mediated stimulation, but also can be the result of excessive cytokine stimulation.37 38 Another recognized measure of T-cell activation through TCR stimulation39 is an increased expression of coinhibitory receptors.40 Again, GIST and also liposarcoma displayed lower fractions of PD1, LAG3 and especially TIM3-expressing CD8+ T cells when compared with myxofibrosarcoma and pleomorphic sarcoma. In fact, GIST demonstrated low numbers of PD1+LAG3+TIM3+CD8+ T cells, which are considered functionally compromised T cells,41 when compared with the latter two STS subtypes. Based on our phenotypical analyses of CD8+ TILs, we argue that in GIST, despite of high numbers of these T cells, there is limited TCR-driven T-cell activation. For CD4+ TILs, differences in maturation stages were not as outspoken as for CD8+ TILs. Fractions of coinhibitory receptor-expressing CD4+ T cells were lower compared with CD8+ T cells, especially for LAG3 and TIM3, the fractions of T cells were much lower and did not show any differences between STS subtypes (see online supplementary figures S2 and S3).
To further explore differences in TCR-mediated stimulation across STS subtypes, we examined the breadth and convergence of the TCR repertoire of TILs using in silico tools and publicly available NGS data. Analysis into the number of unique TCR-Vβ sequences demonstrated a high level of variation and revealed, when analyzing the 10 most abundant TCR-Vβ sequences, that GIST and liposarcoma had a significantly lower frequency of dominant T-cell clones compared with leiomyosarcoma, myxofibrosarcoma and pleomorphic sarcoma. This observation is particularly true for the single most dominant T-cell clone and is suggestive of a more polyclonal T-cell repertoire in GIST and liposarcoma, and a more oligoclonal T cell repertoire in myxofibrosarcoma and pleomorphic sarcoma, the latter finding being in agreement with a report by Pollack and colleagues.35 The mutational load of tumors, often considered a surrogate marker for neoantigens, has been associated with better responses to immune checkpoint therapy and adoptive T-cell therapy with TIL.42–44 Interestingly, reduced expression of genes encoding neoantigens was identified as a potential mediator of resistance to immune checkpoint therapy in leiomyosarcoma.45 Although it has been reported that STS subtypes differ with respect to genomic alterations,26 46 47 only few studies have assessed mutational load in STS subtypes in relation to number and phenotype of CD8+ TIL. The TCGA database has recently thoroughly interrogated mutational load in STS subtypes but did not include GIST in those analyses.26 In this study, we observed a generally low mutational load for all STS subtypes when compared with melanoma and other tumor types,48 yet a higher mutational load was found in myxofibrosarcoma and pleomorphic sarcoma when compared with liposarcoma. Even though sample numbers were relatively low and variable, we did observe a trend with respect to differences in mutational load among STS subtypes. Altered expression of genes involved in antigen processing and presentation has, besides mutational load, also been associated with therapy resistance to checkpoint therapy.49 Our analyses revealed no differential gene expression of components of MHC class I and II processing and presentation pathways among different STS subtypes. Others did report differences in expression of such genes, yet most of these differences were found between synovial sarcoma (not included in present study) and other subtypes.35
Lastly, we have assessed parameters that affect CD8+ T-cell function, such as the presence of immune-suppressive cells and expression of cosignaling ligands. Our analyses did not reveal significantly higher fractions of Tregs, M0, and M2 macrophages in GIST when compared with the other CD8+ T cell-rich STS subtypes, such as myxofibrosarcoma and pleomorphic sarcoma. In contrast, fractions of myeloid cells appeared significantly decreased in GIST when compared with the other STS subtypes. This suggests that it is unlikely that suppressive myeloid cells, such as MDSC cells, contribute to the lack of T-cell activation as observed in GIST. Others observed limited efficacy of anti-PD-1 in STS subtypes, which may be related to significant numbers of intratumoral macrophages expressing the metabolic checkpoint indoleamine 2,3-dioxygenase 1 (IDO1).50 Even though we did not find significant differences in IDO1 or IDO2 gene expression between STS samples (data not shown), we cannot exclude that macrophage-derived IDO1 may provide a druggable target, particularly for non-GIST STS subtypes.
With respect to the coinhibitory ligands, GIST showed a lowered expression of PDL2, but not PDL1, when compared with other STS subtypes. Previous studies in head and neck squamous cell cancer treated with pembrolizumab showed longer progression free survival and overall survival of patients in case tumors were PDL2-positive but not PDL2-negative.51 PDL2 expression is regulated by both IFN-β and IFN-γ,52 and a lowered expression of PDL2 in GIST is suggestive for a lowered IFN-I signature, potentially reflecting the lower level of T-cell activation found in this study. With respect to the costimulatory ligands, we found clearly lowered expression for ligands of CD28 (CD86), ICOS (ICOSL) and 4-1BB (41BBL, TNFRSF9). These ligands are generally expressed by innate immune cells, such as dendritic cells and macrophages, but also by tumor cells, and fulfill critical roles in T-cell activation, although the exact role in cancer immune therapy is not yet clarified.53 CD86 expression has been reported to be significantly higher in pleomorphic sarcoma compared with liposarcoma; however, GIST and myxofibrosarcoma were not included in this analysis.35 To the best of our knowledge, this is the first study that investigated the expression of a large series of cosignaling ligands in GIST and demonstrated a profoundly lowered level of expression of PDL2, CD86, ICOSL and 41BBL in this STS subtype. The mechanism underlying a lowered expression of these ligands in GIST requires further studies but may be linked to KIT oncogene activity and its diminishing effect on DC recruitment into tumor tissues.54 We would like to argue that a lowered expression of costimulatory ligands in GIST, but no signs of a lowered antigenicity, may be at the basis for lesser CD8+ T-cell activation. In line with this reasoning, we have observed significantly lowered fractions of CD137+CD8+ T cells in GIST compared with other STS subtypes (measured by FCM, data not shown).
Our study has several limitations, such as relatively small numbers of tumor specimen; gene expression analysis only included dedifferentiated liposarcoma, while our FCM analysis included dedifferentiated/well-differentiated, as well as myxoid liposarcoma; and some patients from whom GIST was collected and used in FCM analysis were treated with imatinib (n=5 out of 9). It is noteworthy that we found no significant differences between imatinib-treated and untreated tumors in any of the parameters analyzed. Another study reported that GIST from imatinib-treated patients presented with higher fractions of PD1+CD8+ T cells compared with untreated patients.55 Despite this possible treatment effect, the fraction of PD1+CD8+ T cells in our study were still lower in GIST versus leiomyosarcoma, myxofibrosarcoma and pleomorphic sarcoma. We cannot exclude that the grade of GIST, which was not included in this analysis, may have affected the immunological parameters as described in this study.22 Notwithstanding the aforementioned shortcomings, this study provides an unprecedented and in-depth analysis of multiple STS subtypes with respect to CD8+ TILs and immune microenvironments and argues for validation of our main findings in larger cohorts of selected STS subtypes.
In conclusion, the quantity and quality of CD8+ T cells, as well as parameters of immune microenvironments, are clearly different among STS subtypes (summarized in online supplementary figure S4). Building on these data, we speculate that myxofibrosarcoma and pleomorphic sarcoma are amenable for checkpoint inhibitors. Since checkpoint inhibitors are primarily effective in CD8+ T cell-rich tumors,21 56 57 not all myxofibrosarcoma and pleomorphic sarcomas are expected to equally benefit from checkpoint inhibitors, providing a rationale to further stratify patient tumors according to immune parameters. For tumors that are less rich in CD8+ T cells and/or antigenic, other therapeutic options may be required (eg, radiotherapy or chemotherapy) to sensitize tumors prior to checkpoint inhibitors or adoptive T-cell therapy. Notably, with respect to GIST, we speculate that treatment with costimulatory agonistic antibodies may result in such tumor sensitization.
References
Footnotes
Correction notice This paper has been corrected since it was published online. The author name Cornelis Verhoef was incorrectly spelt as Kees Verhoef.
Contributors YK: designed the research studies, conducted the experiments, acquired the data, analyzed the data, and wrote the manuscript; MR: designed the research studies, conducted the experiments, and acquired the data; AO: conducted the experiments and acquired the data; RW: acquired and analyzed the data; MS: analyzed the data; DG and KV: designed the research studies, acquired the data, and provided the reagents; SS, CL, and RD: designed the research studies and wrote the manuscript.
Funding Study was funded by the department of Medical Oncology, Erasmus MC, Rotterdam.
Competing interests None declared.
Patient consent for publication Not required.
Ethics approval The study protocol has been approved by the institutional medical ethical review board (MEC-2012–436).
Provenance and peer review Not commissioned; externally peer reviewed.
Data availability statement Data are available in a public, open access repository. Data are available upon reasonable request. Affymetrix U133A data were collected from the Gene Expression Omnibus (GEO) (http://www.ncbi.nlm.nih.gov/geo/) entries GSE17743 and GSE71121. RNAseq data were gathered from the GEO entry GSE71121. Whole exome sequencing data were obtained from The Cancer Genome Atlas and downloaded from the GDAC Firebrowse website as 'level 4' data. Publicly available raw WES data from the Sequence Research Archive (https://www.ncbi.nlm.nih.gov/sra), entry SRP042250.