Article Text

Abstract
Background Tumor-infiltrating lymphocytes have been reported as prognostic markers in tumors. We aimed to assess the prognostic value of total T cell (CD3+) density, cytotoxic T cell (CD8+) density and memory T cell (CD45RO+) density in patients with nasopharyngeal carcinoma (NPC).
Methods The expression of CD3, CD8 and CD45RO was detected by immunohistochemistry in the training (n=221) and validation cohorts (n=115). The densities of these three markers were quantified by digital pathology both in the tumor and stroma. Then, we developed the immune score based on the density of these three markers and further analyzed its prognostic value.
Results The high density of CD3+, CD8+ and CD45RO+ T cells both in the tumor and/or stroma were significantly associated with the decrease in mortality in the training cohort, respectively. High immune score predicted a prolonged overall survival (OS) (HR 0.34, 95% CI 0.18 to 0.64, p=0.001, disease-free survival (DFS) (HR 0.44, 95% CI 0.25 to 0.78, p=0.005) and distant metastasis-free survival (DMFS) (HR 0.43, 95% CI 0.21 to 0.87, p=0.018) in NPC patients. The findings were confirmed in the validation cohort. Multivariate analysis revealed that immune score remained an independent prognostic indicator for OS, DFS and DMFS. In addition, we established a nomogram with the integration of all independent variables to predict individual risk of death.
Conclusions We established an immune score model, which provides a reliable estimate of the risk of death, disease progress and distant metastasis in NPC patients.
- immunology
- oncology
- histopathology
This is an open access article distributed in accordance with the Creative Commons Attribution Non Commercial (CC BY-NC 4.0) license, which permits others to distribute, remix, adapt, build upon this work non-commercially, and license their derivative works on different terms, provided the original work is properly cited, appropriate credit is given, any changes made indicated, and the use is non-commercial. See http://creativecommons.org/licenses/by-nc/4.0/.
Statistics from Altmetric.com
Background
Nasopharyngeal carcinoma (NPC) is a unique head and neck cancer with high prevalence rates in southern China, Southeast Asia, North Africa, the Middle East and Alaska.1 Currently, tumor, node and metastasis (TNM) staging is the main tool in determining treatment strategy and assessment of prognosis. However, this anatomy-based system provides useful but unsatisfactory prognostic information, because NPC patients with the same TNM stage receive similar treatment, their clinical outcomes vary widely.2 Important studies have found heavy infiltration of immune cells in the tumor microenvironment, and high expression of PD-L1 by both tumor and immune cells.3–5 This indicates that immune factors might play an important role in the development of NPC. In addition, the prognostic value of a variety of immune cells has been evaluated in many cancers.6–8 However, few studies assessing the prognostic value of immune cell density and distribution patterns in the tumor microenvironment in patients with NPC have been performed.
The tumor-immune microenvironment is complicated with infiltration of both inflammatory and lymphocytic cells. These cell types include macrophages, dendritic cells, mast cells, natural killer cells, naive and memory lymphocytes, B cells, and effector T cells (including various subsets of T cell). The latter include T helper cells, regulatory T cells, T follicular helper cells and cytotoxic T cells.6 Of these, high densities of CD3+ T cells, CD8+ cytotoxic T cells and CD45RO+ memory T cells have been shown to be associated with longer overall survival (OS) and disease-free survival (DFS) in gastric, liver, lung and colorectal cancer.8–12 Furthermore, immunoscore integrates CD3+, CD8+, and CD45RO+ cells, which is positively associated with clinical outcomes.9 Therefore, there is benefit in evaluating the prognostic value of CD3+, CD8+, CD45RO+ cells and the immune score (IS) for NPC patents.
In this study, we evaluated the density of lymphocyte populations (CD3, CD8 and CD45RO) both in the tumor and stroma for NPC patients using digital pathology. In addition, IS including these three lymphocyte populations could classify NPC patients with different risk.
Methods
Clinical specimens
A total of 336 pretreatment, non-metastatic NPC specimens were obtained from two academic institutions in China. There were 221 specimens from the Sun Yat-sen University Cancer Center (Guangzhou) between January 2011 and December 2013 that were designated as the training cohort, while the 115 samples obtained at the Affiliated Hospital of Guilin Medical University (Guilin) between November 2006 and October 2012 were designated as the validation cohort. All patients were pathologically diagnosed with NPC and were restaged according to the eighth AJCC TNM staging system.13 All participants provided written informed consent prior to treatment. This study is reported according to the Reporting Recommendations for Tumor Marker Prognostic Studies criteria.14
Immunohistochemistry
Sequential histological tumor sections of 4 µm thick were obtained from a representative formalin-fixed, paraffin-embedded tumor block and used for immunohistochemistry (IHC) analysis. IHC staining was performed for: CD3+ total T cells, CD8+ cytotoxic T cells and CD45RO+ memory T cells. The following primary antibodies were used: anti-CD3 (ab16669, 1:800; Abcam, Cambridge, UK), anti-CD8 (ab4055, 1:800; Abcam), anti-CD45RO (clone UCHL1, 1:1600; Cell Signaling Technology, CST, Beverly, Massachusetts, USA). IHC was performed as previously described.15
Digital pathology
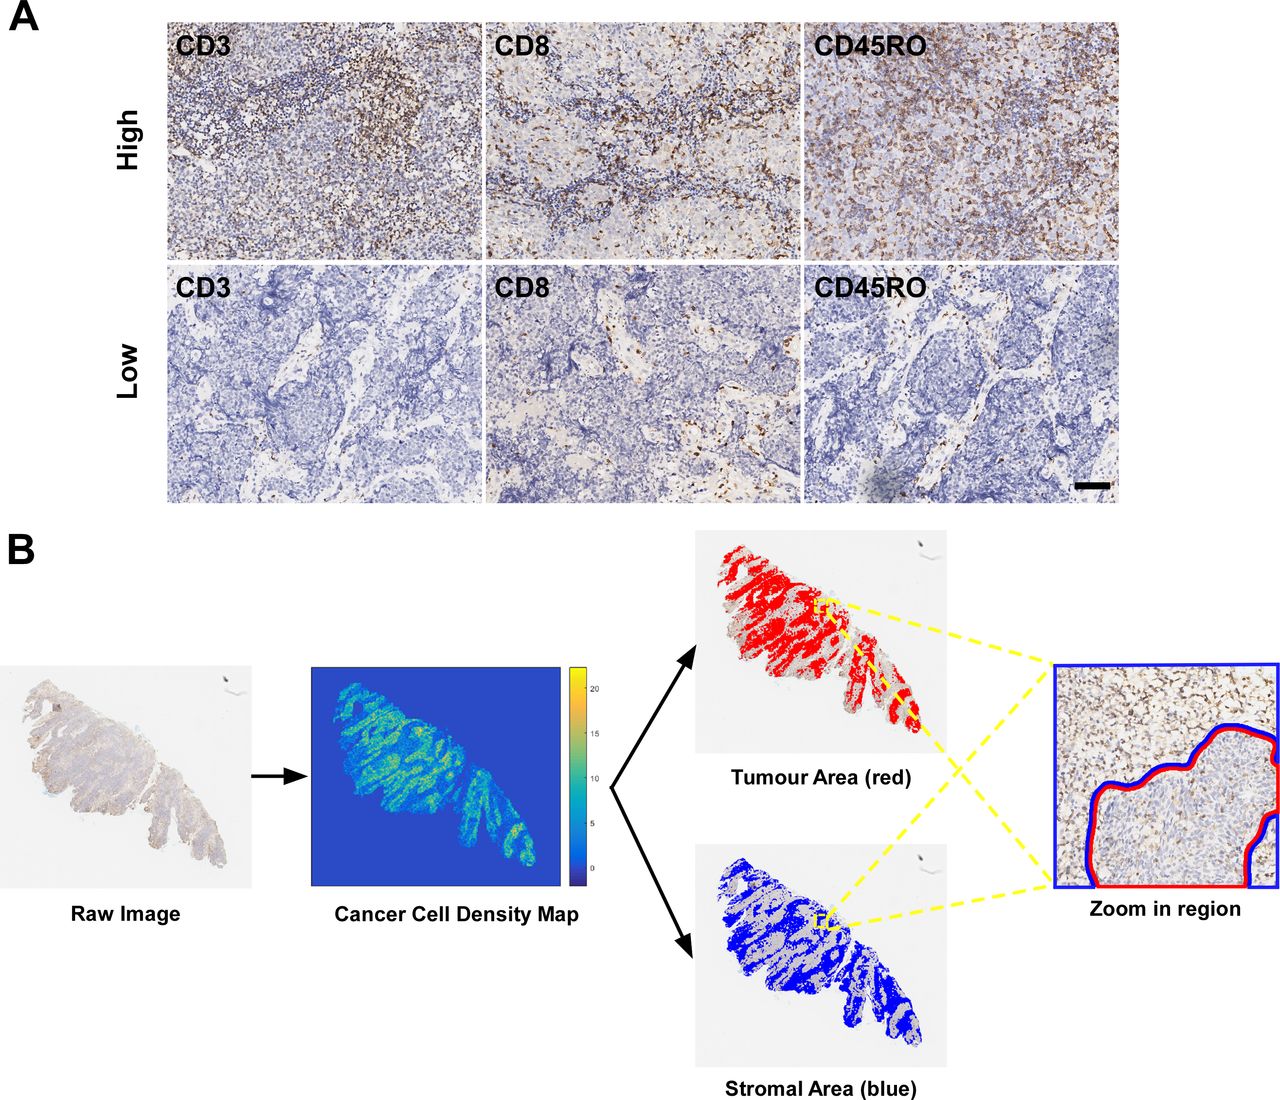
A full view of each IHC slide was digitally scanned using a ScanScope Aperio AT2 slide scanner (Leica Microsystems) at ×400 magnification. Representative images of IHC staining with high and low positive numbers for these markers are shown in figure 1A. All images were autoexamined using digital pathology.

Representative images of CD3, CD8 and CD45RO expression and digital pathology. (A) High and low expression of CD3+, CD8+ and CD45RO+ T cells; (B) The classification of tumor and stroma areas was based on tumor cell density map. The scale bar represents 100 µm.
First, all IHC slides were evaluated by pathologists, only slides with good staining quality would be included in further analysis. In addition, all normal tissue was excluded from the assessment through manual annotation by pathologists. Then, stain deconvolution was performed, each nucleus in the haematoxylin channel was segmented using a regional convolutional neural network, which showed good performance in our previous studies (online supplementary figure S1).16 17 All the nuclei in the slide were classified into tumor cells (TCs) or tumor-associated immune cells (TAICs) based on a deep learning method, which was developed based on the manual annotation of each nucleus as a TC or TAIC by two pathologists and achieved good performance.18 The computational algorithms showed a high reproducibility and consistency with pathological classification. TC density map was generated by counting the number of TCs in the blocks of 8 µm by 8 µm in size. Several thresholds from 1 to 5 were used on a small set of images and the above optimized threshold was chosen experimentally according to the visual examination of the identified tumor area by the pathologists. A density threshold of 2 was selected and the blocks with more TCs than the threshold were identified as tumor area. The remaining tissue areas were classified as stroma area (figure 1B). Finally, the positive number of TAICs for CD3, CD8 and CD45RO were quantified separately into tumor areas and stroma areas, and recorded in density per mm2 through evaluating the percentage of positive pixels in the ring area, which was defined as the area with a width of five pixels at the boundary of the nucleus mask (online supplementary figure S1). Detailed descriptions of the computational algorithms for nucleus segmentation, classification and quantification of positive cells are described in our previous study.17
Supplemental material
Immune Score
We used X-tile software (V.3.6.1; Yale University, New Haven, Connecticut, USA) to determine optimal cut-off values for high and low density regarding CD3, CD8 and CD45RO cells both in the tumor and stroma areas in the training cohort for OS.19 Based on the threshold, each patient was given a binary score (0 for low, 1 for high) for each immune cell type (CD3+, CD8+ and CD45RO+) both in the tumor and stroma. IS for each patient was obtained by adding the six binary score values; the scale being from 0 to 6. Seven patient groups were defined: patients with low densities of CD3+, CD8+ and CD45RO+ T cells in both tumor and stroma regions were classified as IS-0; patients with one high density region for one marker were classified as IS-1; and patients with two, three, four, five and six high density regions of these three markers were stratified as IS-2, IS-3, IS-4, IS-5 and IS-6, respectively. X-tile was used to generate the optimal cut-off values for the IS based on the associations with patient OS.19 Patients with a high degree of immune cell infiltration (3–6) were assigned as the high-infiltrating group, and patients with a low degree of immune cell infiltration (0–2) were assigned as the low-infiltrating group.
DNA extraction and real-time quantitative PCR
The plasmatic Epstein-Barr virus (EBV) DNA concentrations were routinely measured before treatment using quantitative PCR.20 A cut-off level of 2000 copies/mL was chosen to define low and high pretreatment EBV DNA levels.21 22
Statistical analyses
The primary endpoint of our study was OS, and secondary endpoints were DFS and distant metastasis-free survival (DMFS). OS was calculated from the first day of treatment to the date of death from any cause. DFS was calculated from the first day of treatment to the date of the first relapse at any site or death from any cause (whichever occurred first) and DMFS was estimated from the first day of treatment to the first distant relapse.
The associations between the IS and clinicopathological variables were analyzed using the χ2 test or Fisher’s exact test. The Kaplan-Meier method was used to estimate OS, DFS and DMFS and differences were compared using the log-rank test. HRs were calculated using univariate Cox regression analysis. Multivariate Cox regression analysis with backward selection was performed to test the independent significance of different factors. Significant variables (p≤0.1) were included in the multivariate analysis, and only independent prognostic factors were retained in the multivariate model. Moreover, nomograms predicting 3 years or 5 years OS were established based on independent variables. The concordance index (C-index) was used to evaluate the accuracy of the nomogram, and its calibration capacities was evaluated by the calibration plot. In addition, bootstraps with 1000 resamples were applied to these activities.
All statistical tests were two sided and considered significant when the p value was less than 0.05. Statistical analyzes were performed using SPSS, V.22.0 (IBM). The key raw data have been uploaded to Research Data Deposit public platform (www.researchdata.org.cn), with an approval number of RDDA2019001317.
Results
Patient characteristics and infiltrating lymphocytes
We included 336 pretreatment, paraffin-embedded NPC specimens in our study. Table 1 shows the characteristics of the patients in the Guangzhou training cohort (n=221) and the Guilin external validation cohort (n=115).
Clinicopathological characteristics of the patients in the training and validation cohorts stratified by immune score
We investigated the numeration of lymphocyte populations for total T cells (CD3+), cytotoxic T cells (CD8+) and memory T cells (CD45RO+) both in the tumor and stroma per mm2. A wide spectrum of immune infiltrate densities in the tumor and stroma areas were revealed by slides stained with CD3, CD8 and CD45RO antibodies. Bivariate analysis showed significant association between the positive density of each marker in the tumor with positive density in the stroma. Besides, 153 of 172 (89.0%) NPC patients with high CD3+ density (either in the tumor or stroma) showed high CD8+ density, while only 24 of 49 (49.0%) NPC patients with low CD3+ density showed high CD8+ density (p<0.001). Similarly, CD3+ cell density and CD8+ cell density showed a positive correlation with CD45RO+ cell density (both p<0.001).
Prognostic value of each biomarker
We then explored the prognostic value of each marker both in the tumor and stroma, and the combination of the two areas. The presence of abundant intratumoral and stromal CD3+ T cells was associated with improved OS (I-CD3: HR 0.39, 95% CI 0.21 to 0.75, p=0.005; S-CD3: HR 0.33, 95% CI 0.13 to 0.84, p=0.02, figure 2A–B). Patients with high-infiltrating CD8+ tumor-infiltrating lymphocytes (TILs) either in the tumor or stroma had a lower risk for death (I-CD8: HR 0.43, 95% CI 0.22 to 0.82, p=0.01; S-CD8: HR 0.39, 95% CI 0.20 to 0.73, p=0.003, figure 2D–E). In addition, when patients were stratified by either intratumoral or stromal CD45RO, there were significant differences in OS between two groups in the training cohort (I-CD45RO: HR 0.47, 95% CI 0.25 to 0.88, p=0.018; S-CD45RO: HR 0.37, 95% CI 0.18 to 0.79, p=0.01, figure 2G–H).
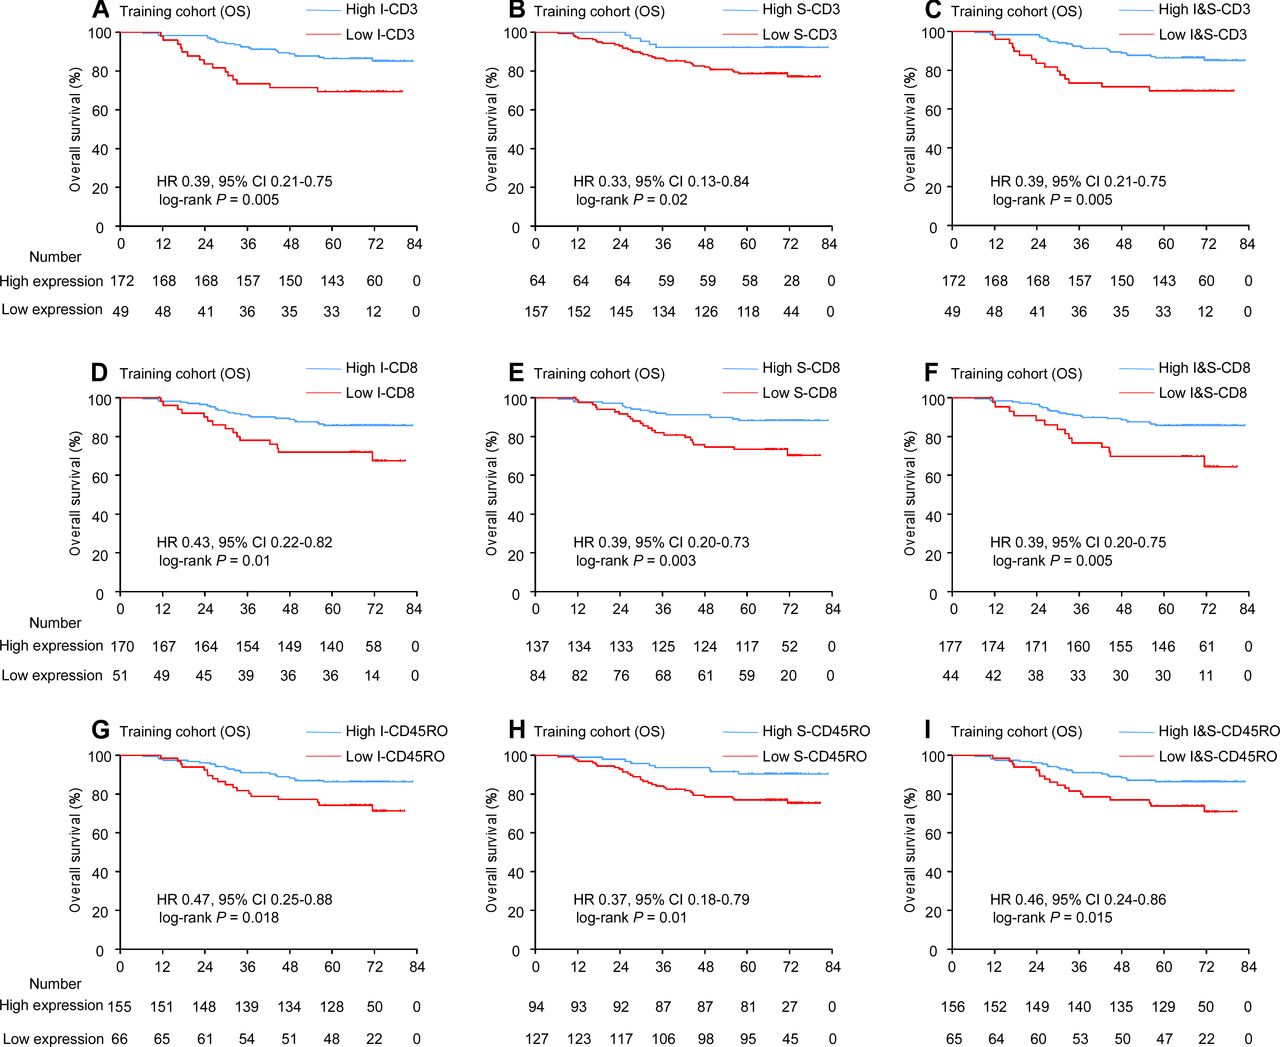
Kaplan-Meier curves for OS according to CD3, CD8 and CD45RO expression. Plots show (A) I-CD3; (B) S-CD3; (C) I&S-CD3; (D) I-CD8; (E) S-CD8; (F) I&S-CD8; (G) I-CD45RO; (H) S-CD45RO; and (I) I&S-CD45RO in the training cohort. I, intratumoral; S, stromal; I&S, intratumoral and stromal.
Furthermore, we defined subgroups with a cut-off value based on the expression of I-CD3 and S-CD3 (high I&S-CD3: high density of I-CD3 and/or S-CD3 vs low I&S-CD3: low density of I-CD3 and S-CD3). A statistically significant association was observed between the high I&S-CD3 and prolonged OS (HR 0.39, 95% CI 0.21 to 0.75, p=0.005). Using a similar method, we divided patients into high I&S-CD8 and low I&S-CD8; a positive association was also observed between high I&S-CD8 and prolonged OS (HR 0.39, 95% CI 0.20 to 0.75, p=0.005). Besides, patients with high I&S-CD45RO also had longer OS (HR 0.46, 95% CI 0.24 to 0.86, p=0.015, figure 2C,F,I).
IS and association with prognosis
According to the definition of IS (see method), 8.6%, 8.1%, 14.0%, 14.5%, 14.9%, 19.9% and 19.9% of the patients were classified as IS-0, IS-1, IS-2, IS-3, IS-4, IS-5 and IS-6, respectively. We aimed to explore the prognostic value of IS in the training cohort. X-tile software was used to generate the optimal cut-off value to stratify patients at different risk. In total, 153 (69.2%) patients had a high (IS: 3–6), while 68 (30.8%) patients had a low (IS: 0–2) in the training cohort. Patients with high IS had longer OS (88.2% vs 69.1%, respectively, HR 0.34, 95% CI 0.18 to 0.64, p=0.001), DFS (83.0% vs 66.2%, respectively, HR 0.44, 95% CI 0.25 to 0.78, p=0.005) and DMFS (89.5% vs 77.9%, respectively, HR 0.43, 95% CI 0.21 to 0.87, p=0.018) compared with patients with low IS (figure 3A-C). In the external validation cohort of 115 NPC patients, CD3, CD8 and CD45RO were also evaluated. With the same threshold, IS categorized 66 (57.4%) patients into the high-infiltrating group and 49 (42.6%) patients into the low-infiltrating group. The patients with high IS also had longer OS (80.3% vs 55.1%, respectively, HR 0.38, 95% CI 0.19 to 0.75, p=0.006), DFS (75.8% vs 40.8%, respectively, HR 0.34, 95% CI 0.19 to 0.63, p=0.001) and DMFS (87.9% vs 65.3%, respectively, HR 0.30, 95% CI 0.13 to 0.69, p=0.005) than those with low IS (figure 3D-F).

Kaplan-Meier curves for OS, DFS and DMFS according to the immune score. Plots show (A) OS, (B) DFS and (C) DMFS in the training cohort and (D) OS, (E) DFS and (F) DMFS in the validation cohort.
In the training cohort, univariate analysis showed that IS, TNM stage and pre-EBV DNA levels were significantly associated with OS, DFS and DMFS (figure 4). We then performed multivariate Cox regression analysis, which showed that the IS remained significant for OS, DFS and DMFS in the training cohort (OS: HR 0.34, 95% CI 0.18 to 0.63, p=0.001; DFS: HR 0.44, 95% CI 0.25 to 0.78, p=0.005; and DMFS: HR 0.43, 95% CI 0.21 to 0.87, p=0.019). This was the same as in the validation cohort (OS: HR 0.42, 95% CI 0.21 to 0.84, p=0.014; DFS: HR 0.37, 95% CI 0.20 to 0.68, p=0.001; and DMFS: HR 0.32, 95% CI 0.14 to 0.75, p=0.008). In addition, the TNM stage and pretreatment EBV-DNA levels were also significantly associated with OS, DFS and DMFS in multivariate analysis (table 2).
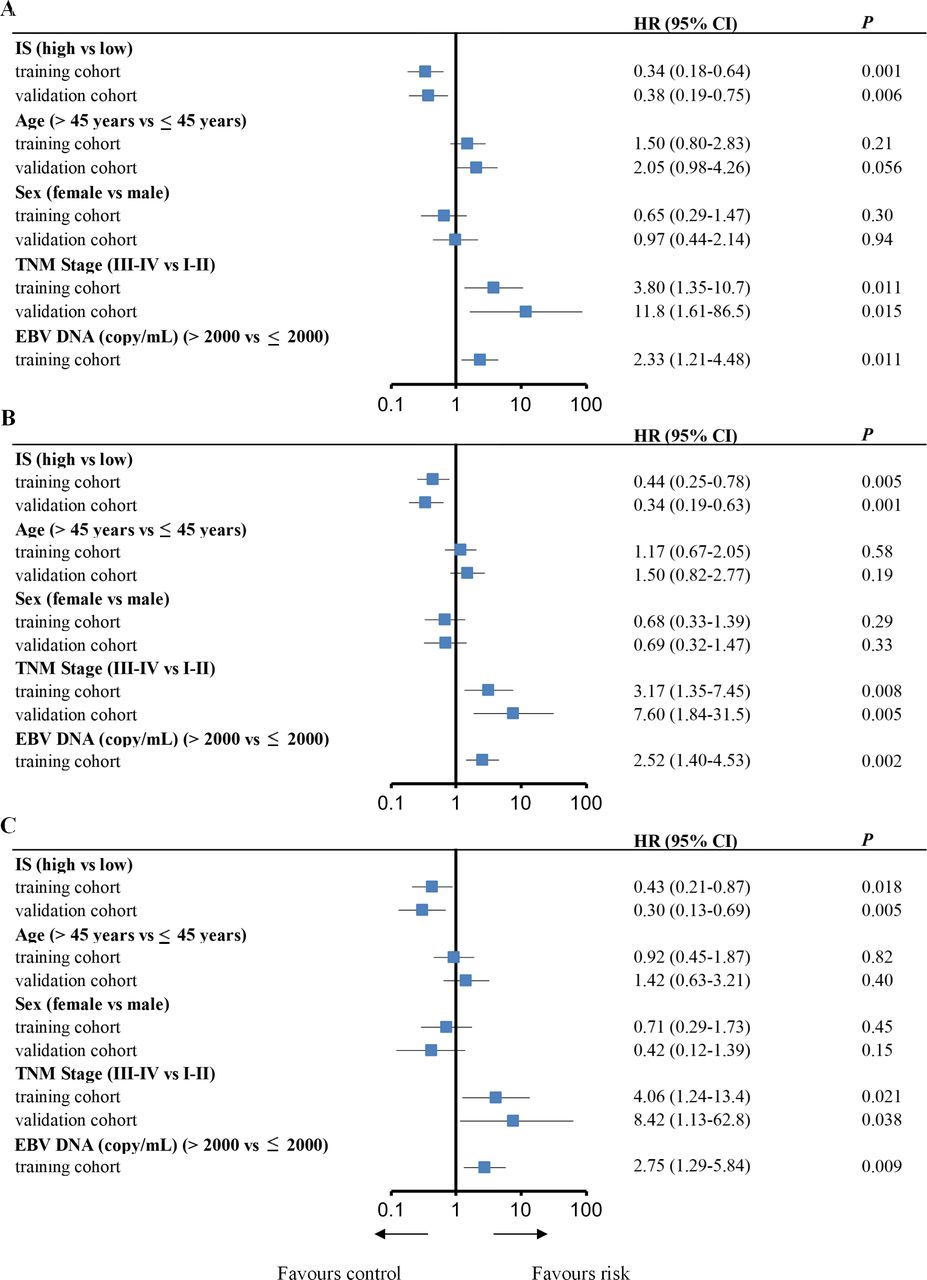
Univariate analysis of factors associated with overall survival, disease-free survival and distant metastasis-free survival in the training and validation cohorts. Plots show (A) overall survival, (B) disease-free survival and (C) distant metastasis-free survival. EBV, Epstein-Barr virus; IS, immune score; TNM, tumor, node and metastasis.
Multivariable Cox regression analysis of factors associated with overall survival, disease-free survival and distant metastasis-free survival in the training and validation cohorts
Development of nomogram with IS
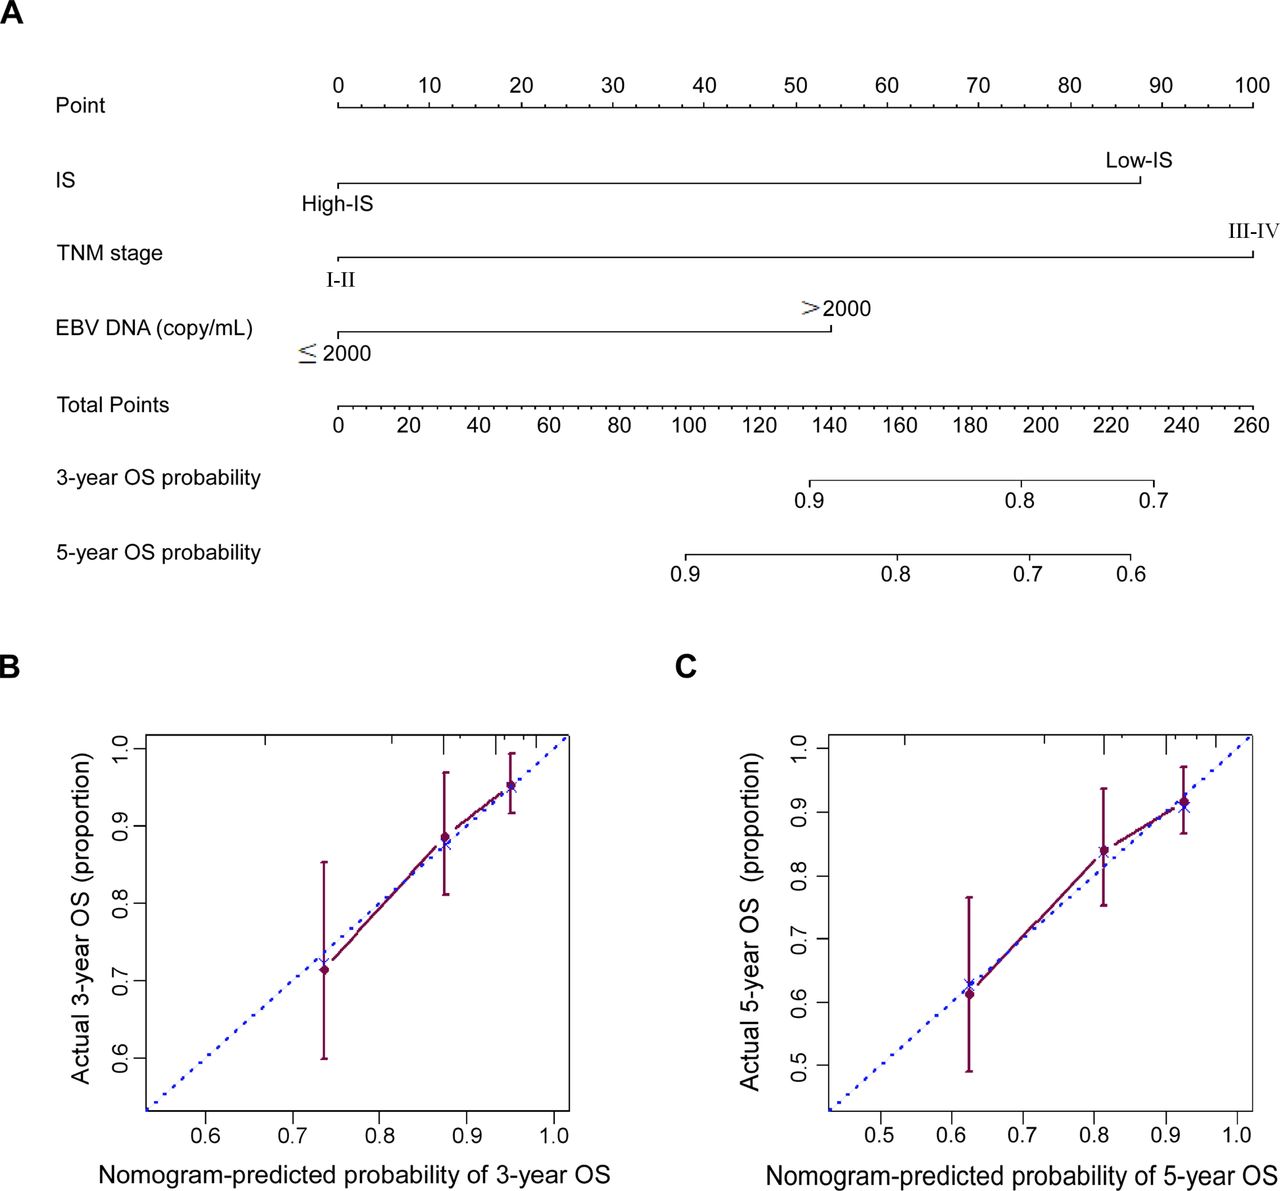
Since IS, TNM stage and pretreatment EBV-DNA were independent prognostic variables in the multivariate analysis, we constructed nomogram A to predict the 3 years and 5 years OS of NPC patients using all independent variables in the training cohort: IS, TNM stage and EBV-DNA (figure 5A). In addition, we also established nomogram B using TNM stage and EBV-DNA in the training cohort. The Harrell’s concordance index (C-index) for the nomogram A to predict OS was 0.713 (95% CI 0.635 to 0.791), while the C-index for the nomogram B was 0.653 (95% CI 0.580 to 0.726) in the training cohort. The addition of IS to nomogram A significantly enhanced the accuracy compared with nomogram B (p<0.001). Meanwhile, the calibration plot of nomogram A for the probability of 3 years or 5 years OS showed optimal agreement between the prediction by nomogram and actual observation for nomogram in the training cohort (figure 5B,C). As pretreatment EBV-DNA level was not tested at the Affiliated Hospital of Guilin Medical University before 2015, therefore, this nomogram could not be validated due to the lack of EBV-DNA data in the validation cohort.
Nomogram and calibration plots for predicting 3-year and 5-year OS. (A) Nomogram A including IS, TNM stage and EBV-DNA; (B, C) showed the calibration plots for predicting 3-year and 5-year OS in NPC patients from the training cohort. EBV, Epstein-Barr virus; IS, immune score; NPS, nasopharyngeal carcinoma; OS, overall survival; TNM, tumor, node, and metastasis.
Discussion
In this study, we detected the density of different CD3, CD8 and CD45RO lymphocyte populations in the tumor and stroma using digital pathology and evaluated their prognostic value in NPC patients. Moreover, we determined the IS of each patient based on the density of these three markers. Then, we evaluate the prognostic value of IS in two NPC patient cohorts. Our results demonstrated that IS is a powerfully independent predictor of OS, DFS and DMFS for NPC patients. In addition, we constructed a nomogram to predicted the 3 years and 5 years OS of NPC patients using all independent variables: IS, TNM stage and EBV-DNA. To the best of our knowledge, this study provided the first dataset that both evaluates and validates the prognostic significance of IS in NPC patients.
Since the early 1900s, immune infiltration in cancers has gained considerable attention, and a variety of studies have explored the prognostic value of immune cells.23 Based on H&E slides, the density and distribution of TILs is a valuable prognostic biomarker in various types of cancers.24–26 In addition, several studies indicate that TIL density is useful in predicting response to neoadjuvant chemotherapy in breast cancer.27 28 However, the ability to identify the density of TILs using H&E slides is highly subjective, less reproducible and contains undefined cell populations with possible opposing functions.9 Thus, by comparing the differences between TIL and Immunoscore, Galon et al demonstrated that Immunoscore was highly reproducible, objective and robust when quantifying specific T-cell subsets in specific tumor regions.9 Many studies have presented the prognostic predictive value of Immunoscore in various types of cancers.8 10 29 However, unfortunately, little is known about the prognostic value of IS in NPC patients. Here, we determined the density of CD3, CD8 and CD45RO cells both in the tumor and stroma using digital pathology. Moreover, IS was able to predict the survival of NPC patients in a training cohort, before then being validated in an external cohort.
Our study has shown that the density of different CD3, CD8 and CD45RO lymphocyte populations both in the tumor and stroma could predict prognosis of NPC patients. Moreover, NPC patients with high IS had significantly longer OS, DFS and DMFS than those with low IS. The positive prognostic value of Immunoscore has been shown to be consistent in a variety of cancers.9–11 With a number of different types of immune cells that are capable of infiltrating into tissues, the tumor microenvironment is both diverse and complicated. Immune contexture represents the analysis of the location, density and functional orientation of the different immune cell populations, which can provide comprehensive details of the immune microenvironment.6 However, due to its complexity and difficulty of routine clinical practice, the application value of immune contexture is limited. Derived from the immune contexture, immunoscore is based on the density of lymphocyte populations (CD3, CD8 and CD45RO), both in the core of the tumor and in the invasive margin (IM) of tumors. Currently, immunoscore has become a clinically useful prognostic marker in a variety of cancers, such as colorectal cancer, non-small-cell lung cancer and others.9 12 30 Until now, the prognostic significance of IS was unknown in NPC patients. As radiotherapy and/or chemotherapy are now the standard treatments for locoregional NPC, surgery is not recommended.31 It is only possible to obtain biopsies for analysis, which could not be used to evaluate the IM. Therefore, we believe it is more significant to identify IS for NPC patients based on the density of CD3, CD8 and CD45RO in the tumor and stroma. Since the evaluation method is not fully identical as Immunoscore proposed by Galon et al, we name it IS.
Recently, digital pathology has gained great attention due to its accurate, quantitative evaluation of whole-slide sets. This permits automatic and objective evaluation.32 Particularly for IS, it demands accurate and quantitative evaluation of CD3+, CD8+ and CD45RO+ T cells both in the tumor and stroma. However, due to the extremely huge number of lymphocytes infiltrating into NPC, the number of positive T cells is almost impossible to be enumerated by a pathologist. Digital pathology highlights the obvious advantages in accelerating the process of quantification, facilitating the analysis of more complex spatial patterns and providing standardized metrics.33 In this study, we evaluated the density and distribution of CD3+, CD8+ and CD45RO+ T cells through digital pathology. Our digital pathology process was based on a state-of-the-art deep neural network architecture. Not only did this allow for accurate classification of cell types but it also achieved good performance in identifying tumor and stroma areas. Thus, our digital pathology process made it possible to quickly determine the IS of each patient.
In addition to prognostic value, immunoscore was suggested to be an attractive tool to help in guiding treatment selection. Recently, a standardized and univocal tumor classification based on the Immunoscore has been proposed, which stratified tumor as hot (high immunoscore), altered-immunosuppressed, altered-excluded (Intermediate Immunoscore) and cold (low Immunoscore).34 By displaying a high degree of T cell infiltration, hot tumors represent a fertile ground for effective immune checkpoint blockade inhibitors (ICIs) based monotherapy or combination therapy; while cold tumors characterized by low immunoscore, a proposed approach to treat these patients is combining a priming therapy that enhances T cell responses and removal of coinhibitory signals and/or supply of costimulatory signals.34 35 By stratifying these major groups based on T cell infiltration, the immunoscore might be used as a tool to identify phenotypes responding to distinct classes of monotherapies or combinational therapies. Therefore, we think IS might help stratify patients with different types of immunosuppressive and be suitable for different treatments, which would potentially improve the clinical management of NPC patients.
Previously, we have constructed an immune checkpoint-based signature (ICS), which can also provide prognostic information for NPC patients.17 The published study provided the expression and coexpression information of targetable immune checkpoint molecules, which can help us to understand individual tumor immune evasion mechanism and identify rational ICIs for NPC patients.36 By contrast, IS is based on the density of certain lymphocyte populations, which provided a new tumor classification method and corresponding potential therapeutic strategies.34 The difference between the two models lies in the guidance of clinical trials and treatment. In general, we could first evaluate the IS of NPC patients. For patients with low IS, priming therapy combined with ICIs would be helpful. However, for patients with high IS, the expression information of immune checkpoints should be tested to choose suitable ICIs based mono-therapy or combination therapy.34–36 Combined with IS, the expression of immune checkpoints could guide more appropriate immunotherapy for NPC patients.
In this study, we systemically evaluated the densities of CD3+ T cells, CD8+ cytotoxic T cells and CD45RO+ memory T cells both in intratumoral and stromal tissue for NPC patients using digital pathology. Furthermore, we determined the survival prognostic value of each marker in the tumor and stroma, and the combination of the two areas. IS constructed based on the expression status of these three markers, was demonstrated to be a good tool to predict prognosis of NPC patients and might be an attractive option to help guide treatment selection.
Conclusions
Our study demonstrated that IS, which was based on the density of certain lymphocyte populations (CD3, CD8 and CD45RO), could predict risk of individual death, disease progress and distant metastasis. Moreover, we established a nomogram with the integration of all independent variables that might offer clinicians a useful tool for predicting prognosis of NPC patients.
Acknowledgments
We would like to thank the staff members of the Department of Pathology, Sun Yat-sen University Cancer Center and the Affiliated Hospital of Guilin Medical University for their assistance with the preparation and preservation of paraffin-embedded NPC samples.
References
Footnotes
Y-QW, LC and Y-PM contributed equally.
Contributors Conception and design: Y-QW, Y-QL and JM. Development of methodology: Y-QW, WJ, S-YX and YZ. Acquisition of data: Y-QW, LC, Y-PM and S-YX. Analysis and interpretation of data: Y-QW, LC, Y-PM, WJ, S-YX, YZ, Y-PC, X-ML, Q-MH, S-WH, X-JY, YL, YZ, J-PY, NL and Y-QL. Writing, review and/or revision of the manuscript: Y-QW, Y-QL, LC, Y-PM, Y-QL and JM. Administrative, technical or material support: Y-QW, J-PY, NL, Y-QL and JM. Study supervision: Y-QL and JM.
Funding This work was supported by grants from the National Natural Science Foundation of China (81 930 072 and 81803049), Key-Area Research and Development Program of Guangdong Province (2019B020230002), the Natural Science Foundation of Guangdong Province (2017A030312003), the Health and Medical Collaborative Innovation Project of Guangzhou City, China (201803040003), the Innovation Team Development Plan of the Ministry of Education (IRT_17R110), and the Overseas Expertize Introduction Project for Discipline Innovation (111 Project, B14035).
Competing interests None declared.
Patient consent for publication Not required.
Ethics approval The study was approved by the institutional ethics committees of Sun Yat-sen University Cancer Center and the Affiliated Hospital of Guilin Medical University. All procedures in this study were conducted in accordance with ethical principles.
Provenance and peer review Not commissioned; externally peer reviewed.
Data availability statement Data are available on reasonable request. All data relevant to the study are included in the article or uploaded as online supplementary information. The key raw data have been uploaded to Research Data Deposit public platform (www.researchdata.org.cn), with an approval number of RDDA2019001317.