Article Text

Abstract
Background Recent advances in T cell-related immunotherapy have brought remarkable progress in the treatment of non-small cell lung cancer (NSCLC). However, whether and how genetic variations of T cell cancer immune response genes can influence clinical outcomes of NSCLC patients remain obscure.
Methods In this multiphase study, we assessed 2450 single-nucleotide polymorphisms (SNPs) from 280 T cell cancer immune response-related genes in 941 early-stage NSCLC patients (discovery n=536; validation n=405) to analyze the variants’ associations with outcomes and to observe the effects on T cell phenotypes.
Results We found 14 SNPs in 10 genes were associated with NSCLC outcomes (p<0.05) in both phases. Among them, TRB:rs1964986 was the most significant variant associated with recurrence risk after meta-analysis (HR 1.84, 95% CI 1.35 to 2.52, p=1.15E-04), while IDO1:rs10108662 was the most significant SNP associated with death risk (HR 1.87, 95% CI 1.40 to 2.51, p=2.17E-05). Analysis of unfavorable genotypes indicated cumulative effects on death and recurrence risks. Seven treatment-specific variants were found to predict opposite outcomes in surgery-only and surgery-plus-chemotherapy subgroups. Expression quantitative trait loci analysis indicated that six SNPs significantly correlated with their corresponding gene expression. T cells from high-risk subjects displayed reduced degranulation (p=0.02) and decreased cytotoxicity against cancer cells (p<0.01). Gene expression profile indicated increased IDO1 expression and decreased IL2, PRF and GZMB expression in high-risk subjects.
Conclusions Genetic variations in T cell cancer immune response pathways can impact outcomes and may be served as predictors for treatment efficacy in early-stage NSCLC patients. The correlation between immune genotypes and T cell antitumor immunity suggests a biological link between host immune genetics and NSCLC prognosis.
- genetics
- immunology
- medicine
- molecular biology
- oncology
This is an open access article distributed in accordance with the Creative Commons Attribution Non Commercial (CC BY-NC 4.0) license, which permits others to distribute, remix, adapt, build upon this work non-commercially, and license their derivative works on different terms, provided the original work is properly cited, appropriate credit is given, any changes made indicated, and the use is non-commercial. See http://creativecommons.org/licenses/by-nc/4.0/.
Statistics from Altmetric.com
Introduction
Lung cancer is a major cause of cancer-related death in the USA.1 Non-small cell lung cancer (NSCLC) is the most common subtype of lung cancer, which accounts for 84.3% of all cases according to Surveillance,Epidemiology, and End Results Program (SEER) database.2 Treatments for early-stage NSCLC offer the chance for cure with better overall survival (OS) rates than those of the past.3
The generation of T cell cancer immune response is essential for T cell mediated cancer eradication, which consists of stepwise events involving multiple immune genes and pathways.4 Growing evidence supported the relationship between immunity and cancer outcomes. Several immune genes and phenotypes have been reported as predictors of lung cancer outcomes.5 6 Moreover, genetic alterations could influence T cell cancer immune response thereby affecting prognosis. For instance, Rizvi et al reported that the mutation burden in NSCLC patients could shape the tumor’s sensitivity to PD-1 inhibition7; another investigation reported that inflammation-related genetic variations could influence survival of advanced-stage NSCLC patients.8 However, no study to date has systematically evaluated the association between genetic variants in T cell cancer immune response genes and clinical outcomes of NSCLC patients.
In this study, we aimed to characterize the association between genetic variants of T cell cancer immune response genes and early-stage (I or II) NSCLC prognosis and to identify potential biological mechanisms. First, we examined a comprehensive panel of germline single-nucleotide polymorphisms (SNPs) in T cell cancer immune response-related genes and assessed their associations with disease recurrence and survival in two cohorts of early-stage NSCLC patients. Second, we performed meta-analysis and functional characterization of the SNPs we identified. Third, we investigated the associations between candidate SNPs and T cell cytolytic phenotypes. To our knowledge, this is the first integrated, multistage investigation to assess the role of germline variants in T cell cancer immune response pathways in affecting early-stage NSCLC outcomes and to functionally examine the correlation of these variants with T cell activities.
Materials and methods
Written informed consent to participate in the study was obtained from each participant before data and biospecimens were collected.
Study population and data collection
Study participants were enrolled in a clinical study of lung cancer that has been ongoing since 1991 at The University of Texas MD Anderson Cancer Center. The recruitment method was described previously.9 Briefly, the subjects were incident cases of lung cancer diagnosed and histologically confirmed at MD Anderson between 1995 and 2013. The schematic of study design involving discovery and validation sets for 941 early-stage NSCLC patients (discovery set: n=536, validation set: n=405) as well as bioinformatic and functional analyzes are shown in online supplementary figure S1 and table 1. Subjects in the discovery and validation sets were recruited for a genome-wide association study (GWAS) of lung cancer and the OncoArray study, respectively. Clinical data were abstracted from chart review, and epidemiologic data were collected from each participant during an in-person interview. The peripheral blood was collected from the antecubital area of arm after the interview. Participants were considered never-smokers if they had smoked less than 100 cigarettes in a lifetime. Former smokers were those who had quit smoking more than 1 year before lung cancer diagnosis. Current smokers were those who were currently smoking or had quit smoking within 1 year from the date of lung cancer diagnosis (cases). To avoid confounding by race/ethnicity and to minimize heterogeneity of participants, this study was restricted to non-Hispanic white patients with stage I or II NSCLC who were treated at MD Anderson Cancer Center.
Supplemental material
Patient characteristics
Retrieval of RNA sequencing data from The Cancer Genome Atlas database
NSCLC (lung adenocarcinoma (LUAD) and LUSC (lung squamous cell carcinoma)) datasets from The Cancer Genome Atlas (TCGA) database were accessed for the analysis of gene expression in tumors.10 11 Clinical data and level-3 RNA-seq datasets were downloaded from http://firebrowse.org/. The RNA-seq data of 1016 NSCLC patients (512 cases from LUAD dataset and 504 cases from LUSC dataset) were included in the analysis, and 110 patients among them had corresponding normal tissue data available.
SNP genotyping and selection
Genomic DNA was isolated from peripheral blood samples using the QIAamp DNA Blood Maxi Kit according to the manufacturer’s instructions. Discovery cohort genotypes were generated using the HumanHap300 BeadChip (Illumina, San Diego, California, USA) for the 421 patients included in our previous GWAS of lung cancer,12 and the HumanHap660 BeadChip (Illumina) for additional 115 patients in this study. The analysis focused on 307 260 SNPs that were included and passed quality control filters, including a call rate of at least 95% and minor allele frequency of at least 0.01. Genotyping for the validation cohort (405 patients) was performed using the Custom Infinium OncoArray-500K beadchip according to the manufacturer’s instructions. The assay was run on the iScan system (Illumina). Genotyping data were analyzed and exported using the Genome Studio software program (Illumina). Due to variation in SNP coverage between the GWAS and OncoArray Beadchips, we identified linked SNPs to replace missing loci from the discovery phase using data from the 1000 Genome Project (European population, Phase 3 data, r2 >0.8; http://www.internationalgenome.org/data). All genotyping data were analyzed and exported using the Genome Studio software program (Illumina). For quality control, we included 3% of the samples as replicates, and the call rate and concordance of the different beadchips were similar at 99% or greater. Finally, 412 487 SNPs that passed quality control filter using the same criteria as GWAS were included in the analysis.
On the basis of the stepwise cancer immune response of T cells,4 we generated T cell cancer immune response pathways and genes by extensively searching the keywords of each step (antigen presentation, T cell priming/activation, T cell trafficking, T cell infiltration, T cell recognition and T cell cytotoxicity) in the Kyoto Encyclopedia of Genes and Genomes (KEGG, http://www.genome.jp/kegg/), Biocarta (https://cgap.nci.nih.gov/Pathways/BioCarta_Pathways) and Reactome (http://www.reactome.org/) databases. Furthermore, previously published related studies and gene lists from commercially customized gene panels (Nanostring nCounter PanCancer Immune Profiling Panel and HTG EdgeSeq Immuno-Oncology Assay) were referenced.4 11 Genes involved in at least two pathways or mentioned in two databases were selected for the final gene list. For each selected gene, tagging SNPs from 10 kb flanking and within gene regions were included. A total of 314 T cell cancer immune response genes from 25 pathways were selected (online supplementary table S1), and corresponding genotyping data were extracted from the GWAS and OncoArray data. After quality control, 280 genes were considered resulting in the selection of 2450 SNPs.
Supplemental material
Subject selection and matching for T cell phenotypic assays
For the in vitro T cell assays, 19 pairs of healthy donors matched by age, sex and smoking status from our lung cancer GWAS and OncoArray studies, whose genotypes corresponded to low and high risk, were selected. To minimize the impact of lung cancer on T cell phenotypes, only healthy controls were analyzed. Low-risk and high-risk groups were defined by the number of unfavorable genotypes (UFGs) of expression Quantitative Trait Loci (eQTL)-significant SNPs with the low-risk group having 0–1 UFG and high risk group having 3–4 UFGs (online supplementary table S2).
Peripheral blood mononuclear cell cryopreservation and resting
Peripheral blood mononuclear cells (PBMCs) of healthy donors were isolated from 5 to 20 mL of whole blood, counted and resuspend into freezing medium (90% FBS and 10% dimethyl sulfoxide (Sigma-Aldrich, St. Louis, Missouri, USA)) at the density of 5×10E6/mL. The cells were placed in Cryo-SafeTM Cooler (Bel-Art, Wayne NJ) in −80°C overnight and transferred to a liquid nitrogen freezer until use. Cryopreserved PBMCs (5×10E6/mL) were thawed in a 37°C water bath without shaking. The cells were cultured overnight according to previous literature.13
CD107a degranulation assay
Rested PBMCs were diluted to a density of 2×10E6 cell/mL in medium containing 20% FBS and 50 IU/mL interleukin-2 (IL-2) (BioLegend, San Diego, California, USA). One hundred and fifty microliter of cell suspension was transferred into 96-well round-bottom plate. Cells were stimulated with 4 µg/mL OKT3 (BioLegend) and monensin (MEDICAL &BIOLOGICAL LABORATORIES, MBL, Japan) then stained with CD107a antibody (MBL) for 5 hours at 37°C in the dark. After stimulation, cells were washed twice with Fluorescence-activated Cell Sorting (FACS) buffer and stained with PE-CD8 antibody (BioLegend) for 15 min at 4°C in the dark. The cells were analyzed using a BD LSRFortessa X-20 analyzer (BD Bioscience, San Jose, California, USA). The gating strategy and representative data are shown in online supplementary figure S2. Gating strategy consisted on isolating single cells by gating on FSC-A vs FSC-H, followed by SSC-A vs SSC-H. Dead cells were excluded by Sytox Blue. Degranulated CD8 T cells were identified as a per cent of CD107a+CD8+T cell population. Data were analyzed using FlowJo (V.10.0.8) software.
In vitro T cell killing assay
To assess the cytotoxic potential of T cells, we performed an in vitro killing assay using NSCLC A549 and H460 cell lines as target cells. The entire experimental workflow is depicted in online supplementary figure S3. Briefly, rested PBMCs were cultured and expanded with Roswell Park Memorial Institute (RPMI) 1640 medium enriched with 2 mM L-glutamine and supplemented with 20% FBS and 8 µg/mL phytohemagglutinin (Remel, Thermo Fisher, Waltham, Massachusetts, USA) for 48 hours. The viable CD3 + lymphocytes were labeled with an anti-CD3 antibody (BioLegend), counterstained with Sytox blue (Thermo Fisher), and sorted using a BD FACS Aria II cell sorter (BD Bioscience) (gating strategy in online supplementary figure S4A). A549 and H460 were purchased from ATCC (Manassas, Virginia, USA) and cultured with F12K medium and RPMI1640 medium supplemented with 10% FBS, respectively. The two cell lines have been verified by short tandem repeat profiling of 14 known loci and tested for Mycoplasma contamination showing negative result by the MD Anderson Characterized Cell Line Core facility on January 23 2018. The HLA genotypes of these two target cells were identified previously.14 A549 and H460 cells were plated in a 96-well plate (Greiner, Austria) the day before the assay. The target cells were labeled with calcein AM (green fluorescence) and ethidium homodimer-1 (red fluorescence) using LIVE/DEAD Viability/Cytotoxicity kit (Thermo Fisher). Meanwhile, purified T cells were stimulated with 4 µg/mL OKT3 (BioLegend) for 5 hours. To distinguish from target cells, T cells were labeled with anti-CD3 fluorescence antibody (Alexa Fluor 647) and added to the tumor cells at a ratio of 10:1 and incubated in an IN Cell Analyzer 2200 (GE, USA). The interactions between T cells and tumor cells were scanned every 30 min under fluorescence microscopy using the IN Cell Analyzer 2200. All images were further processed with the Developer Tool Box 1.9.2 (GE, USA); all dead cell signals were counted. T cell cytotoxicity was calculated from triplicate samples as (experimental dead cell count – negative control dead cell count (spontaneous)) / (positive control dead cell count (maximal) – negative control dead cell count (spontaneous)) and expressed as a percentage. The positive control was assessed by complete lysis of target cells using 70% ethanol. The negative control was assessed by adding only medium to the target cells. Wilcoxon signed rank test were applied in the comparison of UFG and Non-UFG carriers. The inhibitory rate by effector:target cell ratio over time is shown in online supplementary figure S4B.
mRNA expression profiling of T cells
RNA was extracted from purified viable CD3 + T cells before and 6 hours after co-culture with the target tumor cells using Trizol Reagent (Thermo Fisher) according to the manufacturer’s instructions. RNA quantity and quality were determined using a NanoDrop 1000 Spectrophotometer (Thermo Fisher). Reverse transcription was performed using the High-Capacity cDNA Reverse Transcription Kit (Thermo Fisher) according to the manufacturer’s instructions. The T cell activation-related genes IL2, IFNG, PRF1, GZMB and TNFA; T regulatory cell genes FOXP3 and IL4 (data not shown due to undetected expression); T cell trafficking gene EOMES; T cell checkpoint genes HAVCR2, PDCD1, CTLA4, LAG3, CD137, VISTA, IDO1 and ICOS; 1and lineage markers CD4 and CD8 were selected and incorporated into the panel. The gene expressions were determined using TaqMan probes (Applied Biosystems, Thermo Fisher) and a 48.48 Dynamic Array (Fluidigm, San Francisco, CA), according to the manufacturer’s instructions. Probes used are listed in online supplementary table S3. Transcript abundance was calculated by comparison with a standard curve. Each gene expression assay was tested in duplicate, and the mean Ct value was normalized to the averaged expression of CD3E and then subjected to analysis using the 2-ΔΔCt method.
eQTL analysis
Analysis of eQTL effects of validated SNPs associated with recurrence and survival was carried out using HaploReg v4.1 from Broad Institute (http://archive.broadinstitute.org/mammals/haploreg/haploreg.php).15 Only cis-eQTLs (acting on local genes) were considered. Variants showing cis-eQTL effects in TRA and TRB loci were not considered due to highly variable transcription of these genes.16
Statistical analysis
Primary endpoints of the study were OS and recurrence. The OS rate was defined as the number of living patients after diagnosis divided by the total number of living and deceased patients after diagnosis. Survival time was defined as duration from diagnosis to death of any cause or the last follow-up, Time to recurrence was computed from the date of pathological diagnosis to the date of first documented recurrence or last follow-up. Patients who were lost to follow-up were censored. The risk of death or recurrence for each SNP in patients in the discovery and validation cohorts was estimated as HR and 95% CI values using the multivariate Cox proportional hazards model with adjustment for sex, age, smoking status, tumor stage, performance status and treatment. We assessed three genetic models of inheritance (dominant, recessive and additive) for each SNP using the discovery dataset and multivariable Cox proportional hazard regression analysis. The model with the smallest p value was used to measure the statistical significance of the association between each SNP and recurrence-free survival (RFS) or OS in the genotyping data. Only the dominant model was considered when the rare homozygous genotype was <5% in both living and deceased patients. A meta-analysis was used to estimate the HR and 95% CI of the combined discovery and validation populations. For the integration of genotype data, SNPs identified from GWAS not found in the OncoArray panel were replaced with linked SNPs (r2 ≥0.8). Kaplan-Meier analyzes and log-rank tests were used to calculate the survival difference associated with individual genotypes. To evaluate the cumulative effects of the genetic variants, we combined the UFG (genotypes associated with significantly increased risk in the main effects analysis) for each participant. If multiple SNPs within a haplotype block showed significant main effects, only the SNP most strongly associated with the smallest P value was selected for the analysis. If the HR <1, the reciprocal value was applied in the cumulative analysis of UFG. The RNA-seq data from TCGA database were analyzed with R software (V.3.4.2), and the Wilcoxon rank-sum test was used to compare the difference in gene expression between tumor and normal tissues. All statistical tests were two-sided, with P values less than 0.05 considered statistically significant.
Results
Patient characteristics
The characteristics of the discovery and validation cohorts are given in table 1. The discovery group included 536 patients with early-stage NSCLC, 54.1% of whom were women. The patients’ mean age at diagnosis was 65.4 years. The median survival time (MST) was 71.7 months, and the median follow-up time was 59.9 months. Within the cohort, there were 108 (20.1%) never smokers, 243 (45.3%) former smokers, and 185 (34.5%) current smokers. Among the patients, 58.0% received surgery only, 24.6% received surgery plus adjuvant chemotherapy, and 3.6% received surgery plus radiotherapy. At the time of the current study, 230 (42.9%) of the patients had died. The validation cohort included 405 patients with early-stage NSCLC (51.1% women). The patients’ mean age was 67.0 years. The MST was 94.7 months, and the median follow-up time was 33.5 months. The cohort included 17 (4.2%) never smokers, 237 (58.5%) former smokers, and 151 (37.3%) current smokers. Among the patients, 51.4% received surgery only, 24.2% received surgery plus chemotherapy, and 1.2% received surgery plus radiotherapy. At the time of the study, 280 (69.1%) of the patients had died. The details of chemotherapy were provided in online supplementary table S4. No significant differences were found comparing the host and clinical characteristics of the discovery and validation groups except for smoking status, treatment, and vital status. The discovery cohort had higher percentage of never smokers, while the validation cohort had higher percentage of non-surgery treated patients and higher number of deaths, however, discrepancy in smoking status between two cohorts have no significant impact on the overall results according to our results in multivariable models with/without adjusting the covariate (table 2, online supplementary table S5).
Single-nucleotide polymorphisms (SNPs) associated with recurrence and survival in patients with early-stage non-small cell lung cancer
Genetic variants in the T cell cancer immune response are associated with NSCLC outcomes
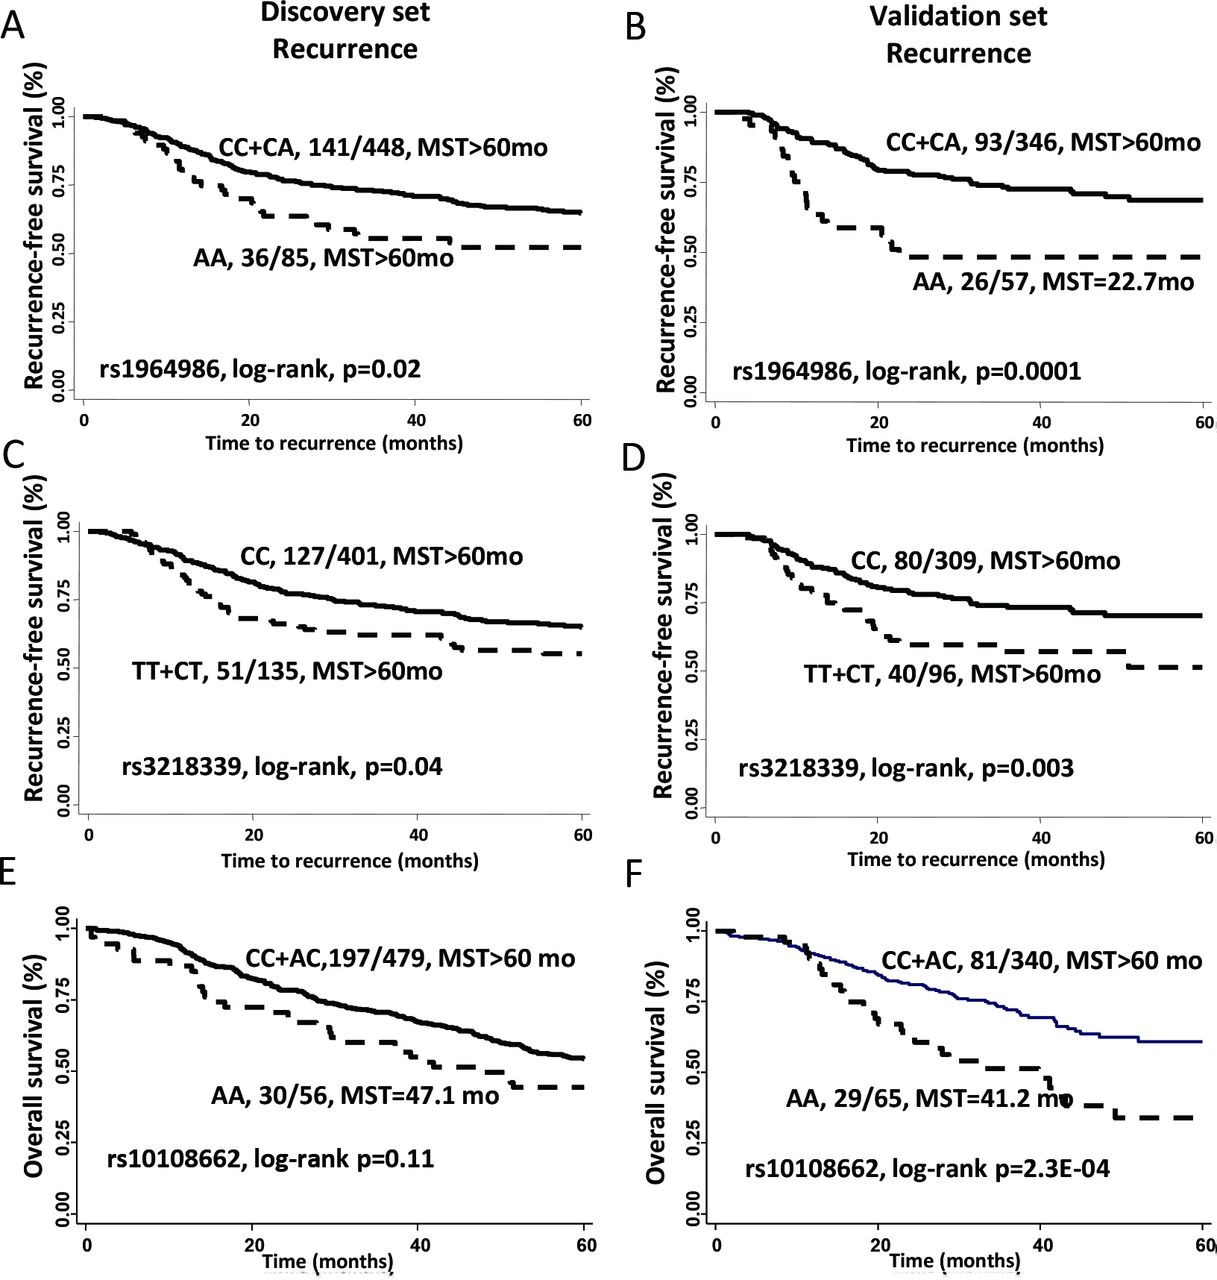
Among 2450 selected SNPs from 280 genes, 285 SNPs were associated with recurrence risk (p<0.05). Of these SNPs, 7 SNPs in six genes showed consistent results in both discovery and validation sets (table 2). The SNP most strongly associated with recurrence risk was rs1964986 in TRB. This intronic SNP was associated with 1.6- to 2.4-fold increased risk of recurrence in the discovery and validation sets (meta-analysis: HR 1.84, 95% CI 1.35 to 2.52, p=1.15E-04). Patients with AA genotype showed lower median RFS than those with CC/CA genotypes in both discovery (log-rank p=0.02) and validation sets (log-rank p=0.001) (figure 1A–B). IL2RB:rs3218339 also was associated with increased recurrence risk in both sets (table 2). In Kaplan-Meier survival analysis, rs3218339 CT/TT genotype carriers had shorter median RFS compared with CC carriers for both sets (log-rank p<0.05) (figure 1C–D). Another five variants were also associated with recurrence risk in both sets. Although with similar trends for both sets, the results were not consistently significant during the Kaplan-Meier analyzes (online supplementary figure S5).

Individual genetic variants in the T cell cancer immune response and recurrence-free or overall survival of early-stage NSCLC patients. Kaplan-Meier estimates of RFS by genotypes of TRB:rs1964986 in the discovery (A) and validation (B) phases; by genotypes of IL2RB:rs3218339 in the discovery (C) and validation (D) phases; and by genotypes of IDO1:rs10108662 in the discovery (E) and validation (F) phases. MST, median survival time; NSCLC, non-small cell lung cancer.
Among all SNPs analyzed, 258 were associated with risk of death during the discovery set (p<0.05). However, 7 variants were associated with death risk in both datasets (table 2). The SNP most strongly associated with OS was rs10108662 of IDO1. The variant genotype was associated with 1.5-fold to 2.5-fold increased risk of death in the discovery and validation sets (meta-analysis HR 1.87, 95% CI 1.40 to 2.51, p=2.17E-05). Patients with variant AA genotype demonstrated decreased survival compared with those with CC/CA genotypes during the Kaplan-Meier analysis; however, the result was significant only in the validation set (figure 1E–F). Similarly, variant alleles of GRB2:rs959260, GRB2:rs4789182, and JAK1:rs4915675 were associated with increased risk of death in both sets, whereas CUL1:rs122571, CUL1:rs243538, and TRB:rs1573618 were associated with reduced death risk (table 2). Again, Kaplan-Meier analyzes of these SNPs were not significant in both sets (online supplementary figure S6).
To assess the joint effects of identified SNPs on NSCLC outcomes, we conducted the UFG analysis for risks of recurrence and death. The SNPs associated with recurrence or survival demonstrated cumulative effect on recurrence or death risk and RFS or OS in both sets (online supplementary table S6 and figure S7).
Predictors of surgery and adjuvant chemotherapy
Subgroup analyzes were performed to identify SNPs that are predictive of NSCLC outcomes in surgery-only or surgery-plus-chemotherapy patients for both phases (online supplementary table S7). Results showed 4 SNPs were validated for recurrence and 9 SNPs for survival.
To further explore the predictors of lung cancer treatment, we performed subgroup analysis in pooled population (table 3). We identified 5 SNPs associated with recurrence risk in surgery-only and surgery-plus-chemotherapy patients. Interestingly, two variants were associated with recurrence risk in opposing directions (groups 1 and 2) for the treatment groups, whereas the remaining three variants conferred altered recurrence risk in similar fashion (groups 3 and 4). Also, we identified 6 SNPs correlated with death risk in both treatment groups. Five of the variants displayed opposite death risks (groups 1 and 2), whereas the remaining variant conferred similarly decreased death risk (group 4). To rule out the impact of chemotherapy type, we added the covariate in the subgroup analysis and found that it had no significant impact on the subgroup analysis (online supplementary table S8).
Subgroup analysis of treatment-specific SNPs associated with recurrence or survival in surgery-only and surgery-plus-chemotherapy patients for the combined group (discovery plus validation sets)
We conducted UFG analysis to assess the cumulative effect of two SNPs that predicted opposite effects on recurrence risk in the two treatment groups. Among surgery-only patients, intermediate-risk (1 UFG) and high-risk (2 UFG) patients displayed recurrence risks that were 1.9-fold and 3.7-fold higher, respectively, and shorter RFS than that of low-risk (0 UFG) group (p for trend=3.16E-03, log-rank p=4.29E-03). Conversely, among surgery-plus-chemotherapy patients, intermediate-risk and high-risk patients showed reduced recurrence risks that were 0.4-fold and 0.1-fold lower, respectively, and longer RFS than that of the low-risk group (p for trend=2.57E-03, log-rank p=0.049, figure 2A,B). The cumulative effect of 5 SNPs that predicted opposite effects on OS in the treatment groups was also analyzed. UFGs were arbitrarily defined from the vantage point of surgery-only patients with three or more UFGs as high risk; 2 UFGs as intermediate risk; and 0 or 1 UFG as low risk. Among the surgery-only patients, high-risk and intermediate-risk patients had death risks that were 3.9-fold higher (95% CI 1.91 to 7.77, p=0.013) and 2.6-fold higher (95% CI 1.22 to 5.46, p=1.7E-04), respectively, than that of the low-risk group, and had shorter MST than the low-risk group (log-rank p=3.91E-04). In contrast, among the surgery-plus-chemotherapy patients, intermediate-risk and high-risk patients had death risks that were 0.3-fold lower (95% CI; p=0.007) and 0.1-fold lower (95% CI 0.03 to 0.26; p=1.44E-05), respectively, than that of the low-risk group and had significantly longer MST than the low-risk group (log-rank p=1.82E-05). The combined UFG and Kaplan-Meier survival analyzes of the treatment-specific SNPs are shown in figure 2C,D and online supplementary table S9.
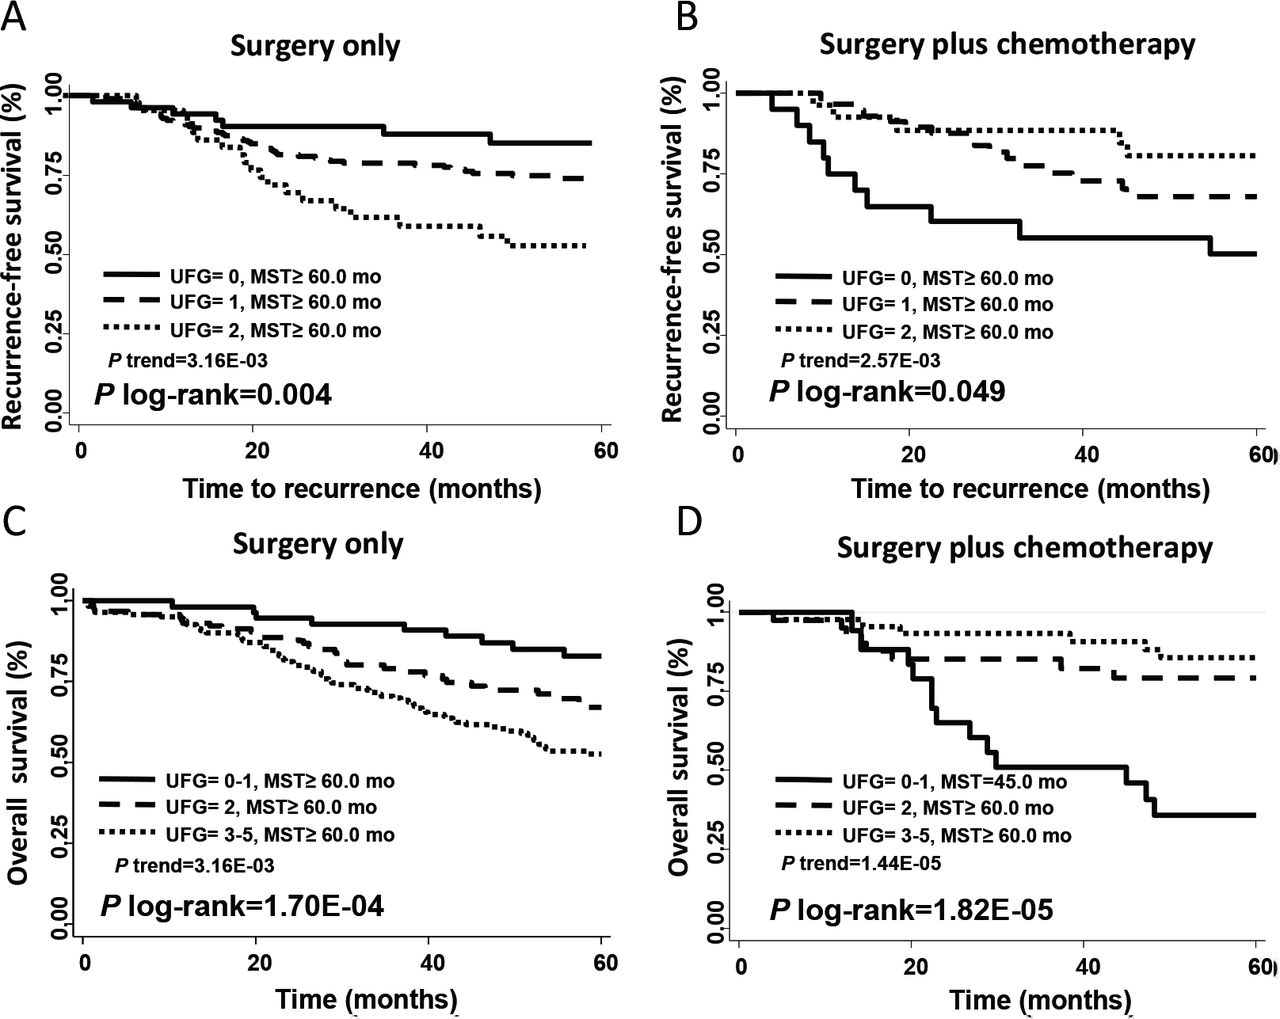
Cumulative effect of SNPs that predicted opposite effects on recurrence or death risk in the two treatment groups Kaplan-Meier estimates of recurrence-free survival (A, B) and overall survival (C, D) by number of unfavorable genotypes (UFGs) of treatment-specific SNPs (groups 1 and 2 variants showing opposite effects in different treatment groups; table 3) in surgery-only (A, C) and surgery-plus-chemotherapy (B, D) patients. Variants included in the recurrence analysis are VAV2:rs491220 and IFNGR2:rs1059293; variants in the survival analysis are TRB:rs10231513, STAT4:rs3024896, PTK2B:rs2322718, MAP3K1:rs12655019 and CUL1:rs243511. SNPs, single-nucleotide polymorphisms; UFG, unfavorable genotype.
Functional characterization of SNPs
Analysis of cis-eQTL revealed that 6 SNPs correlated with gene expression in PBMCs (online supplementary table S10). We analyzed the gene expression data for these eQTL-associated genes in 1016 lung cancer tissues and 110 normal lung tissues from TCGA database. The result showed that compared with normal tissues, tumor tissues had altered expression of GRB2, JAK1 and PSMD3 (p<0.01), but not IDO1 (p=0.11) and GSK3B (p=0.13) (online supplementary figure S8).
Patients with UFGs of eQTL SNPs displayed reduced T cell cytotoxicity
To investigate the association between specific genotypes and T cell phenotypes, we implemented T cell CD107a degranulation and in vitro T cell killing assays. The definitions of favorable and UFGs for SNPs showing eQTL effects are listed in online supplementary table S11. In CD107a degranulation assay, we evaluated the association between UFG carrier status and CD8 + T cell degranulation. In 19 pairs of donors who belonged to low-risk group (0 or 1 UFG) or high-risk group (≥3 UFGs), we found that the percentage of CD107a+CD8+T cells was significantly higher in low-risk group (mean=7.3, 95% CI 4.7 to 9.8) than high-risk group (mean=4.5, 95% CI 2.9 to 6.2) (paired t-test p=0.02) (figure 3A,B, online supplementary table S2). Furthermore, in eight pairs of patients (the remaining pairs were not tested for cytotoxicity due to insufficient samples in storage), our in vitro T cell killing assay indicated that donors in low-risk group showed higher T cell cytotoxicity against NSCLC cells than donors of high-risk group in both target cell models (p<0.05, figure 3C, online supplementary figure S9 and table S2). We also captured images showing process of T cell engaging an NSCLC cell (figure 3E).

Unfavorable genotypes (UFGs) in the T cell cancer immune response and T cell degranulation in vitro. CD107a degranulation assay was used to assess peripheral blood T cell degranulation phenotype in vitro in 19 pairs of healthy donors separated into low-risk group (0 or 1 UFG) and high-risk group (≥3 UFGs) matched by age, sex and smoking status. UFGs were based on genotypes of SNPs associated with survival, which show eQTL effects. (A) Representative flow cytometry plots of T cell degranulation are shown indicating high-risk group with lower percentage of CD8+CD107a+T cells than that of low-risk group (4.1% vs 11.6%). (B) Dot plot of T cell degranulation assay result shows high-risk group (red) displaying lower percentage of CD8+CD107 a T cells than that of low-risk group (blue) (paired t-test, p=0.02). Wide and narrow bars indicate median and 95% CI, respectively. (C) Temporal assessment of T cell cytotoxicity against A549 cells (left) and H460 cells (right) using T cells from 8 pairs and five pairs, respectively, of high-risk and low-risk donors. In both cell line models, high-risk UFG carriers (red) had significantly lower T cell cytotoxicity than that of low-risk UFG carriers (red line) (p<0.01) at most time points. (D) Expression of a panel of T cell function-related genes in all available T cell samples from healthy donors. Compared with low-risk group, high-risk group displayed significantly lower expression of T cell cytotoxicity genes IL2, PRF1 and GZMB (red) and T cell inhibitory checkpoint genes LAG3 and VISTA (blue) but higher IDO1 expression (*p<0.05). (E) Time-lapse images showing a T cell (in blue, white arrow) engaging an NSCLC cell (in green, yellow arrow) during the killing assay. Pink arrow indicates nuclear remnant of a dead cancer cell (in red). eQTL, expression Quantitative Trait Loci; IL-2, interleukin-2; NSCLC, non-small cell lung cancer; SNPs, single-nucleotide polymorphisms.
Furthermore, we evaluated the expression of a panel of T cell function-related genes in isolated CD3 +T cells before (baseline) and after (activated) coculture with NSCLC cells. In available samples, T cells from high-risk group displayed lower expression of IL2, GZMB, TNFA, LAG3, and VISTA, and higher expression of IDO1 than low-risk group (p<0.05, figure 3D).
Discussion
In this study, we identified and validated 7 SNPs that were significantly associated with early-stage NSCLC recurrence and seven variants associated with survival. A stratified analysis of a pooled population indicated that some SNPs had treatment-specific associations with NSCLC outcome, and that seven variants (groups 1 and 2) might serve as genomic markers for adjuvant chemotherapy. We also found evidences that some eQTL genotypes might modulate T cell cytolytic phenotype. Taken together, these results suggest that genetic variants in T cell cancer immune response genes may influence NSCLC outcomes and T cell functions, which could serve as potential prognostic and treatment markers.
Two variants, rs1964986 and rs1573618, located within the TRB (T cell receptor beta chain) locus, were associated with NSCLC recurrence. Indeed, intratumor heterogeneity of the T cell receptor repertoire, which involves the TRB gene, has been associated with predicted neoantigen heterogeneity and postsurgical recurrence in lung cancer.17 This finding is consistent with our results linking TRB variants and recurrence in early-stage NSCLC. However, due to the highly variable nature of T cell receptor, more research is necessary to decipher the exact mechanism by which TCR diversity influences NSCLC outcome. Similarly, IL2RB:rs3218339, SYK:rs10761395, PDCD1LG2:rs7854413, TRA:rs7155927 and CD4:rs3782736 were also associated with recurrence in this study. Associations of the identified SNPs with early-stage NSCLC recurrence have not been previously reported, therefore, our findings require further confirmation in independent studies.
IDO1:rs10108662 is the most significant SNP associated with survival, with the variant genotype correlated with higher death risk. IDO1 encodes indoleamine-2,3-dioxygenase 1, which can induce effector T cell dysfunction by depleting tryptophan and producing kynurenine.18 Higher IDO1 expression in tumors may link to poorer prognosis, stronger resistance to chemotherapy and immunotherapy in patients with cancer, and is tested as therapeutic target.19 20 Genetic variations in IDO1 have been associated with IDO enzyme activity,21 but no associations with clinical outcomes or T cell functions in patients with cancer are reported. In our study, IDO1:rs10108662 was associated with OS, and might affect IDO expression and T cell cytotoxicity, suggesting functional variant of this gene may influence NSCLC outcome through impacting T cell cancer immune response.
Two intronic SNPs (rs959260 and rs4789182) in GRB2 demonstrated strong association with survival. GRB2 encodes an adaptor protein that plays key roles in immune cell development and T cell costimulation.22 eQTL analysis suggested that variant genotypes of both genetic variants or other causal variants are potentially functional. We found that tumor tissues from TCGA data showed decreased GRB2 expression. Reduced GRB2 level could attenuate GRB2-SOS complex formation in the T cell receptor and IL-2 signaling pathways, thereby inhibiting IL-2 and interferon-γ secretion.23 Also, GRB2 was reported to regulate LCK signaling, one of the key signaling events in T cell activation.22 Therefore, variants in GRB2 may impact T cell function, and this hypothesis was further supported by our in vitro assays. More mechanistic studies are needed to identify the causal functional SNPs and to characterize the basis of genetic associations.
PSMD3:rs8080546 was associated with death risk in surgery-only patients during subgroup analysis by treatment. PSMD3 is involved in the presentation of class I major histocompatibility complex peptides.24 The variant genotype of this SNP correlated with increased PSMD3 expression that in turn might affect proteasome generation and subsequent antigen presentation. Excessive antigen stimulation may exhaust clonal T cells and impair T cell cytotoxicity.25 The association of several CUL1 variants (a cullin family gene involved in protein degradation26) with death risk suggests the importance of the antigen presentation pathway affecting NSCLC survival. Nevertheless, similar to most of the identified loci, both PSMD3 and CUL1 variants were located in intronic regions, so their functional implications remain unclear. Additional research is necessary to identify the causal associations.
Notably, we found a panel of treatment-specific SNPs predicting opposite recurrence or death risk for surgery-only and surgery-plus-chemotherapy patients. SNPs associated with favorable outcome for surgery-plus-chemotherapy group can help to identify patients with early-stage lung cancer who would benefit from adjuvant chemotherapy to minimize recurrence risk or to improve survival. Previous studies have implicated the immune genes we identified to be involved with chemotherapy outcome in cancer. For instance, STAT4 is a transcript factor that is activated by IL-12 signaling and promotes Th1-cell differentiation and interferon-gamma production. The reduction of STAT4 by chemotherapy might attenuate immunity against cancer in lymphoma.27 Also, TRB and TRA function might contribute to the antitumor effects of chemotherapeutic drugs.28 These findings indicated potential synergy between cancer immunotherapy and chemotherapy.29
In this study, we assessed eQTL SNPs that may affect T cell cytotoxicity in vitro. To minimize confounding effects of potential covariates, we focused on age-matched, sex-matched and smoking status-matched healthy participants distinguished by their UFG status. Compared with low-risk group, high-risk group displayed reduced T cell degranulation, which indicates lower level of T cell cytotoxicity. However, due to the small sample size and potential heterogeneity of participants, these findings should be interpreted with caution.
There are several strengths in this study, including a multi-phase study design with relatively large sample size, which may minimize chance findings. Additionally, we selected a comprehensive panel of cancer immune response-related genes and SNPs leveraging GWAS and OncoArray data for broad genotyping coverage and conducted bioinformatic analyzes and immune-related functional assay, which provided biological validity for some of our findings.
Our study also has some limitations. First, since the identified variants are from GWAS panel, they most likely tag causal variants that remain unknown. Second, two different platforms were used for genotyping in the discovery and validation cohorts, so the variation in SNP coverage may affect the identification of prognostic loci. The analysis of linked SNPs in the OncoArray panel to replace missing variants identified from discovery phase may not fully recapitulate the association signals. Third, our clinical data only include modalities for primary treatment, so any effects from secondary treatment on survival outcome could not be accounted for and might have influence on survival outcome. We used cryopreserved PBMCs for in vitro assay; therefore, the quality and storage of these samples could have affected T cell viability. However, we applied uniform standards and protocols to minimize systematic biases. Fourth, we only used two lung cancer cell lines to perform the T cell killing assay, which could not represent all subtypes of lung cancer. However, large cell lung cancer cell and squamous cell lung cancer (SqCC) share similar molecular profiles. The H460 lung cancer cell line is a large cell lung cancer cell line, which express comparable level of p53 to SqCC.30 A recent study on the genomic profiling of large cell lung cancer also shows that large cell lung cancer share similar genomic alterations with SqCC.31 Also, the in vitro T cell killing assay was designed to evaluate the antitumor cytotoxicity of CD8 + T cells from those donors, thereby compare the impact of genotypes on T cell phenotypes, not to evaluate different immune responses to lung cancer cell lines.32 During the assay, all the PBMCs were undergo same procedures, and co-cultured with same lung cancer cell lines. Therefore, we propose that the results will not alter much if we change the target lung cancer cells. Fifth, the molecular profile of NSCLCs in this study is not available. The molecular profile like TMB (tumor mutation burden), driver mutations in EGFR, KRAS, BRAF, ALK could impact the efficacy of immunotherapy in NSCLC patients.33 34 Lastly, no tumor-specific antigens from the target cells were used during T cell priming, so the measured cytotoxic effects were not tumor-specific. Nevertheless, a functional CD3 antibody was applied to activate T cells more specifically.
Conclusions
In summary, we found significant associations between common genetic variants in T cell cancer immune response pathways and clinical outcomes of patients with early-stage NSCLC. Specifically, we identified 14 SNPs that might predict death and recurrence risks in these patients, and the results were supported by various bioinformatic and phenotypic analyzes to provide biological plausibility and validity. The associated genetic variants may identify high-risk subjects for more intense surveillance or personalized treatment and possibly shed light on the link between T cell cancer immune response and NSCLC outcomes.
Acknowledgments
We would like to thank the excellent work of the field team and laboratory staff for patient recruitment and for collection and/or processing of clinical/epidemiological information and biological specimens.
References
Supplementary materials
Supplementary Data
This web only file has been produced by the BMJ Publishing Group from an electronic file supplied by the author(s) and has not been edited for content.
Footnotes
QW and JG contributed equally.
Correction notice This article has been corrected since it was published. The author name ‘Qinchuan Wang’ was incorrectly spelt as ‘Qinchaung Wang’.
Contributors XW involved in conception and design; QW, DWC and XW involved in development of methodology; QW, JG, DWC and LW participated in acquisition of data (acquired and managed patients, provided facilities, etc); QW, JG, YY, LW and involved in analysis and interpretation of data (eg, statistical analysis, biostatistics, computational analysis); YY, MH and QW involved in data management and analysis; XW and JAR involved in study supervision; All authors read and approved the final manuscript. QW,XW, DWC and YY contributed in the revision of the manuscript.
Funding This work was supported in part by grants from the Cancer Prevention and Research Institute of Texas (RP130502) and the National Cancer Institute (NIH) grants P50 CA070907 and R01 CA176568.
Competing interests None declared.
Patient consent for publication Not required.
Ethics approval The study was approved by MD Anderson's Institutional Review Board.
Provenance and peer review Not commissioned; externally peer reviewed.
Data availability statement The datasets used and analyzed during the current study are available on reasonable request.