Article Text

Abstract
Background Overexpression of programmed cell death protein 1 (PD-1) is linked to CD8+ T cell dysfunction and contributes to tumor immune escape. However, the prevalence and functional regulations of PD-1 expression on CD8+ T cells in human gastric cancer (GC) remain largely unknown.
Methods Flow cytometry was performed to analyze the level, phenotype, functional and clinical relevance of PD-1+CD8+ T cells in GC patients. Peripheral blood CD8+ T cells were purified and subsequently exposed to culture supernatants from digested primary GC tumor tissues (TSN) in vitro for PD-1 expression and functional assays. Tumor responses to adoptively transferred TSN-stimulated CD8+ T cells or to the TSN-stimulated CD8+ T cell transfer combined with an anti-PD-1 antibody injection were measured in an in vivo xenograft mouse model.
Results GC patients’ tumors showed a significantly increased PD-1+CD8+ T cell infiltration. However, these GC-infiltrating PD-1+CD8+ T cells showed equivalent function to their PD-1−CD8+ counterparts and they did not predict tumor progression. High level of transforming growth factor-β1 (TGF-β1) in tumors was positively correlated with PD-1+CD8+ T cell infiltration, and in vitro GC-derived TGF-β1 induced PD-1 expression on CD8+ T cells via Smad3 signaling, whereas Smad2 signaling was involved in GC-derived TGF-β1-mediated CD8+ T cell dysfunction. Furthermore, GC-derived TGF-β1-mediated CD8+ T cell dysfunction contributed to tumor growth in vivo that could not be attenuated by PD-1 blockade.
Conclusions Our data highlight that GC-derived TGF-β1 promotes PD-1 independent CD8+ T cell dysfunction. Therefore, restoring CD8+ T cell function by a combinational PD-1 and TGF-β1 blockade might benefit future GC immunotherapy.
- gastroenterology
- tumours
- immunology
This is an open access article distributed in accordance with the Creative Commons Attribution Non Commercial (CC BY-NC 4.0) license, which permits others to distribute, remix, adapt, build upon this work non-commercially, and license their derivative works on different terms, provided the original work is properly cited, appropriate credit is given, any changes made indicated, and the use is non-commercial. See http://creativecommons.org/licenses/by-nc/4.0/.
Statistics from Altmetric.com
Background
Gastric cancer (GC) is the fifth most frequent malignancies and the third leading cause of cancer death worldwide.1 Despite recent significant progress has been made in prevention and therapy, the prognosis of advanced GC patients remains poor.2 The development and progression of GC are influenced by the cross-talk between cancer cells and host immune elements, and a strong antitumor adaptive immunity in the GC microenvironment is associated with a better clinical outcome.3 4 Nevertheless, although immune cell infiltration in GC is frequently observed, their antitumor potential are often limited.5
CD8+ T cells play a crucial role in the adaptive immune response against cancer. Once activated, CD8+ T cells secrete cytokines and cytolytic molecules to kill tumor cells.6 7 However, many studies focusing on the role of CD8+ T cells in cancer have shown that the effector function of these cells is gradually lost during tumor progression.8–10 This CD8+ T cell functional defect is closely reflected by the upregulation of immune checkpoint molecules such as programmed cell death protein 1 (PD-1), T cell immunoglobulin and mucin domain-containing molecule 3 (Tim-3) and B- and T-lymphocyte attenuator (BTLA).11–14 Among them, PD-1 has been regarded as a surrogate marker of CD8+ T cell exhaustion, and immunotherapy of blocking the interaction between PD-1 and its ligand PD-L1 is able to restore CD8+ T cell function resulting in tumor regression.15 However, it should be noted that PD-1 signaling is not essential for the induction of CD8+ T cell exhaustion,16 and recent studies show that CD8+ T cells retain poly-functionality in human breast cancer and non-small cell lung cancer despite PD-1 expression.17 18 Thus, whether PD-1 expression on GC-infiltrating CD8+ T cells represents a functionally defective marker remains to be elucidated. Additionally, the checkpoint inhibitors to PD-1 in human GC have achieved limited success as clinical responses to anti-PD-1 immunotherapy were only observed in a minority of the patients and no overall benefit was shown in the clinical trials conducted.19 20 These results emphasize a need for further understanding of the underlying dysfunctional mechanism of antitumor immunity in GC.
In the present study, we investigated the functional potential of GC-infiltrating PD-1+CD8+ T cells. Our data show that increased PD-1 expression on GC-infiltrating CD8+ T cells is not associated with their dysfunction, for GC-derived transforming growth factor-β1 (TGF-β1) inhibits the effector function of CD8+ T cells independent of PD-1 expression. These findings suggest that restoring CD8+ T cell function by a combinational PD-1 and TGF-β1 blockade might have further clinical implications for GC immunotherapy.
Material and methods
Patients and samples
Fresh peripheral blood, tumor tissues and adjacent non-tumor tissues (at least 5 cm distant from the tumor site) were obtained from a cohort of 50 GC patients during surgery between November 2017 and November 2019 at the First Affiliated Hospital of the Third Military Medical University. None of the patients had received chemotherapy or radiotherapy before sampling, and patients with autoimmune diseases, infectious diseases or multiprimary cancer were excluded. The blood and tissue samples were used to isolate peripheral and tissue-infiltrating cells for flow cytometry analysis, and paraffin-embedded tissue samples from the same cohort were used for immunohistochemistry analysis. The clinical stages of tumors were determined according to the Tumor-Node-Metastasis (TNM) classification system of International Union against Cancer (Edition 7). The clinical characteristics of GC patients are present in online supplementary table 1.
Supplemental material
Cell isolation
Non-tumor and tumor tissues were used for obtaining cell suspensions as previously described.21 Briefly, tissues were cut into small pieces and collected in RPMI-1640 medium containing 1 mg/mL collagenase IV (Gibco, Carlsbad, CA) and 10 mg/mL DNase I (Invitrogen, Carlsbad, CA), then mechanically dissociated by using the gentle MACS Dissociator (Miltenyi Biotec, Auburn, CA). Dissociated cell suspensions were further incubated for 1 hour at 37°C under continuous rotation and filtered through 40 µM cell strainers to obtain single-cell suspensions. The cell suspensions were then used for flow cytometry analysis. Cell viability was typically >90% by trypan blue exclusion staining. Peripheral blood mononuclear cells (PBMCs) were isolated by density gradient centrifugation using Ficoll-Paque Plus (GE Healthcare).
Flow cytometric analysis
Cells were stained with appropriate surface antibodies, then fixed and permeabilized for 20 min using Cytofix/Cytoperm reagent (BD Biosciences), and subsequently stained with antibodies to intracellular molecules granzyme B and perforin. For intracellular cytokine IFN-γ and TNF-α staining, the cells were stimulated for 4 hours with Leukocyte Activation Cocktail (BD Biosciences) before staining. The fluorochrome-labeled antibodies are listed in online supplementary table 2.
Immunohistochemistry
Paraffin-embedded samples were cut into 5 µM sections. After being deparaffinized and hydrated, the sections in Tris-EDTA buffer (pH 9.0) were subjected to heat-induced antigen retrieval in a microwave oven, and then treated with 3% hydrogen peroxide. Following incubation with goat antihuman PD-1 antibody (R&D systems, Minneapolis, MN) overnight at 4°C, slides were treated with horseradish peroxidase-conjugated secondary antigoat antibody (Zhongshan Golden Bridge Biotech, Beijing, China) and then 3,3′-diaminobenzidine tetrahydrochloride. For colocalization analysis, after PD-1 staining, sections were stained with a mouse antihuman CD8 antibody (DAKO, Glostrup, Denmark), and visualized using EnVision G2 System/AP Rabbit/Mouse (PermanentRed) (DAKO). Slides were examined using a microscope (Nikon, Tokyo, Japan).
Preparation of culture supernatant
Tumor and adjacent non-tumor tissues from GC patients were digested into cell suspensions, washed in phosphate buffer saline and resuspended at 1×10⁶ cells/mL in complete RPMI-1640 medium in 6-well plates. After 48 hours, the supernatants were harvested by centrifugation and stored at −80°C.
Enzyme-linked immunosorbent assay
The homogenized tissue supernatants or cell culture supernatants were analyzed for TGF-β1, interferon-γ (IFN-γ), tumor necrosis factor-α (TNF-α), granzyme B and perforin using specific enzyme-linked immunosorbent assay kits in accordance with the manufacturer’s recommendations (Dakewei Biotech, China).
Culturing and stimulating CD8+ T cells
CD8+ T cells were purified from PBMCs of healthy individuals by positive selection using the EasySep human CD8+ T cell enrichment kit (Stem cell, Vancouver, Canada). CD8+ T cells were seeded in 96-well round bottom plates at 2×10⁵ cells/well in RPMI-1640 containing 10% fetal calf serum (Gibco, Uruguay), and were activated with precoated anti-CD3 (2 µg/mL) and anti-CD28 (1 µg/mL) antibodies (Biolegend, San Diego, CA) in the presence or absence of 10 ng/mL rhTGF-β1 (Peprotech, Rocky Hill, NJ) or 30% (v/v) culture supernatants from digested primary GC tumor tissues (TSN) or culture supernatants from digested adjacent non-tumor tissues (NTSN). In some experiments, CD8+ T cells were cultured in the presence of 30% TSN with or without an anti-TGF-β1 neutralizing antibody (10 µg/mL, Abcam, Cambridge, UK). In some cases, CD8+ T cells were pretreated with 10 µM of the Smad3-specific inhibitor SIS3 (MedChem Express, Monmouth Junction, NJ) or dimethyl sulfoxide (DMSO) for 1 hour following stimulation with 30% TSN, or CD8+ T cells were activated with precoated anti-CD3 (2 µg/mL) and anti-CD28 (1 µg/mL) antibodies for 24 hours, and subsequently lentiviral particles containing Smad2 shRNA (shSmad2, Santa Cruz Biotechnology) or control shRNA (shNC, Santa Cruz Biotechnology) were added. After 72 hours transduction, cells were washed and then exposed to 30% TSN. After 72 hours, plated cells were collected for flow cytometry analysis.
In vivo tumor inhibition assay
Animal experiments were approved by the Animal Ethical and Experimental Committee of Third Military Medical University. 1×10⁶ GC cells (SGC-7901) in 100 µL of buffered saline were subcutaneously injected into the axillary tissues of female NOD/SCID mice (5–7 week-old). 5×10⁶ anti-CD3 and anti-CD28-stimulated polyclonal CD8+ T cells were cultured in the presence of 30% TSN for 72 hours, and subsequently injected into the tumor (on day 7 after tumor inoculation) in 100 µL of buffered saline alone or in combination with an intraperitoneal injection of anti-PD-1 antibody (BioXCell, West Lebanon, NH) at 250 µg per mouse (days 7, 10 and 14). Tumor size was measured every 2 days by two independent observers using calipers fitted with a vernier scale. Tumor volume was calculated based on three perpendicular measurements. Tumor volumes (V) were calculated with the formula: V=A × B2/2 (A=axial diameter; B=rotational diameter). After 21 days of treatment, mice were sacrificed, and tumors were collected for further analysis.
Statistical analysis
All results were summarized as mean±SEM, and statistical analysis was performed with the Prism 7.0 Software. Differences between groups were evaluated by two-tailed Student’s t test. When variance was detected, Mann–Whitney U tests were used to analyze the difference between groups. The correlation analysis between groups was determined by Spearman’s correlation test. p<0.05 was considered as statistically significant.
Results
PD-1 expression is increased on CD8+ T cells in tumors of GC patients
Using flow cytometry, we first analyzed the expression of PD-1 on CD8 + T cells in the peripheral blood, non-tumor and tumor tissues of 50 GC patients (figure 1A,B). In comparison with peripheral blood, the percentages of tissue-infiltrating PD-1+CD8+ T cells were significantly increased. Within patient’s tissues, the percentages of PD-1+CD8+ T cells in tumors were also significantly higher than those in non-tumor tissues. Similar observations were made when analyzing PD-1 expression as the mean fluorescence intensity . Additionally, compared with non-tumor tissues, the absolute number of PD-1+CD8+ T cells per million cells in each tumor sample was significantly increased (online supplementary figure S1a). Immunohistochmical staining further showed that tumors contained a large fraction of CD8+ T cells expressing PD-1, and the infiltrating PD-1+ cells in tumors were also more than those infiltrating adjacent non-tumor tissues (figure 1C and online supplementary figure S1b). These data demonstrate that tumor-infiltrating PD-1+CD8+ T cells are increased in GC.

PD-1 expression on CD8+ T cells in the peripheral blood, non-tumor and tumor tissues of 50 GC patients. (A) A representative flow cytometry analysis of PD-1 expression in the peripheral blood, non-tumor and tumor tissues of the same patient. Peripheral blood, non-tumor and tumor tissue-derived cell suspensions were stained with CD45, CD3, CD8 and PD-1 antibodies, and then PD-1+CD8+ T cell percentages were analyzed after gating on CD3+CD8+ T lymphocytes. (B) The percentages and mean fluorescence intensity of PD-1+ cells in CD3+CD8+ T lymphocytes were statistically analyzed in the peripheral blood, non-tumor and tumor tissues of 50 GC patients. (C) A representative immunohistochemical staining of PD-1+ cells (brown) from paraffin non-tumor and tumor tissue sections of the same patient, and immunohistochemical staining of PD-1+ cells (brown) and CD8+ cells (red) on the same section of non-tumor tissues and tumor tissues. Scale bars=100 µM. ***p<0.001: Student’s t test. GC, gastric cancer; PD-1, programmed cell death protein 1.
We further investigated the implications of having tumor-infiltrating PD-1+CD8+ T cells with regard to GC progression (online supplementary figure S2). No correlation was found between the percentages of tumor-infiltrating PD-1+CD8+ T cells and TNM stages, tumor size, tumor invasion, lymph node and distant metastasis, neural and vascular invasion status, Helicobacter pylori infection status, age, gender and histologic type. And no significant impact of tumor-infiltrating PD-1+CD8+ T cells on overall survival of these GC patients was seen when using the medium value of all tumor-infiltrating PD-1+CD8+ T cell percentages as a comparison point. These results suggest that increased tumor-infiltrating PD-1+CD8+ T cells, at least at the detected levels in this study, are not associated with GC progression and patients’ overall survival.
Phenotypic features of GC-infiltrating PD-1+CD8+ T cells
Next we studied the differentiation status of PD-1+CD8+ T cells at tumor site. CD8+ T cells were identified as naive (Tn, CD45RA+CD27+), central memory (Tcm, CD45RA−CD27+), effector memory (Tem, CD45RA−CD27−) and terminally differentiated effector memory (Temra, CD45RA+CD27−) (figure 2A). We observed that CD8+ T cells in the peripheral blood were mainly composed of Tem and Temra subsets. However, tissue-infiltrating CD8+ T cells were primarily composed of Tem cells, and the percentages of Tn, Tcm and Temra subsets were sharply decreased and significantly lower than those in the peripheral blood (figure 2B). PD-1+CD8+ T cells in tumors also predominantly belonged to Tem subset, and the populations of Tn, Tcm and Temra subsets were similar to those of PD-1−CD8+ counterparts (online supplementary figure S3a), suggesting that the majority of GC-infiltrating PD-1+CD8+ T cells are effector memory cells.

Phenotypic features of GC-infiltrating CD8+ T cells and PD-1+CD8+ T cells. (A) A representative flow cytometry analysis of a GC patient showing percentages of different CD3+CD8+ T cell populations indicated by CD45RA and CD27 expression: Tn (CD45RA+CD27+), Tcm (CD45RA−CD27+), Tem (CD45RA−CD27−) and Temra (CD45RA+CD27−). Peripheral blood, non-tumor and tumor tissue-derived cell suspensions were stained with CD3, CD8, CD45RA and CD27 antibodies, the expression of CD45RA versus CD27 were analyzed after gating on CD3+CD8+ T lymphocytes. (B) Statistical analysis of the percentages of different CD3+CD8+ T cell populations in tumor tissues of 13 GC patients. (C) Flow cytometry analysis was used to determine the phenotypic characteristics of the following: CD8+ T cells from paired blood, non-tumor and tumor tissues; PD-1+CD8+ and PD-1−CD8+ T cells from tumor tissues. Data represent mean of at least four GC patients (n=4–10). (D) Tumor-derived cell suspensions were stained with CD3, CD8, PD-1, CD69 and CD103 antibodies. Cells were divided into PD-1+ and PD-1− subsets after gating on CD3+CD8+ T lymphocytes, and the expression of CD69 and CD103 was analyzed from 10 GC patients. (E) A representative flow cytometry analysis for the expression of Eomes and T-bet in PD-1+CD8+ and PD-1−CD8+ T cells from tumor tissues. (F) Statistical analysis of the percentages of Eomes and T-bet expression between PD-1+CD8+ and PD-1−CD8+ T cells from tumor tissues of 4 GC patients. *p<0.05, **p<0.01, ***p<0.001: Mann–Whitney U tests (B), Student’s t test (C–E). GC, gastric cancer; PD-1, programmed cell death protein 1.
We further characterized the expression of surface molecules and transcription factors of PD-1+CD8+ T cells from tumor tissues. Compared with PD-1−CD8+ T cells, there was no significant difference for the expression of costimulatory molecule CD28 and lymph node homing marker CCR7 on GC-infiltrating PD-1+CD8+ T cells, and the levels of coinhibitory molecules Tim-3, 2B4, CD160 and BTLA expression were also similar between them (figure 2C and online supplementary figure S3b). However, the levels of activation molecule CD69 and integrin molecule CD103 expression on PD-1+CD8+ T cells were significantly higher than those on PD-1−CD8+ T cells (figure 2D). In addition, the proportion of PD-1+CD8+ T cells with dysfunctional Eomes+T-bet− phenotype was slightly lower than that of PD-1−CD8+ T cells (figure 2E,F). These findings suggest that GC-infiltrating PD-1+CD8+ T cells might display a non-exhausted phenotype compared with their PD-1−CD8+ counterparts.
Increased PD-1 expression is not linked to GC-infiltrating CD8+ T cell dysfunction
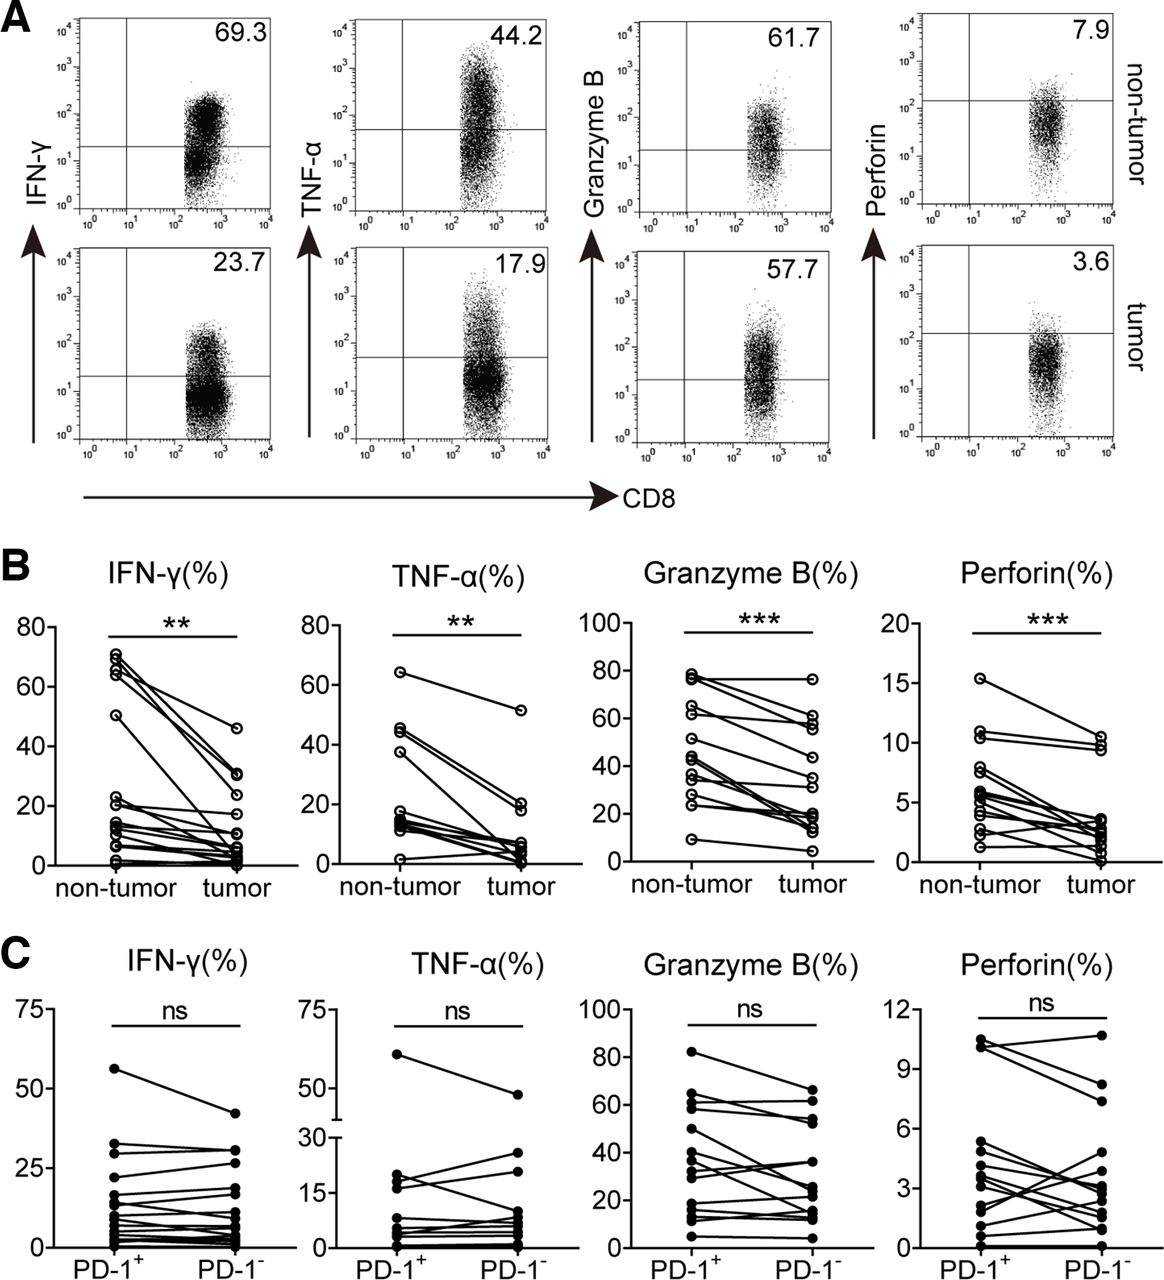
Based on the phenotypic profile of PD-1+CD8+ T cells, we investigated whether increased PD-1 expression could influence CD8+ T cell effector function in tumors. Polyclonal stimulation was used for analyzing their cytokines, IFN-γ and TNF-α, production capacity. We observed that the percentages of IFN-γ and TNF-α-producing CD8+ T cells in tumors were significantly lower than those in non-tumor tissues. Furthermore, compared with non-tumor tissues, the expression of intracellular cytolytic granzyme B and perforin in tumor-infiltrating CD8+ T cells was also significantly decreased (figure 3A,B), suggesting that the potentiality of producing cytokines and cytolytic molecules of CD8+ T cells is inhibited in GC tumors. However, the proliferative capacity of these CD8+ T cells might be not altered, for there was no significant difference on the expression of proliferation-associated marker Ki-67 between non-tumor and tumor-infiltrating CD8+ T cells (online supplementary figure S4a). We further gated on PD-1+and PD-1− subsets of CD8+ T cells in tumors and compared their polyfunctional potential. Unexpectedly, the levels of IFN-γ, TNF-α, granzyme B, perforin and Ki-67 expression in tumor-infiltrating PD-1+CD8+ T cells were all similar to their PD-1−CD8+ counterparts (figure 3C and online supplementary figure S4b), suggesting that increased PD-1 expression on CD8+ T cells in these GC tumors does not implicate their dysfunction.

Functional characteristics of GC-infiltrating CD8+ T cells and PD-1+CD8+ T cells. (A) A representative flow cytometry analysis of IFN-γ, TNF-α, granzyme B and perforin expression in CD3+CD8+ T cells from paired non-tumor and tumor tissues of the same patient.(B) Statistical analysis of IFN-γ+, TNF-α+, granzyme B+ and perforin+ cell percentages in CD3+CD8+ T cells from non-tumor and tumor tissues of GC patients. (C) Statistical analysis of IFN-γ+, TNF-α+, granzyme B+ and perforin+ cell percentages in PD-1+ and PD-1− subsets of CD3+CD8+ T lymphocytes in tumors of GC patients. Symbols represent individual values from 12 to 17 GC patients analyzed individually. **p<0.01; ns, not significant: Student’s t test. GC, gastric cancer; PD-1, programmed cell death protein 1.
GC-derived TGF-β1 induces PD-1 expression and dysfunction of CD8+ T cells
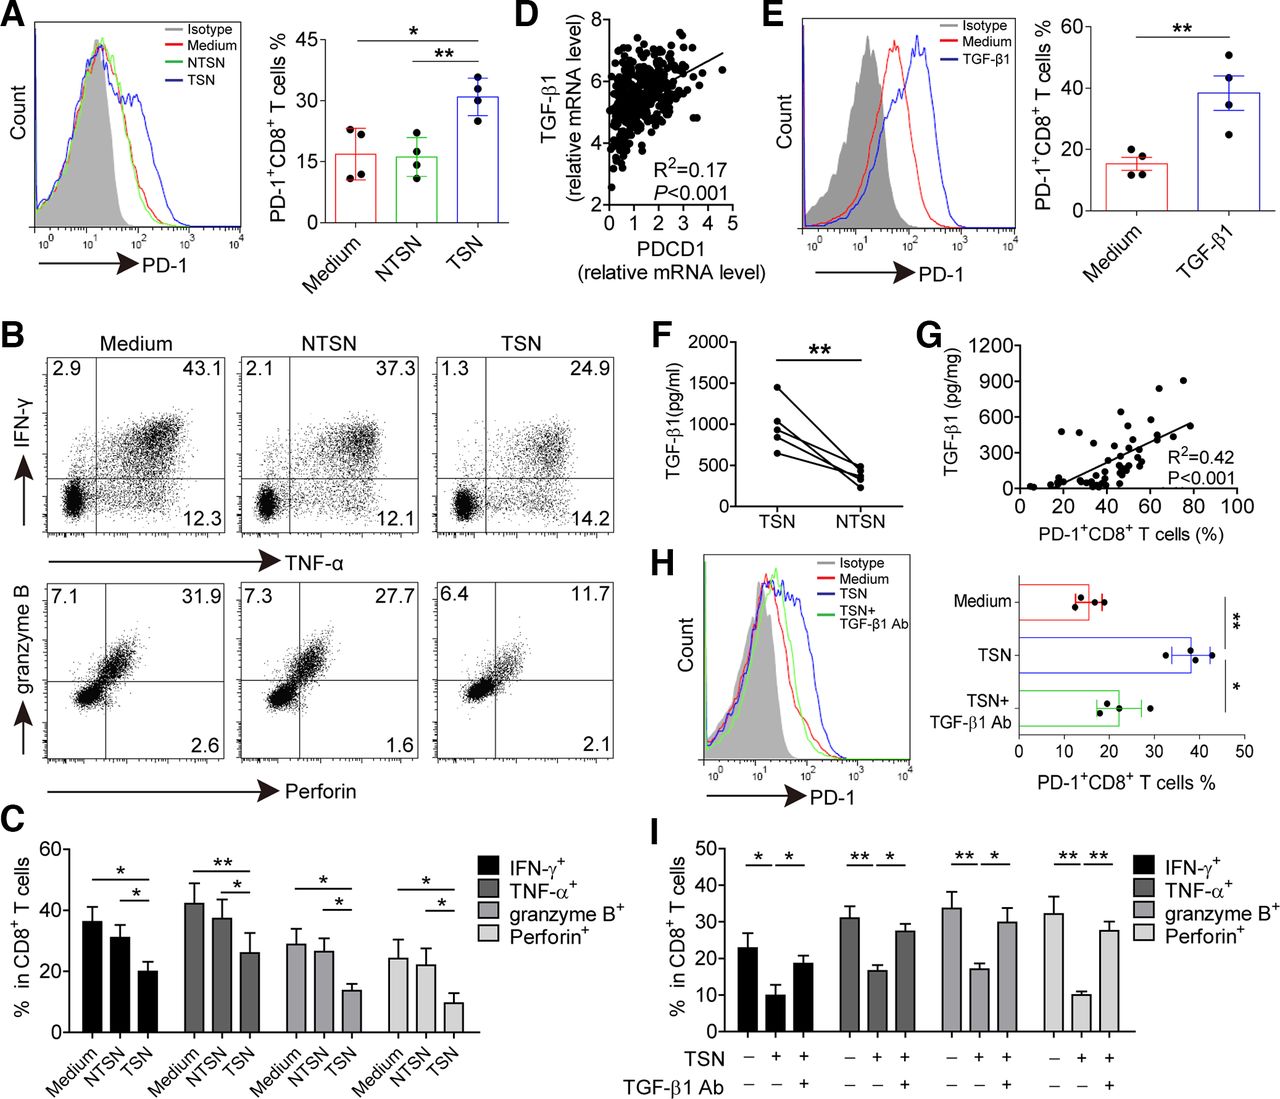
Having found the presence of an increased level of PD-1+CD8+ T cells in tumors, we hypothesized that GC microenvironment might have contributed to PD-1 expression on CD8+ T cells. TSN or NTSN were used to stimulate CD8+ T cells. TSN showed a great potential to induce PD-1 expression on CD8+ T cells with increased levels of CD69 and CD103, whereas NTSN failed to upregulate the expression of PD-1 as well as CD69 and CD103 on CD8+ T cells (figure 4A and online supplementary figure S5). In addition, the production of IFN-γ, TNF-α, granzyme B and perforin in TSN-treated CD8+ T cells was significantly lower than NTSN-treated CD8+ T cells (figure 4B,C), implying that GC-derived soluble factor(s) induced PD-1 expression and dysfunction of CD8+ T cells.

GC-derived TGF-β1 contributes to PD-1 expression and dysfunction of CD8+ T cells. (A) CD8+ T cells were purified from PBMCs and exposed to 30% (v/v) TSN or NTSN for 72 hours in the presence of anti-CD3 and anti-CD28 antibodies; then the percentages of PD-1 expression on CD8+ T cells were analyzed (n=4). (B) Representative dot-plots of IFN-γ, TNF-α, granzyme B and perforin expression in CD8+ T cells treated with NTSN or TSN for 72 hours. (C) Statistical analysis of IFN-γ+, TNF-α+, granzyme B+ and perforin+ cell percentages in NTSN-treated and TSN-treated CD8+ T cells (n=3). (D) A correlation analysis between PD-1 transcript (PDCD1) level and TGF-β1 mRNA level in 384 GC patients from TCGA data set. (E) CD8+ T cells were cultured for 72 hours with 10 ng/mL rhTGF-β1 in the presence of anti-CD3 and anti-CD28 antibodies, and then the expression of PD-1 on CD8+ T cells were analyzed by flow cytometry (n=4). (F) Statistical analysis of the concentrations of TGF-β1 in the TSN and NTSN obtained from 5 GC patients. (G) A correlation analysis between TGF-β1 concentrations and the percentages of PD-1+CD8+ T cells in tumors from 50 GC patients. (H) The expression of PD-1 on CD8+ T cells exposed to 30% TSN with an anti-TGF-β1 neutralizing antibody (10 µg/mL) for 72 hours in the presence of anti-CD3 and anti-CD28 antibodies (n=4). (I) CD8+ T cells were exposed to 30% TSN with an anti-TGF-β1 neutralizing antibody (10 µg/mL) for 72 hours in the presence of anti-CD3 and anti-CD28 antibodies, and their IFN-γ, TNF-α, granzyme B and perforin expressions were determined by flow cytometry (n=3). *p<0.05, **p<0.01: Student’s t test (A, C, E,F, H, I), Spearman’s correlation test (D, G). GC, gastric cancer; NTSN, culture supernatant from digested adjacent non-tumor tissues; PBMCs, peripheral blood mononuclear cells; PD-1, programmed cell death protein 1; TCGA, The Cancer Genome Atlas; TSN, culture supernatant from digested primary GC tumor tissues.
Next we sought to define which soluble factor(s) induced PD-1 expression and dysfunction of CD8+ T cells. Gene Set Enrichment Analysis was performed to identify pathways that were activated in PD-1high tumors as compared with PD-1low tumors, and we found cytokine–cytokine receptor interaction as one of the most significantly upregulated pathways (online supplementary figure S6). Thus, we speculated that soluble cytokine(s) induced PD-1 expression on CD8+ T cells. Our previous studies screened cytokines expression in tumor tissues by microarrays,22 and hence we analyzed the relationship between PD-1 expression and highly expressed cytokines including TGF-β1, M-CSF, G-CSF, IL-1β, IL-17A, IL-6, IL-23, TNF-α, IL-10, GM-CSF and IFN-γ. TCGA data showed that TGF-β1, CSF-1 (M-CSF transcript), IL-17A, IL-23, TNF-α, IL-10 and IFN-γ mRNA level was positively correlated with PDCD1 (PD-1 transcript) mRNA level. However, we found that only TGF-β1 significantly induced PD-1 expression, while CD8+ T cells were stimulated with these cytokines separately (figure 4D,E and online supplementary figure S7), but both TGF-β1 and IL-10 could mediate CD8+ T cell dysfunction (online supplementary figure S8). Nevertheless, no significant difference was observed for the level of IL-10 between TSN and NTSN (online supplementary figure S9), whereas the concentration of TGF-β1 in TSN was significantly higher than that in NTSN (figure 4F). In addition, there was also clearly a positive correlation between TGF-β1 concentration and PD-1+CD8+ T cell percentage in GC tumors (figure 4G). Furthermore, when TGF-β1-neutralizing antibody was added in the culture containing TSN, PD-1-expressing CD8+ T cells decreased significantly (figure 4H), and the suppressive effect on IFN-γ, TNF-α, granzyme B and perforin production in these CD8+ T cells was also attenuated (figure 4I and online supplementary figure S10). Therefore, these data indicate that GC-derived TGF-β1 could simultaneously induce PD-1 expression and dysfunction of CD8+ T cells.
GC-derived TGF-β1 induces Smad3-dependent PD-1 expression and Smad2-dependent dysfunction of CD8+ T cells
To address whether GC-derived TGF-β1-induced PD-1 expression is involved in CD8+ T cell dysfunction, the downstream molecules of TGF-β1 signaling cascade were investigated. CD8+ T cells were first pretreated with a TGF-β receptor I (TGF-βRI) kinase inhibitor (Galunisertib) and then exposed to TSN. Galunisertib-mediated TGF-βRI signaling was inhibited as shown by a diminished phosphorylation level of Smad2/3 in TSN-treated CD8+ T cells, and TSN-induced increase of PD-1 expression on CD8+ T cells was also significantly inhibited by Galunisertib (online supplementary figure S11). Given that Smad3 was the key mediator of TGF-β1-induced PD-1 expression,23 CD8+ T cells were further pretreated with the Smad3 specific inhibitor (SIS3), and then stimulated with TSN to explore their polyfunctional capacity. We found that TSN-induced PD-1 expression of CD8+ T cells was significantly inhibited by SIS3, and their levels were comparable to that on the control group (figure 5A,B), confirming that TSN-induced PD-1 expression was indeed Smad3-dependent. Unexpectedly, compared with TSN plus DMSO-treated CD8+ T cells, there was no significant difference for the production of IFN-γ, TNF-α, granzyme B and perforin in TSN plus SIS3-treated CD8+ T cells (figure 5C and online supplementary figure S12), suggesting that Smad3-dependent PD-1 expression is not involved in GC-derived TGF-β1-mediated CD8+ T cell dysfunction.
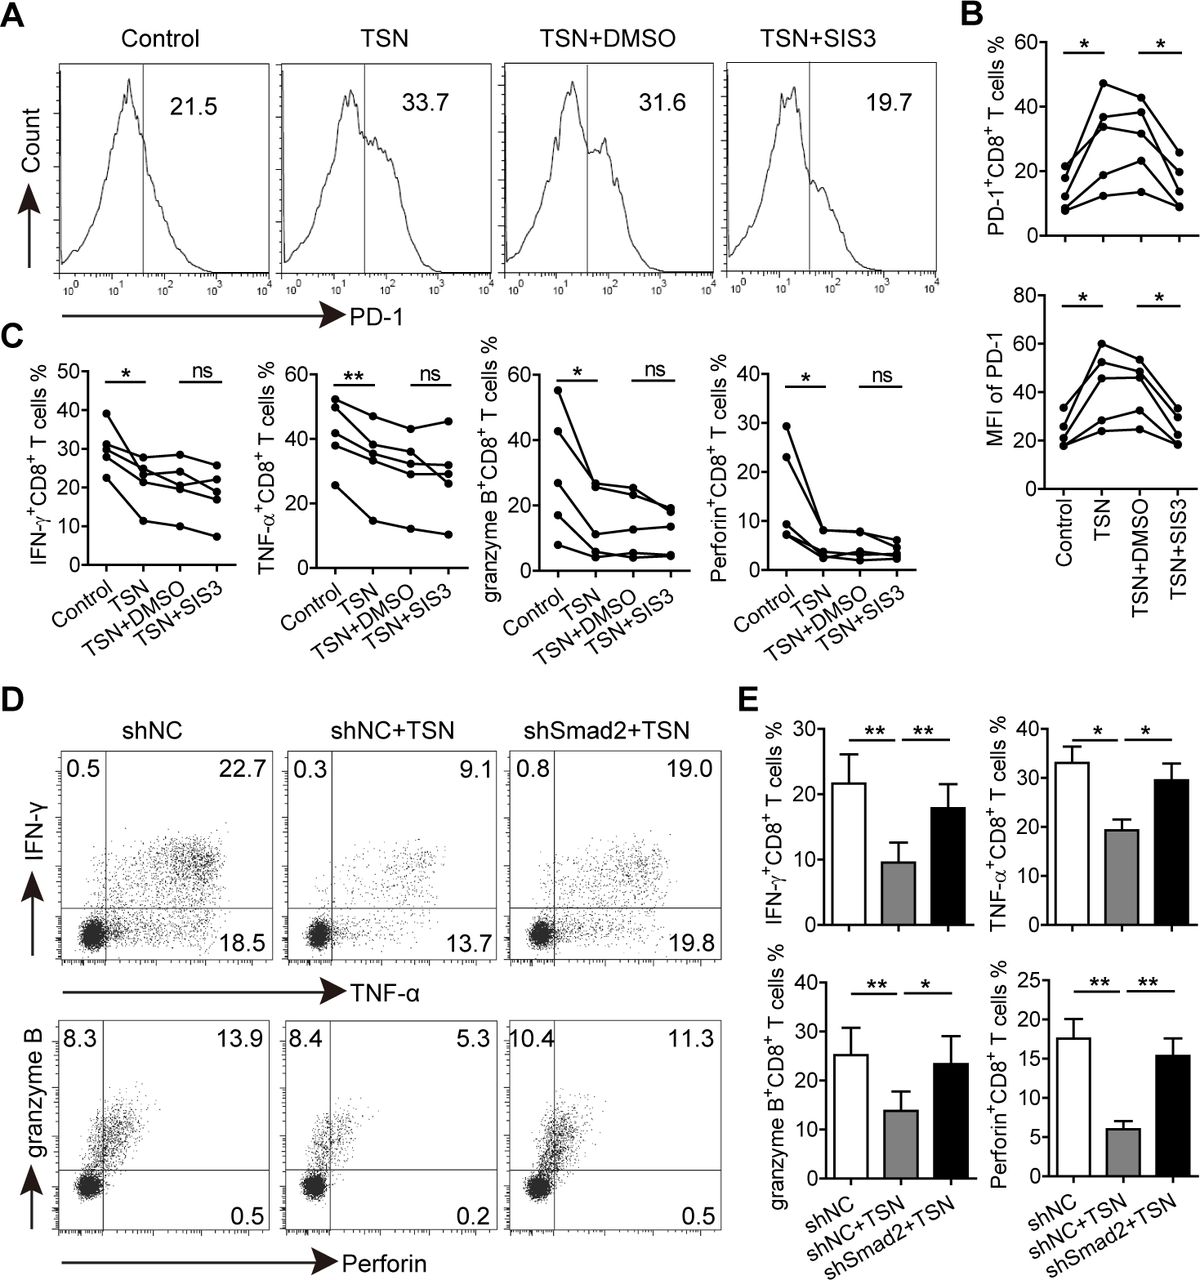
GC-derived TGF-β1 induces Smad3-dependent PD-1 expression and Smad2-dependent CD8+ T cell dysfunction. (A) CD8+ T cells were purified from PBMCs, pretreated with SIS3 or DMSO for 1 hour, and then exposed to 30% TSN for 72 hours in the presence of anti-CD3 and anti-CD28 antibodies. The expression of PD-1, IFN-γ, TNF-α, granzyme B and perforin of these CD8+ T cells were analyzed. (B) Statistical analysis of PD-1+ cell percentages and mean fluorescence intensity of CD8+ T cells from different groups (n=5). (C) Statistical analysis of IFN-γ+, TNF-α+, granzyme B+ and perforin+ cell percentages in CD8+ T cells from different groups (n=5). (D) CD8+ T cells transduced with lentiviral particles containing shSmad2 or shNC were exposed to 30% TSN for 72 hours in the presence of anti-CD3 and anti-CD28 antibodies, and then the expression of IFN-γ, TNF-α, granzyme B and perforin in these CD8+ T cells were analyzed by flow cytometry. (E) Statistical analysis of IFN-γ+, TNF-α+, granzyme B+ and perforin+ cell percentages in CD8+ T cells from different groups (n=4). *p<0.05, **p<0.01: Student’s t test. GC, gastric cancer; PD-1, programmed cell death protein 1; TSN, culture supernatant from digested primary GC tumor tissues.
Next we investigated the role of Smad2 in GC-derived TGF-β1-mediated CD8+ T cell dysfunction. CD8+ T cells were transduced with lentiviruses containing Smad2 shRNA to silence Smad2 expression (online supplementary figure S13), and subsequently exposed to TSN. We found that knocking down Smad2 expression abrogated TSN-mediated CD8+ T cell dysfunction as the production of IFN-γ, TNF-α, granzyme B and perforin in TSN plus shSmad2-treated CD8+ T cells was significantly higher than that in TSN plus shNC-treated CD8+ T cells (figure 5D,E), implying an involvement of Smad2 in the process.
PD-1 blockade could not reverse GC-derived TGF-β1-mediated CD8+ T cell dysfunction and tumor growth
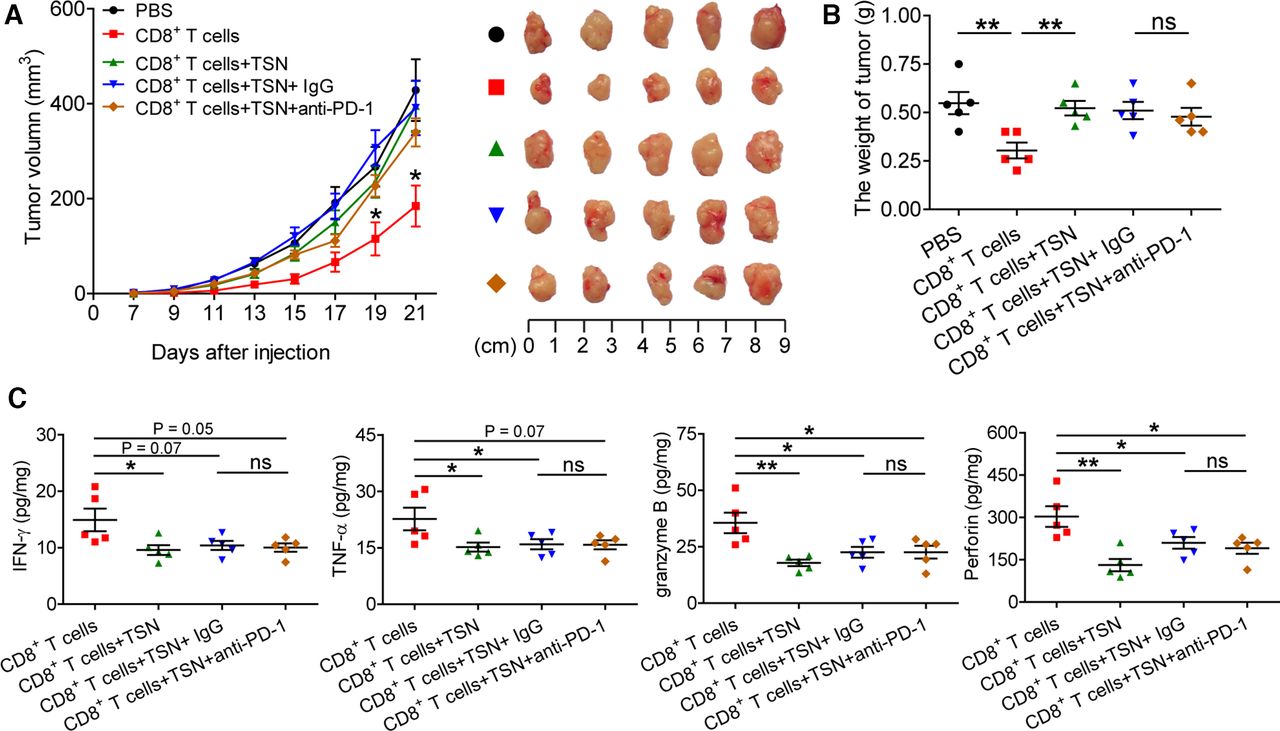
To further delineate the relation of PD-1 expression and TGF-β1-mediated CD8+ T cell dysfunction in vivo, TSN-treated CD8+ T cells were injected into our established human NOD/SCID mice bearing SGC-7901-derived GC in the presence or absence of PD-1 blocking antibody, for CD8+ T cells activated in vitro specifically exhibited the cytotoxic activity toward SGC-7901 cells (online supplementary figure S14). Expectedly, compared with mice with CD8+ T cell transfusions, mice without CD8+ T cell transfusions and mice transfused with TSN-treated CD8+ T cells showed increased tumor volumes, and an anti-PD-1 blocking antibody was not able to attenuate tumor growth and disease progression of mice transfused with TSN-treated CD8+ T cells (figure 6A,B), for the tumor volume and weight were similar between mice transfused with TSN-treated CD8+ T cells plus control IgG and mice transfused with TSN-treated CD8+ T cells plus an anti-PD-1 blocking antibody. Moreover, compared with mice with CD8+ T cell transfusions, the levels of human IFN-γ, TNF-α, granzyme B, perforin were significantly decreased in tumors from mice transfused with TSN-treated CD8+ T cells or TSN-treated CD8+ T cells plus an anti-PD-1 blocking antibody or control IgG (figure 6C). However, there was no significantly difference for the levels of IFN-γ, TNF-α, granzyme B, perforin in tumors between mice transfused with TSN-treated CD8+ T cells plus an anti-PD-1 blocking antibody and mice TSN-treated tumor-reactive CD8+ T cells plus control IgG. These data suggest that GC-derived TGF-β1-mediated CD8+ T cell-dysfunction in vivo contributes to tumor growth and GC progression that is not attenuated by PD-1 blockade.

PD-1 blockade fails to reverse GC-derived TGF-β1-mediated CD8+ T cell dysfunction and tumor growth in vivo. (A) Mice were injected with human SGC-7901 cells, as described in Materials and methods. The control animals received no further injections. The experimental mice were further injected with TSN-treated or untreated human CD8+ T cells, or TSN-treated human CD8+ T cells plus an anti-PD-1 antibody or control IgG. The illustrated data represent tumor volumes (five mice in each group). The day of tumor cell injection was counted as day 0. *p<0.05, for groups injections with human CD8+ T cells compared with groups injections with TSN-treated human CD8+ T cells, or TSN-treated human CD8+ T cells plus an anti-PD-1 antibody or control IgG. The tumors were excised and photographed on day 21 after tumor cell injection. (B) The weights of tumors were compared. (C) Human IFN-γ, TNF-α, perforin and granzyme B productions in mouse tumors were compared. The horizontal bars represent mean values. *p<0.05; **p<0.01; ns, not significant: Student’s t test. GC, gastric cancer; PD-1, programmed cell death protein 1; TSN, culture supernatant from digested primary GC tumor tissues.
Discussion
In the present study, we demonstrated that GC-infiltrating PD-1+CD8+ T cells were significantly increased, but these cells displayed a similar effector function to PD-1−CD8+ T cells in the same tumor area. TGF-β1 concentrations in tumors were positively correlated with the percentages of PD-1+CD8+ T cells, and in vitro GC-derived TGF-β1 could induce PD-1 expression on CD8+ T cells in a Smad3-dependent manner, whereas such GC-derived TGF-β1-mediated CD8+ T cell dysfunction was Smad2-dependent. Additionally, GC-derived TGF-β1-mediated CD8+ T cell dysfunction contributed to tumor growth in vivo that could not be attenuated by PD-1 blockade. These findings indicate that PD-1 does not mark GC-infiltrating CD8+ T cell dysfunction, and in-depth characterization of CD8+ T cell dysfunctional regulation would have significant clinical implications for the immunotherapy against GC.
PD-1+CD8+ T cell infiltration in human cancer has been extensively examined, including GC.24–26 It has been reported that PD-1+CD8+ T cells in the peripheral blood are dysfunctional and predict poor prognosis of GC patients.26 27 However, their phenotypic feature, effector function and clinical relevance in tumors have not been elucidated previously. Here, we observed a significantly increased of PD-1+CD8+ T cell levels in tumors, but no significant association was found between GC-infiltrating PD-1+CD8+ T cell levels and advanced clinical features of GC and patients’ survival. This might be reflected by a non-exhausted phenotypic feature of PD-1+CD8+ T cells compared with their PD-1−CD8+ counterparts in tumors. Additionally, although GC-infiltrating CD8+ T cells displayed a decreased cytokine and cytolytic protein production, the functionality of PD-1+CD8+ T cells was similar to that of PD-1−CD8+ T cells in the same tumor regions, which further indicates that increased PD-1 expression on GC-infiltrating CD8+ T cells likely did not contribute to disease progression. Besides PD-1, coinhibitory molecules such as Tim-3, 2B4, CD160 and BTLA have been widely reported to inhibit T cell function during tumor progression.28–30 However, the levels of these molecules were not altered on tumor-infiltrating CD8+ T cells of GC patients. Instead, soluble inhibitory factors released by tumor microenvironment influenced PD-1 expression and functionality of CD8+ T cells, for we observed an increased PD-1 expression as well as decreased cytokine and cytolytic protein production by these CD8+ T cells stimulated with culture supernatants from digested primary GC tumor tissues. Further analyses confirmed that tumor-derived TGF-β1 was critical in this process, and TGF-β1 blockade could efficiently reverse such GC-induced PD-1 expression and dysfunction of CD8+ T cells.
TGF-β1 is produced by several cell types in the tumor microenvironment.31 Our previous study showed that tumor-infiltrating CD68+ cells expressed TGF-β1, and macrophages isolated from GC also secreted a high level of TGF-β1,21 suggesting that GC-associated macrophages may be an important source of TGF-β1 to regulate PD-1 expression and effector function of CD8+ T cells. TGF-β1 binds to the extracellular domain of TGF-βRII and triggers cross-phosphorylation of TGF-βRI by TGF-βRII, which then propagates the signal transduction via phosphorylation of Smad proteins.32 We found that GC-induced PD-1 expression on CD8+ T cells was inhibited by blocking Smad3 signaling, which was confirmed by the lack of PD-1 upregulation on TGF-β1-stimulated Smad3-deficient CD8+ T cells.23 Interestingly, Smad3 inhibition did not rescue GC-derived TGF-β1-mediated CD8+ T cell dysfunction, whereas Smad2 silencing greatly attenuated this process, suggesting that GC-derived TGF-β1 inhibits CD8+ T cell functionality in a Smad2-dependent but not Smad3-dependent fashion. In fact, it has been reported that knocking down Smad3 alone has little effect on rescuing TGF-β1-meidated inhibition of effector cytolytic protein production by CD8+ T cells, but knocking down both Smad2 and Smad3 reverses such TGF-β1 inhibitory effect on CD8+ T cell functionality.33 Thus, these data demonstrate that GC-derived TGF-β1 induces Smad3-dependent CD8+ T cell PD-1 expression but Smad2-depenedent CD8+ T cell dysfunction.
GC-derived TGF-β1 promoted CD8+ T cell PD-1 expression and their dysfunction independently in vitro, which was further supported by the fact that PD-1 blockade in vivo was not able to rescue GC-induced CD8+ T cell dysfunction to attenuate tumor growth. Our results might explain the lack of clinical response to anti-PD-1/PD-L1 immunotherapy in some GC. For instance, patients with TGF-β-associated mesenchymal subtype signature treated with a PD-1 blocking antibody pembrolizumab showed little clinical response despite elevated immune infiltration in the tumors.34 Moreover, high levels of TGF-β signaling have been shown to contribute to decreased immune surveillance and lack of response to anti-PD-1/PD-L1 therapy in patients with metastatic colorectal cancer and urothelial cancer, and TGF-β blockade was able to reverse such resistance to anti-PD-1/PD-L1 therapy.35–37 Given that TGF-β activation and mesenchymal subtype signature are often observed in GC patients,38 39 TGF-β1 inhibition in these patients who are resistant to PD-1/PD-L1 blockade therapy might be a good strategy to improve their clinical outcomes.
Conclusions
In summary, our study reveals a novel mechanism of GC-derived TGF-β1 promotes GC-infiltrating CD8+ T cell dysfunction independent of their PD-1 expression. Critically, it highlights TGF-β1-mediated immunosuppressive signature should be taken into consideration when PD-1/PD-L1 blockade immunotherapy is developed in GC. Overall, restoring CD8+ T cell function by combining PD-1 and TGF-β1 blockade might be a promising therapeutic strategy for preventing GC tumor immune escape.
Acknowledgments
We thank all the patients for their trust, understanding and willingness to provide their samples for the research.
References
Footnotes
YS and YT contributed equally.
Contributors Study concept and design and drafting of the manuscript: LP. Acquisition of data and analysis and interpretation of data: LP, YS, YT. Critical revision of the manuscript for important intellectual content: LP, QZ, DM, YZ and WC. Statistical analysis: LP, YS. Technical or material support: LP, YL, LW, YW, YZ, YQ, FM and PC. All authors read and approved the final manuscript.
Funding This work was supported by grants of the National Natural Science Foundation of China (NSFC, No. 81872331 and No. 81502457).
Competing interests None declared.
Patient consent for publication Not required.
Ethics approval The study was approved by the Ethics Committee of the Third Military Medical University. Full written informed consent was obtained from all patients.
Provenance and peer review Not commissioned; externally peer reviewed.
Data availability statement Data are available upon reasonable request. All data relevant to the study are included in the article or uploaded as supplementary information.