Article Text

Abstract
Background The immune response within the tumor microenvironment plays a key role in tumorigenesis and determines the clinical outcomes of head and neck squamous cell carcinoma (HNSCC). However, to date, a paucity of robust, reliable immune-related biomarkers has been identified that are capable of estimating prognosis in HNSCC patients.
Methods High-throughput RNA sequencing was performed in tumors and matched adjacent tissues from five HNSCC patients, and the immune signatures expression of 730 immune-related transcripts selected from the nCounter PanCancer Immune Profiling Panel were assessed. Survival analyzes were performed in a training cohort, consisting of 416 HNSCC cases, retrieved from The Cancer Genome Atlas (TCGA) database. A prognostic signature was built, using elastic net-penalized Cox regression and backward, stepwise Cox regression analyzes. The outcomes were validated by an independent cohort of 115 HNSCC patients, using tissue microarrays and immunohistochemistry staining. Cell-type identification by estimating relative subsets of RNA transcripts (CIBERSORT) was also used to estimate the relative fractions of 22 immune-cell types and their correlations coefficients with prognostic biomarkers.
Results Collectively, 248 immune-related genes were differentially expressed in paired tumors and normal tissues using RNA sequencing. After process screening in the training TCGA cohort, four immune-related genes (PVR, TNFRSF12A, IL21R, and SOCS1) were significantly associated with overall survival (OS). Integrating these genes with Path_N stage, a multiplex model was built and suggested better performance in determining 5 years OS (receiver operating characteristic (ROC) analysis, area under the curve (AUC)=0.709) than others. Further protein-based validation was conducted in 115 HNSCC patients. Similarly, high expression of PVR and TNFRSF12A were associated with poor OS (Kaplan-Meier p=0.017 and 0.0032), while high expression of IL21R and SOCS1 indicated favorable OS (Kaplan-Meier p<0.0001 and =0.0018). The integrated model with Path_N stage still demonstrated efficacy in OS evaluation (Kaplan-Meier p<0.0001, ROC AUC=0.893). Besides, the four prognostic genes were significantly correlated with activated CD8+ T cells, CD4+ T cells, follicular helper T cells and regulatory T cells, implying the possible involvement of these genes in the immunoregulation and development of HNSCC.
Conclusions The well-established model encompassing both immune-related biomarkers and clinicopathological factor might serve as a promising tool for the prognostic prediction of HNSCC.
- tumor biomarkers
- tumor microenvironment
- head and neck neoplasms
- immunity
This is an open access article distributed in accordance with the Creative Commons Attribution Non Commercial (CC BY-NC 4.0) license, which permits others to distribute, remix, adapt, build upon this work non-commercially, and license their derivative works on different terms, provided the original work is properly cited, appropriate credit is given, any changes made indicated, and the use is non-commercial. See http://creativecommons.org/licenses/by-nc/4.0/.
Statistics from Altmetric.com
Introduction
Head and neck squamous cell carcinoma (HNSCC) is frequently lethal and is the most common malignancy, comprised a heterogeneous group of tumors that arise from the squamous epithelium of the oral cavity, oropharynx, larynx, and hypopharynx. Despite significant advances in multidisciplinary treatments, the 5-year overall survival (OS) rate of locally advanced HNSCC has remained approximately 50% in recent decades.1–3 Given the rising incidence and poor survival rates associated with HNSCC, better prognostic tools and biomarkers that are capable of accurately predicting the behaviors of tumors are urgently necessary, to better tailor prevention, screening, and treatment approaches for HNSCC.4–6
Emerging evidence suggests that cancer cells can activate different immune pathways, resulting in immunosuppressive functions and determining the immune microenvironment of tumors.7 The systematic investigation of immune phenotypes within the HNSCC microenvironment represents a promising method for better understanding the complex antitumor response and to guide effective immunotherapies.8–10 Many ongoing trials are focused on the identification of new biomarkers, including PD-L1, PD-L2, and interferon (IFN)-γ, to serve as potential surrogates for the prediction of clinical outcomes.11–13 However, to date, apart from human papillomavirus (HPV) status, few robust, highly reliable, predictive or prognostic biomarkers have been identified for HNSCC.4 14
The genomic features of tumors and their microenvironments represent promising candidates for use as predictive and prognostic biomarkers.15–17 RNA sequencing (RNA-seq) has been an indispensable tool for the investigation of gene networks associated with immunomodulatory mechanisms and the identification of candidate biomarkers.18 19 Although the molecular profiles of immune components and certain indicators can improve the accuracy of predicting tumor progression for risk stratification, the heterogeneity of HNSCC, which derives from the different tissue origins, suggests that rather than a single biomarker, a pooled gene panel will be necessary to accurately detect multiple tumor histotypes and determine prognosis.
Here, we analyzed HNSCC transcriptomic data from multiple patient cohorts, which resulted in the identification of four immune-related genetic signatures that can be used to guide the prediction of tumor progression and prognosis in patients. Then, we used tissue microarray (TMA) analysis, to verify protein expression levels. Gene expression-based immune cell quantification was performed, and the relationship between different immune cell subgroups and established markers was assessed. Overall, these data indicated that the four identified biomarkers, combined with the pathological regional lymph node metastasis (Path_N) stage, might be practical indicators for predicting the heterogeneous clinical behaviors and prognosis of HNSCC patients.
Methods
Patient samples
Fresh paired tumor and adjacent normal tissues were collected from five HNSCC patients, treated between October 2014 and January 2015, and subjected to RNA-seq analysis. A total of 416 HNSCC cases from The Cancer Genome Atlas (TCGA) database (https://tcga-data.nci.nih.gov/tcga/) were recruited as a training cohort, and corresponding genome-wide mRNA expression (standardized reads per kilobase per million mapped reads) and clinicopathological information (age, sex, histological type, pathological tumor (T), node (N), and metastasis (M) stages, HPV status, follow-up data, etc) were obtained. Tumor tissues from another 115 HNSCC patients treated between June 2007 and June 2014 were collected as a validation cohort, and TMA with immunohistochemistry (IHC) staining was used to evaluate protein expression. The selected patients were pathologically diagnosed as primary HNSCC and underwent surgery at the Head and Neck Surgery Department of the Affiliated Tumor Hospital of Nanjing Medical University. Before the operation, patients did not receive any other treatments, such as radiotherapy or chemotherapy. The histopathological tumor types were defined according to the criteria established by the WHO. The eighth edition of the American Joint Committee on Cancer staging system was used to grade the tumor, node, metastasis (TNM) stage of each case, based on clinical, radiological, and pathological findings. Tissue samples were stored in liquid nitrogen or 10% formalin solution for subsequent RNA extractions or paraffin embedding, respectively. The corresponding tissue adjacent to the tumor was defined as adjacent normal tissue (located >3 cm from the tumor), which was confirmed pathologically. All participants provided written informed consent.
Illumina HiSeq 2500 RNA-seq
RNA-seq analysis was performed on the Illumina HiSeq 2500 platform (Illumina, San Diego, CA), by CapitalBio Corporation, using paired tissue samples from the five HNSCC patients, as described previously.20 In brief, a sequencing library was generated using the NEBNext Ultra directed RNA library preparation kit (NEB, Ipswich, MA) for Illumina. The library was sequenced using a high-throughput, 125 bp, paired terminal pattern, and conducted on the Illumina HiSeq 2500 platform. During data analysis, base calls were performed using bcl2fastq2 (V.2.20.0) software. The ngsqc-toolkit (V.2.3.3) was employed to filter the readings, and the detached reader TopHat (V.2.0.13) was used to align the readings with the genome. The mismatch was set to 2, and the default parameters were used. A total of 770 immune-related human genes were referred to as candidate genes from the nCounter PanCancer Immune Profiling Panel (NanoString, LBL-10 043-08_nCounter_PanCancer_Immune_Profiling_Panel_Gene_List), among which 40 were deemed internal reference genes and demonstrated no correlating with immune response.21 The detailed annotations are listed in online supplementary table S2.
Supplemental material
Bioinformatics analysis
The software R package limma (V.3.40.6) was used to calculate the fold-change of transcripts and to screen for differentially expressed genes (DEGs)22 in the RNA-seq cohort. A fold-change larger than two and an adjusted p value less than 0.05 were set as the cut-off values for screening significant DEGs. Cluster analysis and heatmap generation were performed using the R package clusterProfiler (V.3.12.0) and pheatmap (V.1.0.12), respectively.23 Gene Ontology (GO) and Kyoto Encyclopedia of Genes and Genomes (KEGG) pathway analyzes for the dysregulated genes were performed by ClueGO25 (V.2.5.5), within Cytoscape (V.3.7.1). A false-discovery rate less than 0.05 was set as the cut-off value.
For significant DEGs, the elastic net-penalized Cox proportional hazards (PHs) model was used to select genes with significant power for prognostic value in the TCGA cohort. Elastic net, a combination of Ridge and least absolute shrinkage and selection operator (LASSO) methods, was used to select prediction features. The regularization parameter, λ, was determined by 10-fold cross-validation, whereas the L1-L2 trade-off parameter, α, was set to 0.5, with equal Ridge and LASSO penalties. The potential prognostic factors selected by the elastic net-penalized CoxPH regression were subjected to a multivariate CoxPH regression analysis, to adjust the risk scores of each selected gene for prognostic clinical parameters. Then, variables exhibiting significance in the adjusted analyzes were entered into a backward, stepwise-elimination Cox regression model.
IHC analysis
IHC data for HNSCC tissues and normal oral mucosa tissues were downloaded from the Human Protein Atlas (HPA) database (www.proteinatlas.org), to validate the DEGs. Moreover, TMAs, containing tumor tissues from 115 HNSCC patients, were constructed for IHC staining and the semi-quantitation of IHC staining. The TMA blocks were made using a TMA Grand Master 3D instrument (Histech, Budapest, Hungary) by punching 1 mm cores from formalin-fixed and paraffin-embedded tissue samples of 115 HNSCC patients. Briefly, all slides were exposed to 3% hydrogen peroxide for 10 min to block endogenous peroxidase activity. Poliovirus receptor antibody (PVR/CD155, Sigma-Aldrich, polyclonal, hpa012568, 1:200, antirabbit), tumor necrosis factor receptor superfamily member 12A (TNFRSF12A, Abcam, monoclonal, #ab109365, 1:100, antirabbit), interleukin-21 receptor (IL-21R, Proteintech, polyclonal, #10533-ap,1:100, antirabbit), and suppressor of cytokine signaling 1 (SOCS1, CST, polyclonal, #B1254S, 1:200, antirabbit), incubated with tumor sections in a humidified chamber at 4°C overnight, followed by the secondary antirabbit peroxidase-conjugated secondary antibody (EnVisionTMDetection Kit, Dako, Glostrup, Denmark) at 37°C for 30 min. Both negative (without the primary antibody) and positive controls were carried out in each run. Each tissue chip was scanned with a 3D HISTECH Panoramic (MADE in Hungary) scanner, and the 3D HISTECH Quant center 2.1 scanning analysis software was used for H-score evaluation. The software will automatically identify all dark brown on the tissue section as strong positive, brown yellow as moderate positive, light yellow as weak positive, and blue cell nuclei as negative. After that, a manual discrimination is made to modify the corresponding threshold, and a color selection scheme is saved as a unified standard for this indicator. Then the system identifies and analyzes the strong positive, moderate positive, weak positive and negative signals for each tissue and finally output the positive area ratio and H-score. H-score=1×percentage (%) of weakly stained cells+2×percentage (%) of moderately stained cells+3×percentage (%) of strongly stained cells.
Estimation of immune-cell type fractions
Cell-type identification by estimating relative subsets of RNA transcripts (CIBERSORT), a deconvolution algorithm reported by Newman et al, can characterize the cell composition of complex tissues, based on normalized gene expression profiles (GEPs).24 25 In this study, CIBERSORT (https://cibersort.stanford.edu/) and leucocytesignature matrix 22 (LM22) were used to quantify the proportions of immune-cell types in the HNSCC samples from the TCGA data. Normalized gene expression data were analyzed using the CIBERSORT algorithm, running 1000 permutations. The CIBERSORT p value reflects the statistical significance of the results, and a threshold less than 0.05 is recommended. Finally, samples with CIBERSORT p values less than 0.05 were included in correlation analyzes between genes and immune-cell types.
Statistical analysis
DEGs were compared with Student’s t-test, and those with p values less than 0.05 and fold-changes larger than two were viewed as being dramatically dysregulated. Survival curves were compared using the Kaplan-Meier method and the log-rank test. One-way analysis of variance was used to compare immune-cell type proportions among the TCGA cohort. Clinicopathological features were compared by χ² tests or Wilcoxon tests for the TCGA and TMA cohorts. All tests were two-sided, and a p value of less than 0.05 was considered to be significant unless stated otherwise. Data were analyzed using R (V.3.6.1).
Results
Identification of differentially expressed immune signatures in HNSCC
We generated RNA-seq profiles for tumors and paired normal tissues from five treatment-naïve patients, whose clinical and pathological characteristics are listed in online supplementary table S1. Previous studies suggested that HNSCC consists of inflammatory cancers, associated with the dysregulation of cytokines or chemokines and the recruitment of immune cells.26 To identify immune-cell type expression across the different HNSCC samples, we performed an unsupervised analysis of 730 immune-related genes from the RNA-seq data. Based on GO annotations, the 730 immune signatures were classified into five groups: adaptive, general, humoral, inflammation, and innate immune response genes (online supplementary table S2). Hierarchical clustering revealed dissimilar gene expression patterns between normal tissues and HNSCC tissues (figure 1A). A total of 248 immune-related genes were identified as significant DEGs (p<0.05) (online supplementary table S3), among which 174 were upregulated and 74 were downregulated. Moreover, a rose diagram showed that the majority of these dysregulated immune-related genes were associated with general immune response processes, and no obvious enrichment trends for aberrant genes in any of the four groups were observed (figure 1B). The most significantly upregulated and downregulated genes were C-X-C motif chemokine ligand 5 (CXCL5) and mitogen-activated protein kinase 3 (MAPK3), respectively (figure 1C).
Supplemental material
Supplemental material
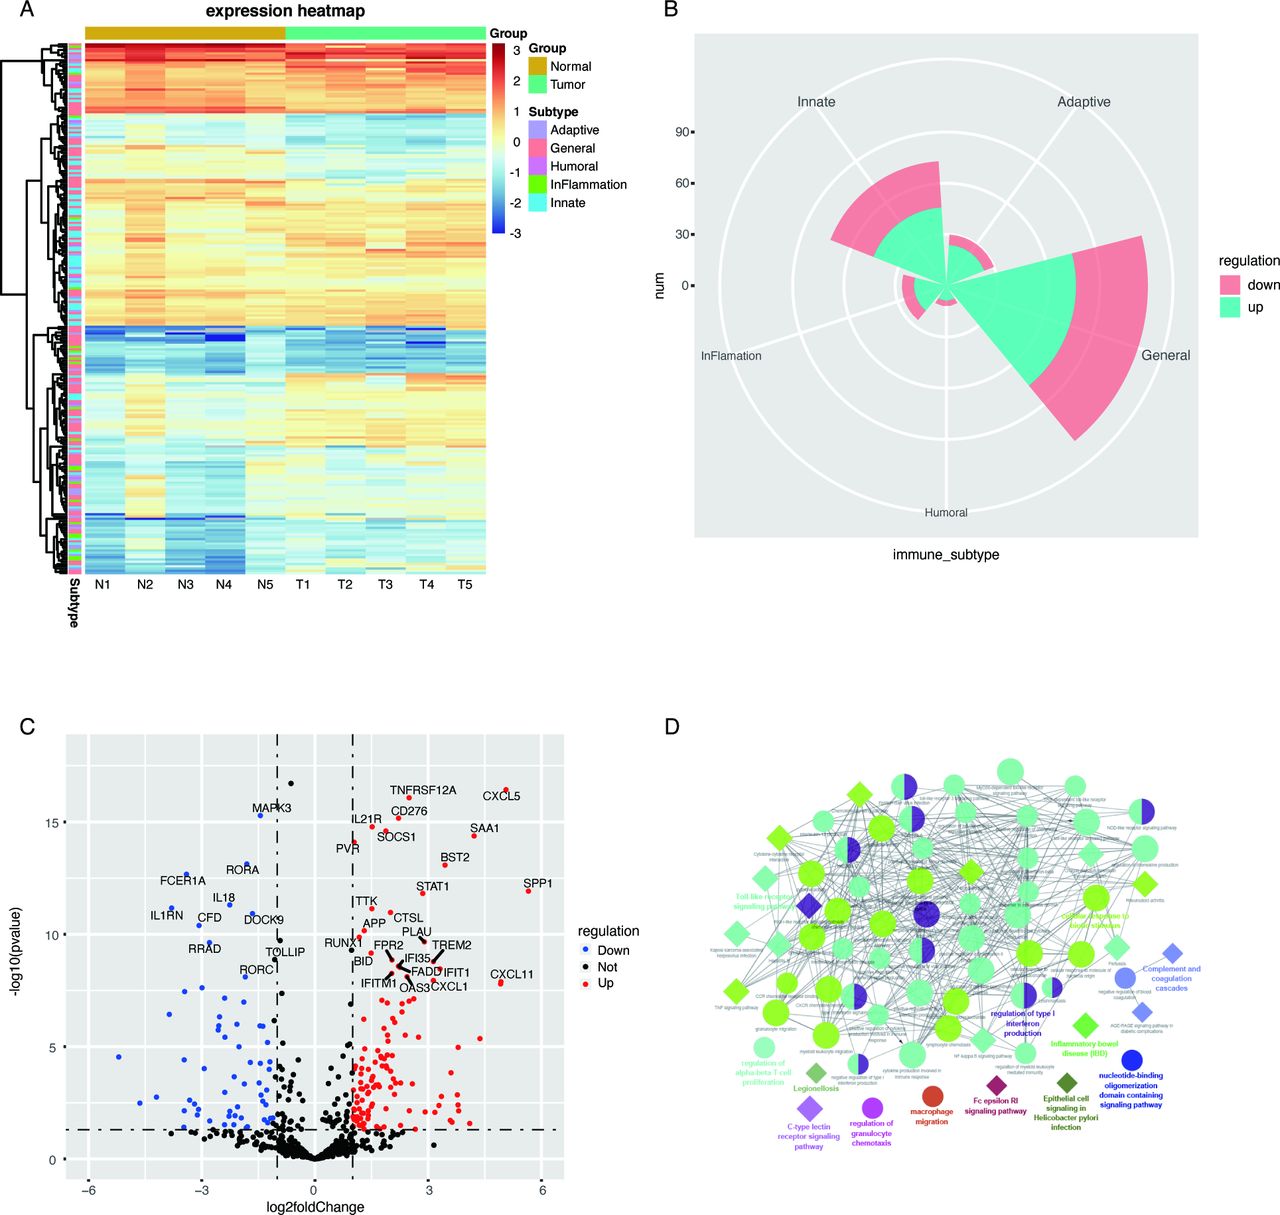
Differentially expressed immune signatures in head and neck squamous cell carcinoma (HNSCC) and associated enriched Gene Ontology (GO) and Kyoto Encyclopedia of Genes and Genomes (KEGG) pathways. (A) Expression levels of 730 immune-related genes in HNSCC tissues (T) and matched normal tissues (N) are shown in the heatmap. Generally, these genes were divided into five categories: adaptive, general, humoral, inflammation, and innate immune response genes. (B) Distribution of significantly dysregulated genes across the five gene categories. The major dysregulated genes were enriched in the general immune response category, and the number of upregulated or downregulated genes appeared to be similar across categories. (C) All 730 genes assessed in HNSCC are shown in the volcano plot. Red dots represent upregulated genes, and blue dots represent downregulated genes, which were defined as genes with p values less than 0.05 and fold-changes larger than 2. (D) Significantly enriched GO and KEGG pathways. Circles represent enriched GO pathways, and diamonds represent enriched KEGG pathways. Objects with the same colors belong to the same group, with labels in the same color found on the side. GO and or KEGG pathways that interact are aligned; otherwise, pathways were placed alone.
GO enrichment analysis revealed that this set of immune signatures was involved in the inflammatory response and diverse immune processes, including the activation of the immune response, immune-cell trafficking, regulation of lymphocyte proliferation, and leucocyte activation (figure 1D, online supplementary table S4). The Toll-like receptor, cytokine-cytokine receptor interaction, Janus kinase (JAK)-signal transducer and activator of transcription (STAT), and nuclear factor (NF)-κB signaling pathways were significantly enriched in the KEGG analysis (figure 1D, online supplementary table S5). Taken together, these dysregulated immune signatures indicated dynamic complexity and the heterogeneous behaviors of immune responses in the tumor microenvironment of HNSCC.
Supplemental material
Supplemental material
Generation of prognostic immune signatures in HNSCC
In the training cohort of 416 HNSCC cases from TCGA (table 1), survival data were obtained for each patient, and univariate and multivariate analyzes were conducted to assess the relationships between clinical parameters and survival outcomes. As shown in online supplementary table S6, Path_N stage (HR 1.299, 95% CI 1.157 to 1.458) was a potential independent prognostic factor for OS (p<0.001). Because a large majority of predicted alternative transcripts may not be translated into proteins, the antibody-based profiling of the HPA database was used to compare analyzes of both RNA and protein levels, with higher reliability. One hundred and twenty-seven genes of which encoded proteins were absent or not varied in HNSCC tumors and paired normal tissues were eliminated (online supplementary figure S1). Of the remaining 121 protein-coding genes, 72 genes, with fold-changes larger than 2, were examined using the elastic net-penalized CoxPH regression analysis. The elastic net-penalized CoxPH model identified a pool of 29 genes that were closely associated with OS in the TCGA cohort (table 2). After 29 potential prognostic factors were subjected to multivariate CoxPH regression analyzes, to adjust the risk scores of each selected gene for age, sex, histological grade, pathological TNM stage, pathological T stage, and N stage, a total of seven genes (PVR, TNFRSF12A, IL21R, SOCS1, ABCB1, IL11RA, and APP) were selected as prognostic candidates. The backward, stepwise-regression method further minimized this pool to four genes, including PVR (HR=1.020, 95% CI 1.009 to 1.031), TNFRSF12A (HR=1.006, 95% CI 1.003 to 1.010), IL21R (HR=0.819, 95% CI 0.706 to 0.950), and SOCS1 (HR=0.973, 95% CI 0.953 to 0.994), using the minimum akaike information criterion procedure.
Supplemental material
Supplemental material
Clinical and pathological characteristics of HNSCC patients in TCGA cohort and TMA cohort
Selected variables according to the Cox proportional hazards regression analyzes results in TCGA data
Furthermore, the HNSCC patient cohort was subdivided into high-expression and low-expression subgroups (best cut-off values were calculated by survminer R package (V.0.4.6)) according to the best expression levels of these four genes. Kaplan-Meier plots revealed that highly expressed PVR (p=0.008) and TNFRSF12A (p=0.00025) were associated with inferior survival, whereas patients with highly expressed IL21R (p=0.00036) and SOCS1 (p=0.00017) suggested improved survival compared with those with low expression (figure 2A–D). Based on aforesaid results, a multiplex model encompassing the transcript expression level of four genes and Path_N stage was built and high-risk patients had worse OS rates than those with low-risk (median: 22.2 months vs 90.6 months; p<0.0001) (figure 2E). Receiver operating characteristic (ROC) curves showed that the four-gene expression and Path_N stage integrated prediction model had an area under the curve (AUC) value of 0.709 in evaluating 5 years OS, which was much higher than any individual factor or the four-gene combination alone (figure 2F). HPV status and CD8+ T cell abundance were shown to have prognostic value in HNSCC.27 Thus, we estimated the prognostic efficiencies of HPV status assessed with p16 (HPV_p16) and HPV DNA detected by in situ hybridization (HPV_ISH), and CD8+ T cell abundance, which returned AUC values of 0.556, 0.549, and 0.547, respectively (online supplementary figure S2A–C). The expression of four genes was also combined with HPV status, CD8+ T cell abundance, Path_T stage, Path_TNM stage, and pathological tumor grade, which all returned disadvantaged AUC compared with established multiplex model (online supplementary figure S2D–I). A further attempt about integrating CD8+ T cell abundance into the model was performed but still achieved an inferior result (AUC=0.703) (online supplementary figure S2J). These results indicated the outperformance of the final predictor model for distinguishing between favorable and unfavorable OS rates in HNSCC patients.
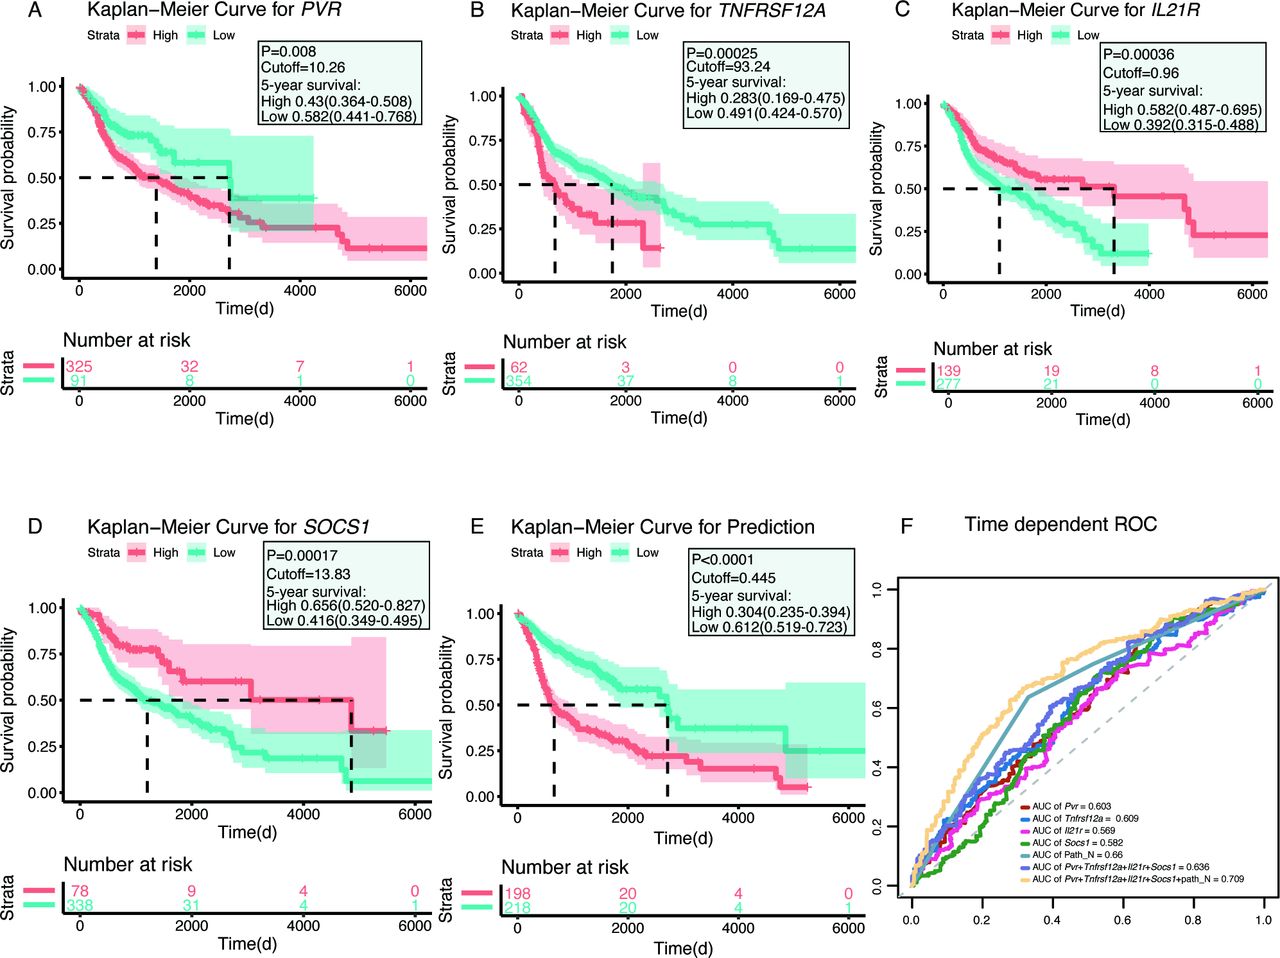
Kaplan-Meier plots and receiver operating characteristic (ROC) curves of the survival-associated genes in head and neck squamous cell carcinoma, using The Cancer Genome Atlas data. (A–D) Kaplan-Meier plots of the four survival-associated genes. Patients were divided into high-expression (red line) and low-expression (blue line) groups, based on their gene expression levels according to the best cut-off value for each gene. (E) Kaplan-Meier plot of the prognostic predictor, including the four genes PVR, TNFRSF12A, IL21R, and SOCS1 and Path_N stage. Patients were divided into high-risk (red line) and low-risk (blue line) groups, according to the best cut-off value for the prediction of the predictor. (F) ROC curves for each parameter, with area under the curve (AUC) scores.
Protein-level validation of established prognostic factors
To validate the transcriptomic data for these four candidate immune genes, we used the results from protein profiles, available in the HPA, to confirm the HNSCC tissue enrichment of these gene products at the protein level. Representative images of IHC-stained HNSCC tissues and normal oral tissues were obtained from the HPA database and are shown in online supplementary figure S3. The fractions of samples with high, medium, low, or undetectable antibody staining were determined by gray-scale color-coding. For the significantly upregulated genes, PVR, TNFRSF12A, IL21R, and SOCS1, the majority of HNSCC samples (75%–100%) showed high or medium expression, whereas all normal oral tissues showed undetectable or low expression. Despite the lack of sufficient samples and statistical analysis, obvious trends could be observed for the IHC staining results, which were largely consistent with the results of the RNA-seq data analysis.
To further validate the predictive abilities of immune signatures, a total of 115 diagnosed HNSCC patients from the Nanjing Medical University Affiliated Cancer Hospital were enrolled as an independent cohort (table 1). The TMA, which uses patient-derived tissues, can detect protein biomarkers using IHC evaluation; therefore, the HNSCC patients were subdivided into two groups (HIGH and LOW), based on the expression of prognostic factors, using the H-score system (figure 3A–D). PVR, TNFRSF12A, IL21R, and SOCS1 were chosen as candidates, and their prognostic values, relative to the OS rate, were evaluated in our validation cohort. As expected, high levels of specific signals were detected in HNSCC tissues, whereas low or no expression/staining was observed in the normal tissues (online supplementary figure S4). Consistent with the previously reported findings, the expression of PVR, TNFRSF12A, and IL21R were observed in the plasma membrane and cytosol, whereas SOCS1 staining was observed in the nucleus and cytosol.
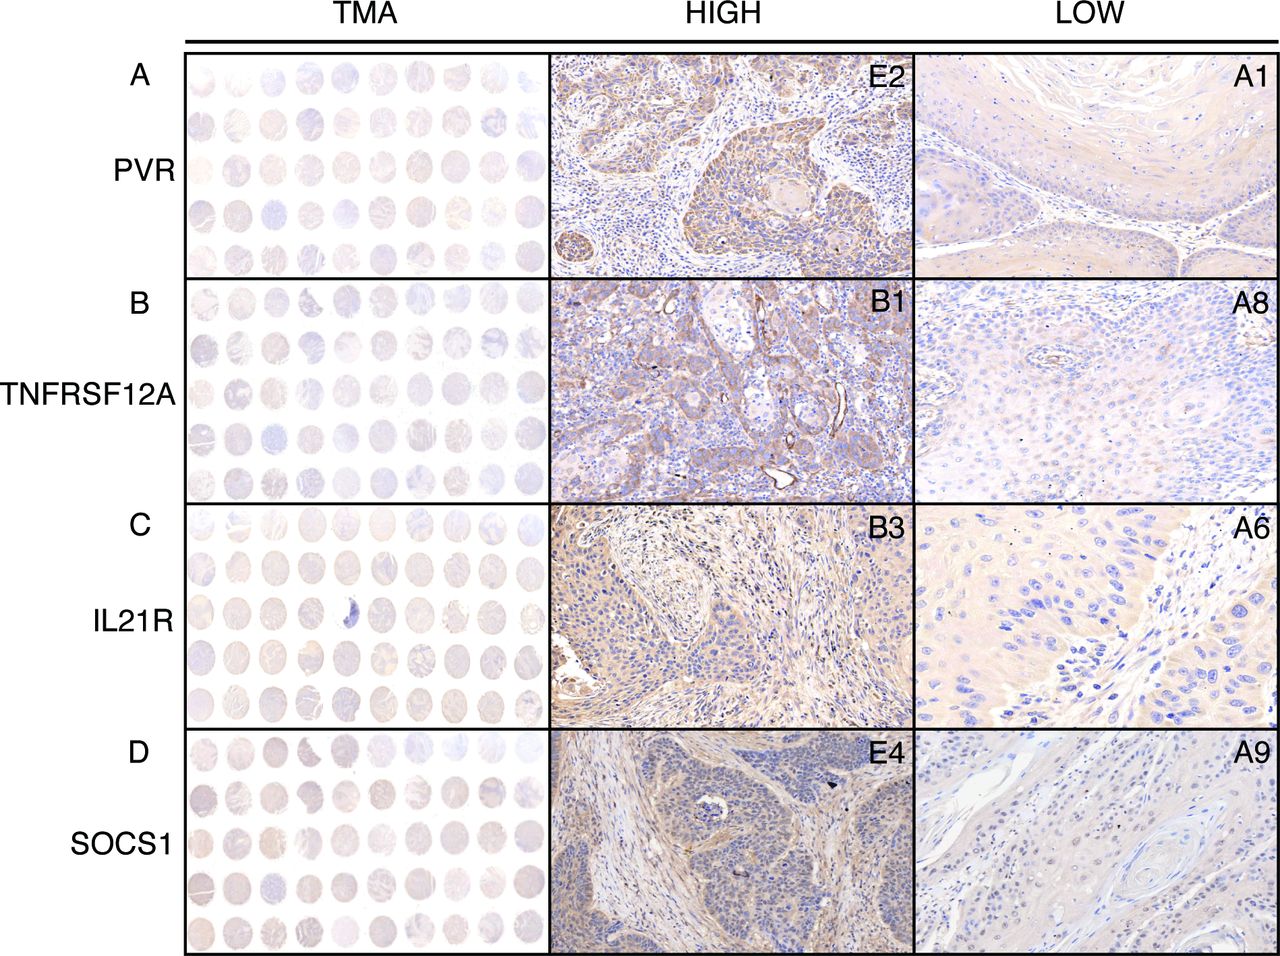
Representative images of PVR, TNFRSF12A, IL21R, and SOCS1 expression in HNSCC tissues by immunohistochemistry (IHC) staining. The column tissue microarray (TMA) shows representative images of tissue chips, and the columns HIGH and LOW show representative images of IHC staining on each chip.
Similar to the transcript-based analysis, Kaplan-Meier curves revealed that patients with either PVRHigh or TNFRSF12AHigh had significantly lower postoperative OS compared with PVRLow or TNFRSF12ALow patients, respectively (PVRHigh vs PVRLow: p=0.017; median, 91.0 months vs >maximum follow-up of 115 months; TNFRSF12AHigh vs TNFRSF12ALow: p=0.0032; median, 66.0 months vs >maximum follow-up of 115 months) (figure 4A,B). Conversely, patients with either IL21RHigh or SOCS1High had superior OS rates compared with patients with IL21RLow or SOCS1Low, respectively (IL21RHigh vs IL21RLow: p<0.0001; median, >maximum follow-up of 115 months vs 61.0 months; SOCS1High vs SOCS1Low: p=0.0018; median, >maximum follow-up of 115 months vs 64.0 months) (figure 4C,D). The results confirmed that PVR and TNFRSF12A were unfavorable prognostic factors, whereas IL21R and SOCS1 predicted favorable prognosis in HNSCC patients. Consistent with the analysis of the TCGA cohort, the multiplex model encompassing these four genes and Path_N stage was built and high-risk patients had worse OS rates than those with low-risk (median, 30.0 months vs >maximum follow-up of 115 months; p<0.0001) (figure 4E). ROC analysis showed that the AUC value of the four-gene expression plus Path_N stage was 0.893 in evaluating 5 years OS, which was much higher than any individual factor or the four-gene combination alone (figure 4F). Taken together, our results demonstrated that the multiplex model seemed a robust and valuable indicator for predicting the prognosis of HNSCC patients.
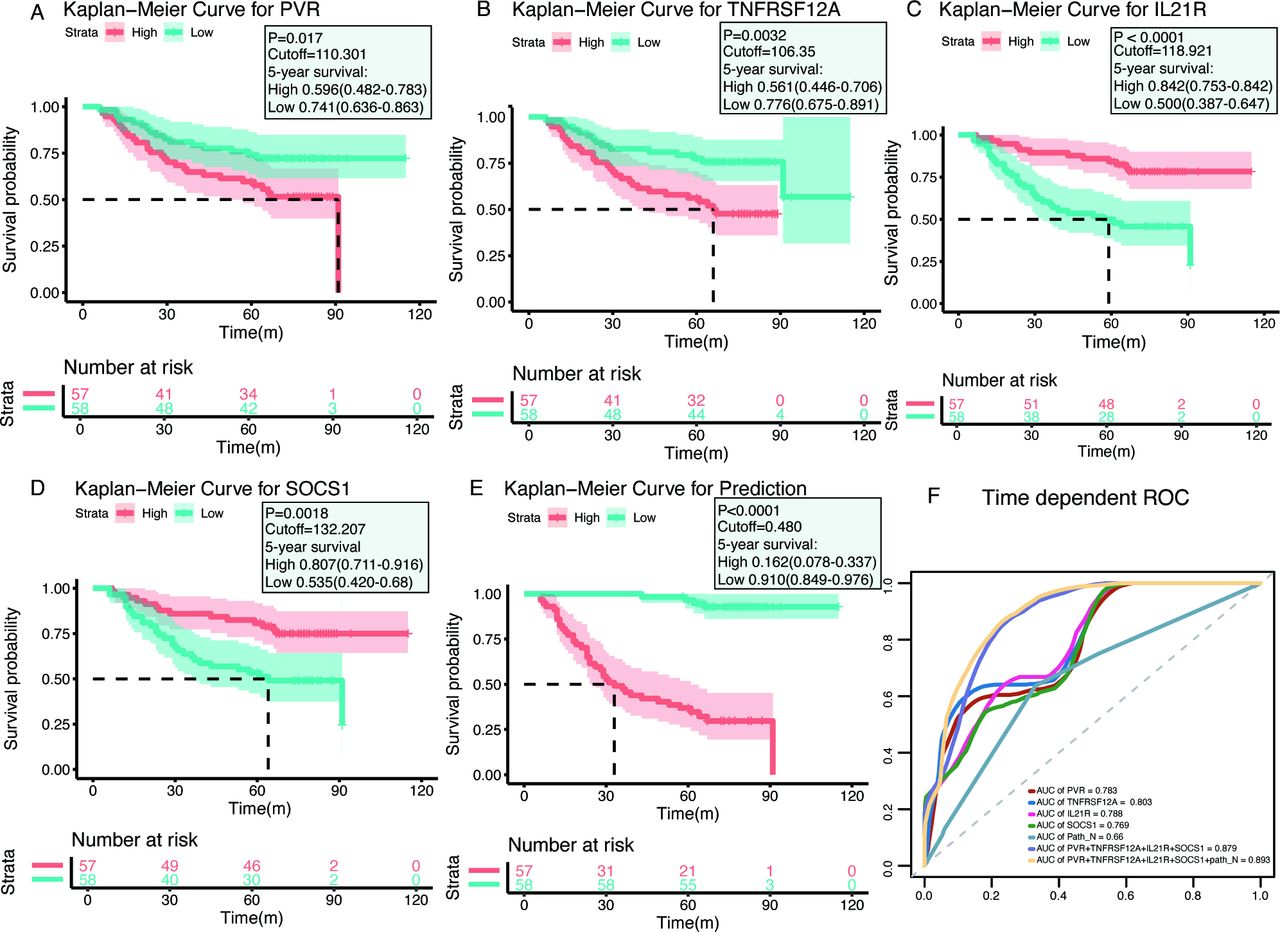
Immunohistochemistry (IHC) validation of prognostic factors in head and neck squamous cell carcinoma. (A–D) Kaplan-Meier plots of each gene, with red lines representing the high-expression groups, whereas the blue lines represent the low-expression group (using median cut-off values). (E) Kaplan-Meier plots for the prognostic predictor, built with the four molecules PVR, TNFRSF12A, IL21R, and SOCS1 and the Path_N stage (using median cut-off values). (F) Receiver operating characteristic (ROC) curves for each parameter, with area under the curve (AUC) scores.
Correlation between prognostic factors and tumor-infiltrating immune cells
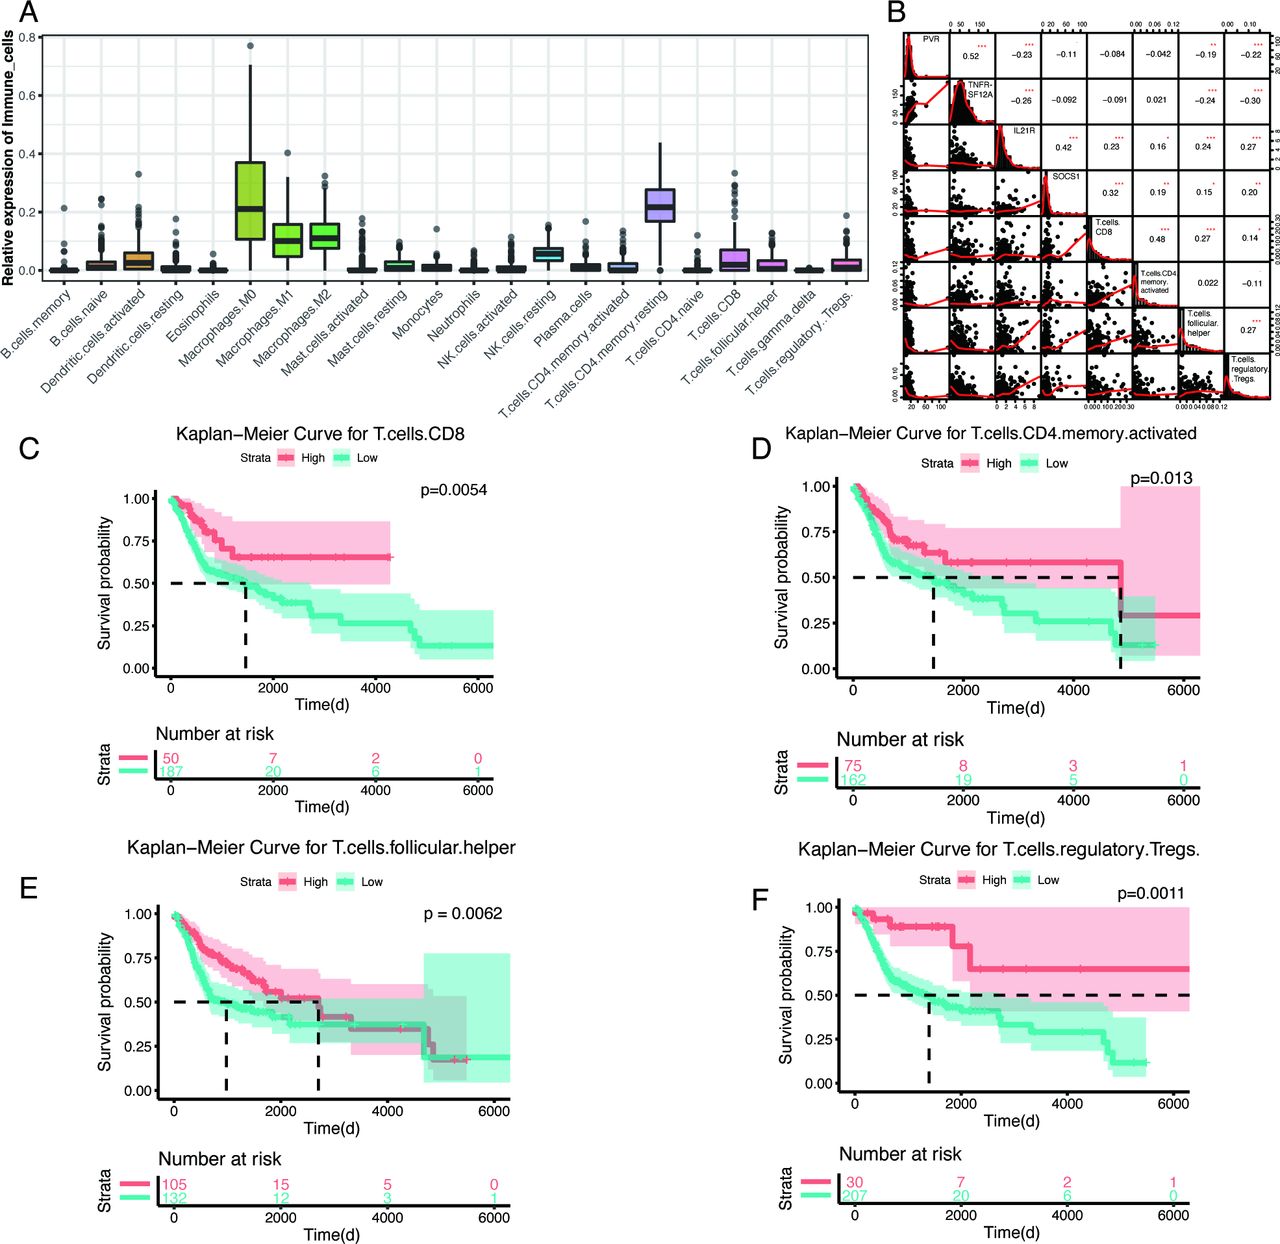
Because immune cells are important components of the tumor microenvironment and are intensively correlated with outcomes and immune-therapy responses, we used the CIBERSORT algorithm to estimate the abundances of 22 different immune-cell types in the TCGA HNSCC cohort. Similar to findings for other tumors, macrophages (M0, M1, and M2), CD4 resting-memory T cells, and resting natural killer (NK) cells account for larger proportions of the infiltrating immune cells in HNSCC tumors than other cell types (figure 5A). Pearson correlation analysis revealed a correlation between prognostic factors and immune-cell types (online supplementary figure S5). These four prognostic factors were primarily correlated with activated CD8+ T cells, CD4+ T cells, follicular helper T cells, and regulatory T cells (Tregs) (figure 5B). Kaplan-Meier plots revealed that these four immune-cell types were significantly associated with patient outcomes, and patients with high levels of these four immune-cell types (best cut-off values were calculated by survminer R package (V.0.4.6)) had a significantly better prognosis than other HNSCC patients (figure 5C–F). Consistently, PVR and TNFRSF12A were negatively correlated with activated CD8+ T cells, CD4+ T cells, follicular helper T cells, and Tregs, whereas IL21R and SOCS1 were positively correlated with all four immune-cell types. Taken together, these correlations between prognostic factors and immune-cell types suggested the significant involvement of these genes in the immune response during HNSCC.
Correlations between the four genes and immune-cell types and the Kaplan-Meier plots of the related immune cells. (A) Proportions of 22 immune-cell types, calculated by cell-type identification by estimating relative subsets of RNA transcripts, in head and neck squamous cell carcinoma patients from the The Cancer Genome Atlas database. (B) Correlation analysis between the four prognostic-associated immune genes and four immune-cell types, by Pearson’s correlation analysis. The correlation coefficients are shown in each cell, and the asterisks present significance (*p<0.05; **p<0.01;***p<0.001). (C–F) Kaplan-Meier plots of CD8+ T cells, activated CD4+ memory T cells, follicular helper T cells, and regulatory T cells, with red lines representing high-expression groups and blue lines representing low-expression groups (using best cut-off values).
Discussion
HNSCC is characterized by high proliferation, regional lymph node metastasis, and poor prognosis, with approximately 550,000 new cases diagnosed yearly worldwide.1 The current study used high-throughput, second-generation sequencing data from HNSCC and paired normal tissues to perform differential expression analysis of immune-relevant genes and then identified their prognostic values using the TCGA database. Emerging data suggest that whole-genome transcriptomics with insights on immune-related genes can help determining the prognosis of cancer patient or responses to individual immunotherapies.28 We are aware of published immune signatures associated with IFN-γ signaling and activated T-cell biology, which can be used to predict clinical responses to Programmed cell death protein 1 (PD-1) checkpoint blockade treatment in melanoma and HNSCC cohorts.29 30 Importantly, we identified three significantly dysregulated genes, including STAT1, CXCL11, and PRF1, in our GEPs that were also included in the 28-gene IFN-γ-related inflammation signature reported in this study,29 and STAT1 was validated as being significantly associated with the response to active pembrolizumab therapy in HNSCC patients, regardless of viral status. However, IFN-γ-based GEPs are insufficient to provide accurate and comprehensive estimates of the relative abundance of immune genes. Here, we explored 730 genes covering both the adaptive and innate immune responses and validated the results by using HNSCC samples and the TCGA cohort. Our results showed that the most upregulated and downregulated immune genes in HNSCC were CXCL5 and MAPK3, respectively. CXCL5 is a strong granulocyte chemokine that recognizes and binds to C-X-C motif chemokine receptor 2 (CXCR2), and MAPK3/extracellular signal-related kinase 1 (ERK1) is an important serine/threonine kinase, involved in the MAPK pathway, and both play immunoregulatory roles in tumor immunity and angiogenesis.31–33 Interestingly, we noticed that B7-H3/CD276, an immune checkpoint in T cells, was aberrantly dysregulated in HNSCC specimens and might represent a potential therapeutic target, as the inhibition of B7-H3 has been shown to increase antitumor immune responses by decreasing immunosuppressive cells and promoting cytotoxic T-cell activation in HNSCC animal models.34 Enrichment analysis also showed that DEGs are primarily involved in immune response activation, T-cell activation, and the JAK/STAT and NF-κB pathways, indicating that performing immune profiles of HNSCC may reveal prognostic biomarkers and play important roles in antitumor immunity.
To identify the most intriguing biomarkers associated with clinical outcomes, we used the TCGA database to screen for substantial DEGs in HNSCC tumor tissue, resulting in a total of 72 candidate genes for survival analysis. Of these, 29 genes were identified as being closely related to the OS rate among HNSCC patients, by elastic network-penalized CoxPH analysis. A prediction model involving four genes (PVR, TNFRSF12A, IL21R, and SOCS1) and the Path_N stage was constructed, using a multivariate CoxPH regression, and the prognostic efficacy of this signature was further verified by IHC analysis in an independent cohort. We also analyzed established prognostic factors, including HPV status and the abundance of CD8+ T cells, for prognostic efficiency. Our prediction model significantly stratified both the TCGA cohort (AUC=0.709) and our independent cohort (AUC=0.893) according to OS and was superior to other prognostic signatures.
Our analysis is also likely to provide biological and therapeutic information.35 Notably, PVR (CD155), a member of the nectin immunoglobulin family, is highly expressed in many malignant tumors and contributes to tumor immunosuppression. In recent years, PVR-targeted therapeutic monoclonal antibodies have been applied in ongoing clinical trials for patients with solid tumors.36 TNFRSF12A (Fn14), a subgroup of the TNF receptor family, acts by binding to its ligand, TNF-related weak inducer of apoptosis (TWEAK), and contributes to carcinogenesis by activating the NF-κB pathway. Blocking the TWEAK/FN14 pathway, using Fn14 antibodies, may provide therapeutic benefits for tumor-associated inflammation.37 IL21R and SOCS1 are both involved in the regulation of the JAK/STAT signaling pathway and can activate antitumor immunity, mediated by promoting the proliferation and differentiation of T and B cells, enhancing the cytolysis of NK cells, and inhibiting inflammation and tumorigenesis.38 39 These genes are characterized by increased expression, which is associated with the immune response and highlights the diverse biological processes that may provide avenues for further research in HNSCC. The expression levels of PVR and TNFRSF12A were related to the poor prognosis of HNSCC patients, whereas IL21R and SOCS1 predicted a better prognosis. Although profound insights into the mechanisms and biological processes associated with these genes remain to be explored, these characteristics make them biomarker candidates, suggesting that our prediction model, which includes these four genes combined with the Path_N stage, may be a promising prognostic biomarker in HNSCC. Moreover, the combined evaluation of transcript and protein levels may improve the prognostic robustness of molecular biomarkers.
Tumor-infiltrating lymphocytes determine the progression and aggressiveness of tumors and are a source of important prognostic information for patients.40 CIBERSORT is an algorithm that allows for the highly sensitive and specific discrimination of 22 human immune-cell phenotypes, using a machine-learning approach called support vector regression. To further elucidate the relationships between immune-related genes and the tumor microenvironment, we used CIBERSORT to quantify the proportions of HNSCC immune cells in TCGA and correlated immune-cell expression with the expression of the four identified prognostic genes. We found that M2 macrophages and resting-state CD4+ memory T cells were dominant, indicating an immunosuppressive state in HNSCC. Given the complex interplay between tumor genomics and antitumor immune responses, prediction algorithms that incorporate multiple biomarkers and information regarding immune infiltrates are likely to be necessary for accurate patient stratification. Consistent with the prognostic abilities of the four identified genes, correlation analyzes between the four genes and the 22 immune-cell types showed that the poor prognostic genes PVR and TNFRSF12A were negatively correlated with activated CD4+ T cells, CD8+ T cells, follicular helper T cells, and Tregs, whereas IL21R and SOCS1 were positively correlated with the above four cell types, suggesting that these four genes can partially reflect the state of the immune microenvironment in HNSCC. As noted in previous studies, the high level of Treg infiltration was positively associated with prognosis in HNSCC, which may support our results.6 10 41 However, the molecular mechanism underlying Treg enrichment and their function in HNSCC remain to be elucidated. Therefore, developing meaningful signatures that can determine the immune status of a patient is appealing. These signatures could be powerful prognostic biomarkers and, if correctly applied, facilitate patient stratification when determining immunotherapeutic outcomes.
Conclusions
Here, we performed RNA-seq analysis of immune-related genes in HNSCC, resulting in an independently validated prediction model, which includes four genes combined with the Path_N stage, and identified immune-cell types with significant prognostic associations for further study. Importantly, this prognostic signature performed well in both the HNSCC TCGA cohort and in patients from our clinical center. Prognostic factors associated with HNSCC could reflect immune disorders within the tumor microenvironment and independently distinguish patients with high risks of reduced survival. Thus, our novel predictive biomarkers, which include genetic characteristics, may not only provide novel insights into the underlying mechanisms and biological behaviors associated with HNSCC but may also benefit clinical decision-making for patients in the future.
References
Footnotes
YY and ZY contributed equally.
Contributors YC and ML conceived and designed the experiments. YY and ZY participated in the experiments and drafted the manuscript. YZ and JY contributed to the sample collection and interpretation of the data. SL and DF performed the statistical analysis. LW and CZ revised the manuscript. All authors read and approved the final manuscript.
Funding This work was supported by grants from the National Natural Science Foundation [Grant Number: 81772602, 91742105 and 91942309 to YC, 81902780 to YY], The Qing Lan Project, Jiangsu Provincial key research development program of China [BE2018750 to YC], the talents program of Jiangsu Cancer Hospital (YC201813 to YY), and the China Postdoctoral Science Foundation (2017M621676 to YY).
Competing interests None declared.
Patient consent for publication Not required.
Ethics approval All experiments were performed in accordance with the Declaration of Helsinki of the World Medical Association and were approved by the ethics committee of the Affiliated Cancer Hospital of Nanjing Medical University. All participants provided written informed consent.
Provenance and peer review Not commissioned; externally peer reviewed.
Data availability statement Data are available in a public, open access repository. The datasets supporting the conclusions of this article are included within the article and its additional files.