Article Text

Abstract
Background Reliable predictive and prognostic markers are still lacking for patients treated with programmed death receptor 1 (PD1) inhibitors for non-small cell lung cancer (NSCLC). The purpose of this study was to investigate the prognostic and predictive values of different baseline metabolic parameters, including metabolic tumor volume (MTV), from 18F-fluorodeoxyglucose positron emission tomography–computed tomography (18F-FDG PET/CT) scans in patients with NSCLC treated with PD1 inhibitors.
Methods Maximum and peak standardized uptake values, MTV and total lesion glycolysis (TLG), as well as clinical and biological parameters, were recorded in 75 prospectively included patients with NSCLC treated with PD1 inhibitors. Associations between these parameters and overall survival (OS) were evaluated as well as their accuracy to predict early treatment discontinuation (ETD).
Results A high MTV and a high TLG were significantly associated with a lower OS (p<0.001). The median OS in patients with MTV above the median (36.5 cm3) was 10.5 months (95% CI: 6.2 to upper limit: unreached), while the median OS in patients with MTV below the median was not reached. Patients with no prior chemotherapy had a poorer OS than patients who had received prior systemic treatment (p=0.04). MTV and TLG could reliably predict ETD (area under the receiver operating characteristic curve=0.76, 95% CI: 0.65 to 0.87 and 0.72, 95% CI: 0.62 to 0.84, respectively).
Conclusion MTV is a strong prognostic and predictive factor in patients with NSCLC treated with PD1 inhibitors and can be easily determined from routine 18F-FDG PET/CT scans. MTV, could help to personalize immunotherapy and be used to stratify patients in future clinical studies.
- tumor biomarkers
- lung neoplasms
- immunotherapy
- biomarkers, tumor
This is an open access article distributed in accordance with the Creative Commons Attribution Non Commercial (CC BY-NC 4.0) license, which permits others to distribute, remix, adapt, build upon this work non-commercially, and license their derivative works on different terms, provided the original work is properly cited, appropriate credit is given, any changes made indicated, and the use is non-commercial. See http://creativecommons.org/licenses/by-nc/4.0/.
Statistics from Altmetric.com
Background
Treatment with immune checkpoint inhibitors, such as Pembrolizumab or Nivolumab, significantly improves survival in patients with metastatic non-small cell lung cancer (NSCLC) compared with chemotherapy.1–4
While this represents a major breakthrough in the treatment of metastatic NSCLC, immunotherapy also has known limitations. All patients will not benefit from immunotherapy. Indeed, only one out of five patients will achieve an objective response.1–4 Furthermore, about 15% of patients experience rapid paradoxical progression, known as ‘hyperprogression’, associated with poor overall survival (OS).5 Furthermore, since checkpoint inhibitors block the action of negative regulators of the cellular immune response, these treatments can cause immune-related adverse events (irAEs). As a result, severe toxicities (grade 3 or 4) occur in 7% to 27% of patients, depending on immunotherapy protocol.1–4 6
Thus, there is a clear need to better select patients before immunotherapy. Despite significant efforts, no clinical, histological or genetic parameters have been identified to reliably predict the success of immunotherapy so far. Although programmed death receptor ligand 1 (PDL1) expression is associated with objective response, PDL1 testing alone appears to be insufficient for patient selection.7–9 Furthermore, the need for reliable selection criteria is emphasized by the high cost of immunotherapy.10
For several malignancies, including NSCLC, MTV derived from 18F-fluorodeoxyglucose positron emission tomography–computed tomography (18F-FDG PET/CT) studies has been shown to be a strong prognostic factor for OS in patients treated with chemotherapy or radiotherapy.11–15 However, only limited data exist on the prognostic relevance of MTV for immunotherapy.
The purpose of this study was to investigate the prognostic value of MTV and other metabolic parameters from baseline 18F-FDG PET/CT, in patients with NSCLC treated with programmed death receptor 1 (PD1) inhibitors and to evaluate their predictive value concerning early treatment discontinuation (ETD).
Methods
Population
This study is part of a prospective study conducted in our institution investigating the value of standard 18F-FDG PET/CT to monitor tumor response to immunotherapy.16 From October 2016 to March 2019, consecutive patients scheduled to initiate immunotherapy as their first or later line systemic treatment for advanced or metastatic NSCLC were prospectively included in this open, uncontrolled and non-randomized current-care study (FDG ECMI, n°ID-RCB: 2018-A02116-49). The study was approved by the regional ethics committee and regulatory agencies. Informed consent was obtained from all individual participants.
The inclusion criteria were (1) pathologically proven metastatic NSCLC, irrespective of the histologic subtype, (2) indication to start immune checkpoint inhibitors in first or later line according to current recommendations, (3) Eastern Cooperative Oncology Group (ECOG) performance status 0 to 2 and (4) no prior immunotherapy. The exclusion criteria were (1) clinical or biological contraindication for immune checkpoint inhibitors, (2) vulnerable patients as defined in Article L1121-5 to L1121-8 of the French Public Health Code, (3) high glycemia (>9 mmol/L) before PET scanning and (4) a delay higher than 3 months between baseline PET and initiation of immunotherapy.
Patients received Pembrolizumab administered intravenously at a standard dose of 2 mg/kg every 3 weeks, or Nivolumab at a standard dose of 240 mg every 2 weeks, following guidelines.
18F-FDG PET/CT exams
18F-FDG PET/CT scans were performed before the start of immunotherapy for every patient.
All 18F-FDG PET/CT scans were performed using the same PET/CT system (Biograph mCT, Siemens healthcare, Erlangen, Germany). Patients were instructed to fast for at least 6 hours before the intravenous injection of 3 MBq/kg of 18F-FDG. Sixty minutes later, a low-dose attenuation CT acquisition was performed (50 kV, 50 mA, 5 mm slice thickness) followed by a static 3D PET acquisition was performed from vertex to mid-thighs with image duration of 150 s per bed position, an axial field of view of 13 cm and a matrix of 256×256 pixels. Lastly, a diagnostic CT scan was performed from vertex to mid-thighs, including a dedicated chest acquisition (auto-kV, auto-mA, 1 mm slice thickness) after a venous injection of iodinated contrast agent in the absence of allergy or renal impairment.
PET images were reconstructed using the ordered-subsets expectation maximization-3D iterative algorithm (2 iterations, 21 subsets), with point-spread function and time-of-flight correction (Ultra-HD PET). The image voxel counts were calibrated to activity concentration (Bq/mL) and decay corrected using the time of tracer injection as the reference.
18F-FDG PET/CT parameters were measured using PET/CT viewer,17 18 a free plug in for FIJI.19 Images were reviewed by two nuclear medicine physicians. One nuclear medicine physician performed the segmentation, then the other reviewed it. In case of disagreement, segmentation was corrected by consensus. Pathological hypermetabolic foci obviously deemed to be due to the therapy-related inflammation or immune activation (eg, symmetrical uptake in enlarged hilar/mediastinal lymph nodes, diffuse splenic uptake, colitis and so on) were excluded of the lesion analyses.
Peak standardized uptake values normalized by body weight (SUVpeak) were calculated in 10 mm diameter regions of interest placed on the highest uptake site of the tumors. The maximum standardized uptake value (SUVmax) was calculated for the most intense lesion. To assess tumor burden, the MTV was defined as the sum of volumes enclosed by a 41% isocontour around each tumor lesion voxel with the maximum 18F-FDG uptake, as recommended by the European Association of Nuclear Medicine.20 Total lesion glycolysis (TLG) was obtained by multiplying the MTV by the mean SUV.
Follow-up and clinical endpoints
The following clinical parameters were recorded: age at treatment initiation, gender, immunotherapy start date and molecule, prior treatments (surgery, radiotherapy, and systemic chemotherapy), TNM staging and presence of brain metastases. Histological characteristics included histological type and pretreatment PDL1 tumor expression when available.
Patients were followed during at least 6 months with regular clinical evaluations and standard of care imaging including follow-up brain MRI and systematic 18F-FDG PET/CT studies after 7 weeks and 3 months of treatment. The delay between the initiation of the treatment and the decision to stop it, as well as the reason for this stop (tumor progression, toxicity, patient’s refusal to continue the treatment) were recorded.
The primary endpoint was OS defined as the time from initial immunotherapy to death from any cause.
ETD was a secondary endpoint. ETD was defined as a treatment period of less than 3 months. Confirmation of tumor progression and decisions to discontinue treatment were systematically made by a multidisciplinary review board considering clinical, biological and imaging data.
Statistical analysis
Statistical analysis was performed using R, V.3.6.1. Continuous variables are summarized as medians and IQRs and categorical variables are summarized as numbers of patients and percentages. For continuous variables, statistical significance was determined using Student’s t-test or Wilcoxon's test. A p value of 0.05 or less was considered significant. Survival functions of subgroups of patients defined by SUVmax, SUVpeak, MTV and TLG were estimated using the Kaplan-Meier product limit method and compared using the log-rank test. Univariate analysis was used to identify factors associated with OS. Factors identified as being significant in the univariate analysis (p<0.05) were then entered into a Cox multivariate regression analysis model. Forward stepwise multivariate regression analysis was then carried out to identify factors that were correlated with OS. In each step, variables with a p value <0.05 were entered and those with a p value>0.10 were removed.
The predictive values of the different PET parameters for ETD were estimated through ROC curve analysis. To estimate the accuracy with which MTV and TLG could predict ETD, sensitivity and specificity were estimated using the median values as dichotomizing values.
Results
Patients’ characteristics
Overall 79 patients were prospectively included. Among them, four patients were excluded of the analysis because of presence of only one hypermetabolic bone lesion concomitantly treated with radiation therapy (n=1); rapid clinical worsening followed by death before immunotherapy initiation (n=1); immunotherapy initiation more than 3 months after baseline PET/CT (n=1); treatment carried out in another facility (n=1). A total of 75 patients were therefore evaluated in this study (table 1).
Patients’ characteristics
Patients’ clinical and biological characteristics at baseline are shown in table 1. The patients were mainly men (78.7%), had non-squamous cell carcinoma (84%) and had undergone first-line platinum-based chemotherapy with surgery and/or radiotherapy. Median patient age was 64 (IQR 58–72 years). All patients had a metastatic NSCLC. The histological subtype was squamous cell carcinoma in 16% (12/75) of patients and non-squamous cell carcinoma in 84% (63/75). PDL1 expression was known for 46 (61.3%)/75 patients.
The median delay between baseline PET and introduction of immunotherapy was 11 days (IQR 3–25 days).
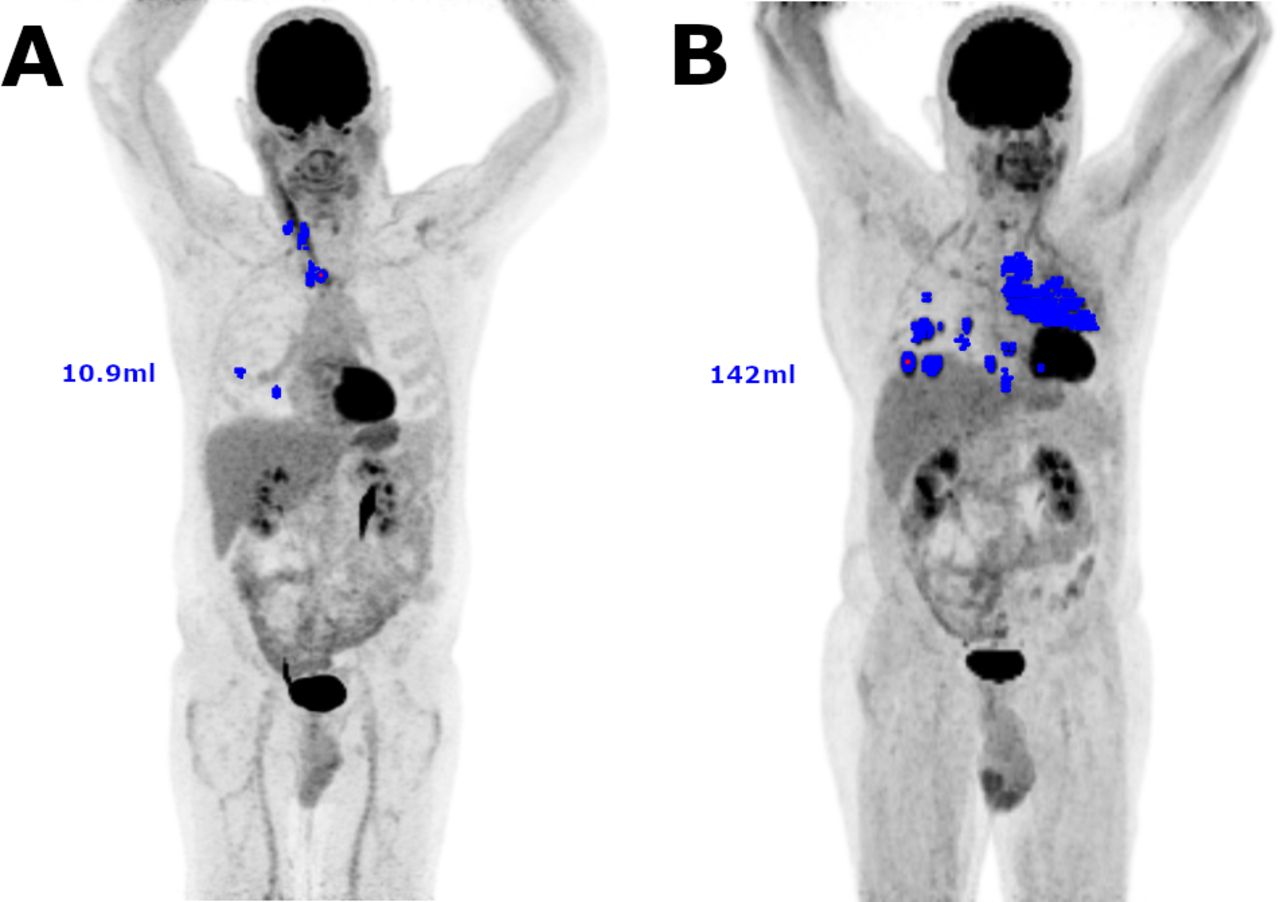
On baseline 18F-FDG PET/CT studies, the median values for SUVmax, SUVpeak, MTV, and TLG were 13.4 (IQR 9.4–17.7), 9.7 (IQR 6.9–12.9), 36.5 cm3 (IQR 16.7–87.5 cm3), and 267 (IQR 62.4–593), respectively. An example of MTV measurement is represented in figure 1.

Examples of 18F-FDG PET/CT tumor segmentations for MTV measurement. Included voxels are represented in blue on MIP images. (A.) Example of a small MTV (10.9 mL). (B) Example of a large MTV (142 mL). 18F-FDG PET/CT, 18F-fluorodeoxyglucose positron emission tomography–computed tomography; MIP, maximum intensity projection; MTV, metabolic tumor volume.
All patients were observed for at least 6 months from the start date of immunotherapy. The median follow-up was 12.3 months (IQR 6.1–19.3 months). At the time of data cut-off for the analysis, 29 patients had died.
Association between 18F-FDG PET/CT parameters and clinical factors
According to univariate analysis, patients who had not received previous chemotherapy had significantly higher MTVs (mean MTV: 134 vs 55 cm3, unilateral Wilcoxon test: p=0.035). Similarly, patients who had not received previous local treatments (surgery or radiotherapy) had significantly higher MTVs and TLGs (mean MTV: 87 vs 45 cm3, t-test: p=0.04 ; mean TLG : 684 vs 243, t-test : p=0.02; table 2)
Metabolic parameter values according to clinical characteristics and statistical associations between clinical and metabolic parameters
Age, gender, histological type and PDL1 expression were not significantly associated to MTV, SUVmax, SUVpeak or TLG.
Association of clinical and PET/CT parameters with OS
Higher MTV and TLG on baseline PET were significantly associated with poorer OS:
The median OS in patients with MTV above the median was 10.5 months (95% CI: lower limit: 6.2, upper limit: unreached), while the median OS in patients with MTV below the median was not reached (p<0.001, HR=5.37, 95% CI: 2.17 to 13.3).
The median OS in patients with TLG above the median was 10.5 months (95% CI: lower limit: 4.9, upper limit: unreached), while the median OS in patients with TLG below the median was not reached (p<0.001, HR=5.05, 95% CI: 2.05 to 12.5, figure 2).
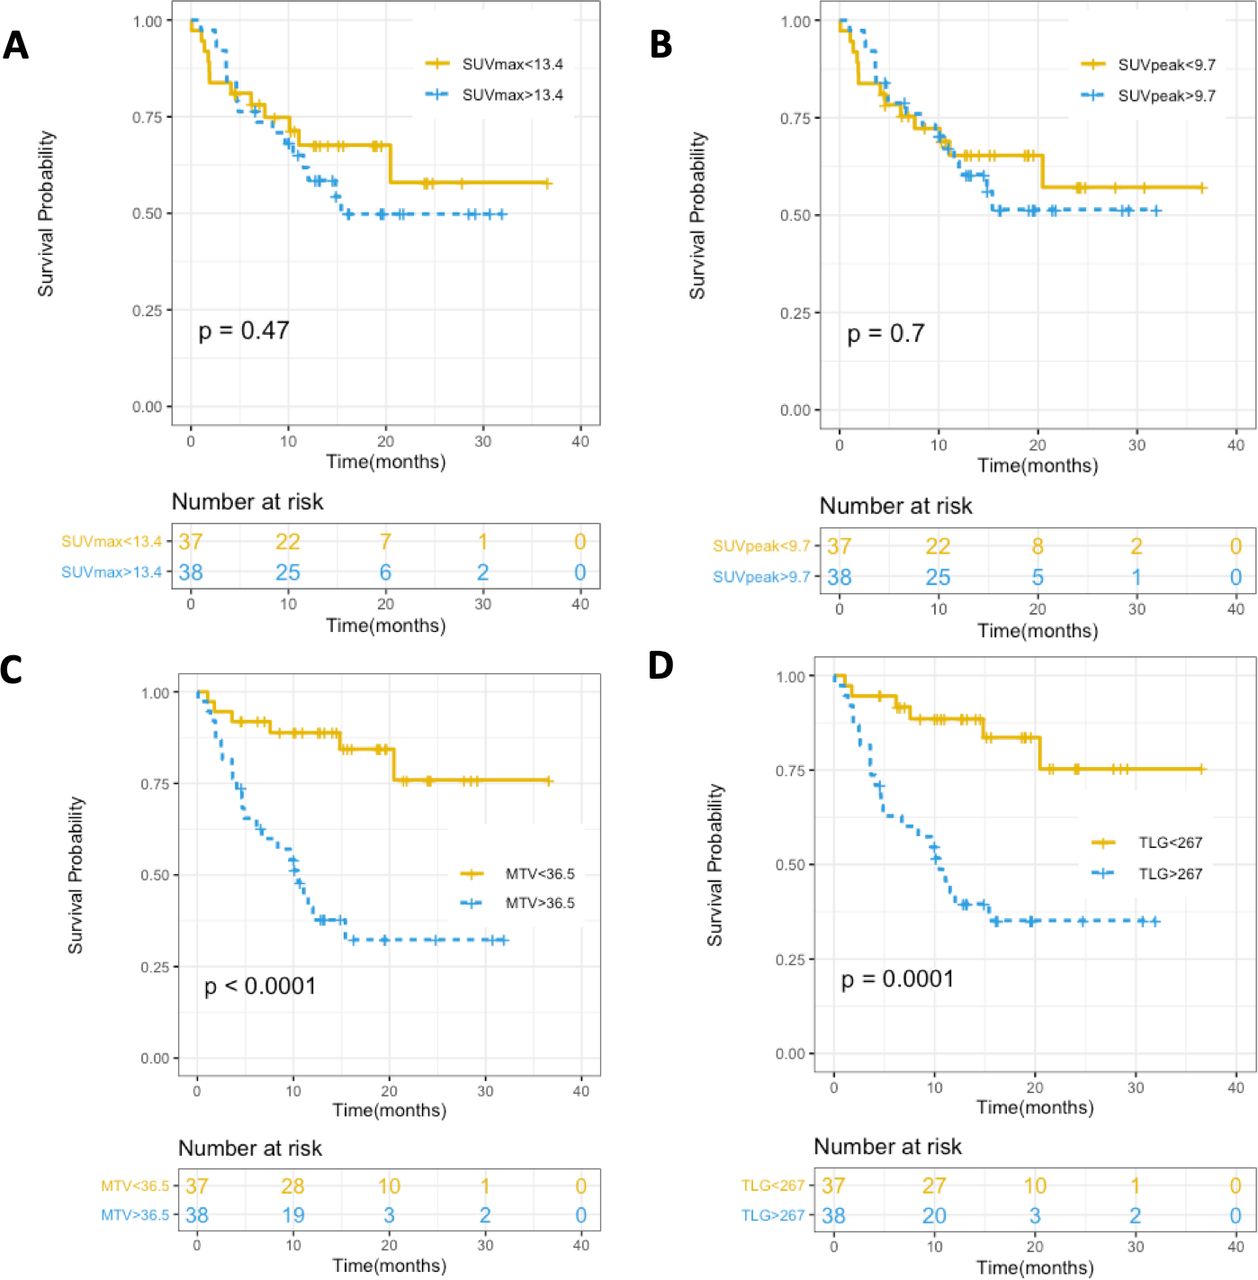
Kaplan-Meier curves for OS in relation to (A) SUVmax, (B) SUVpeak, (C) MTV, and (D) TLG (p values for log-rank test). MTV, metabolic tumor volume; OS, overall survival; SUVmax, maximum standardized uptake value; SUVpeak, peak standardized uptake value; TLG, total lesion glycolysis.
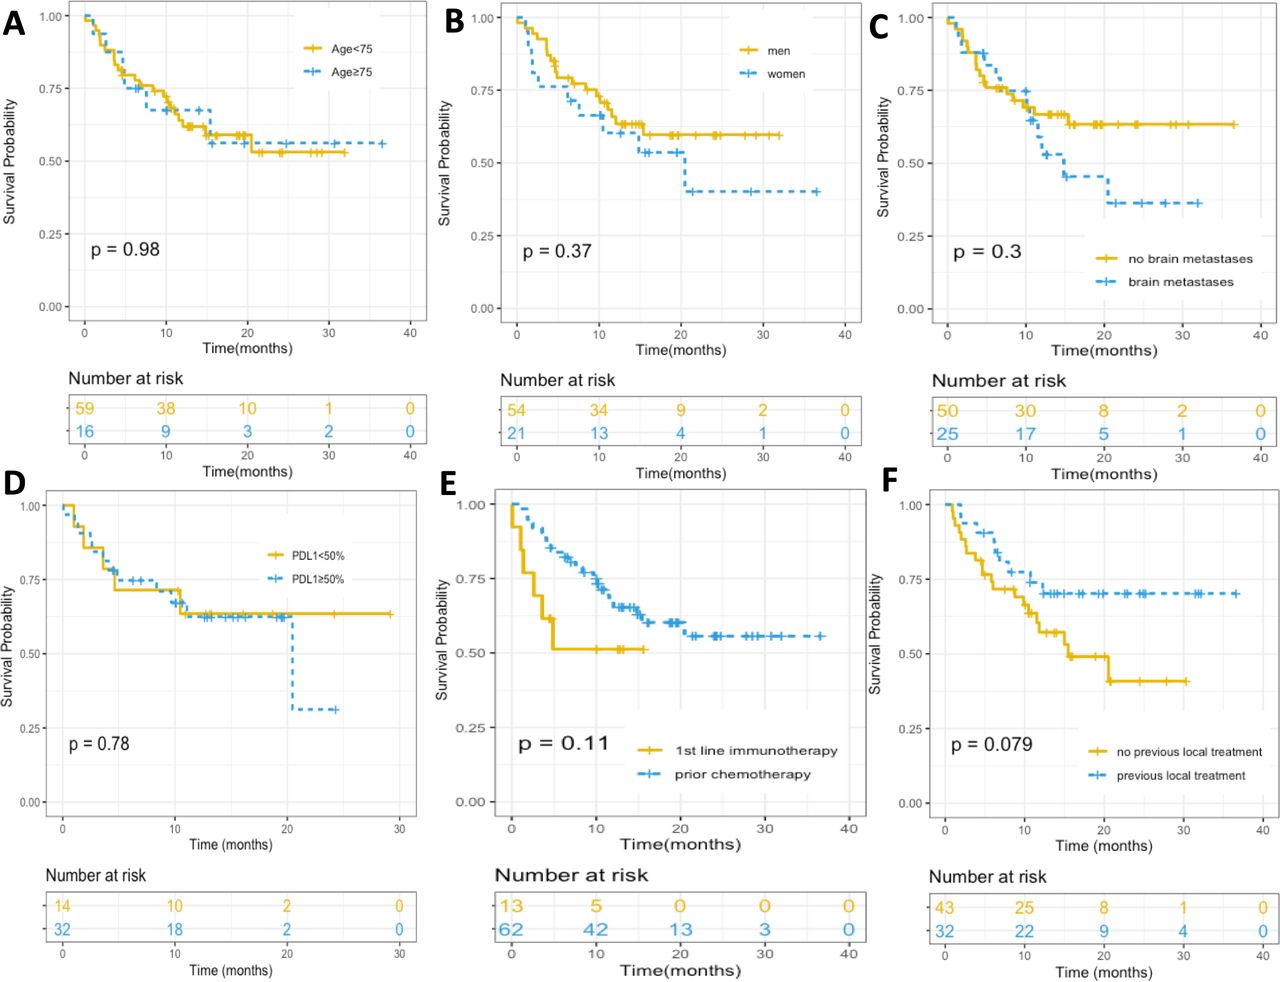
Age, gender, brain metastases, histological type, PDL1 tumor expression, SUVmax and SUVpeak were not statistically associated with OS (figures 2 and 3). History of previous chemotherapy or local treatment did not appear to be statistically associated with OS after application of the log-rank test, but patients treated with first-line immunotherapy had a significantly lower OS than patients who had previously been treated with chemotherapy based on a Gehan-Breslow generalized Wilcoxon test (p=0.04, table 3; figures 2 and 3)

Kaplan-Meier curves for OS in relation to (A) age, (B) gender, (C) presence of brain metastases, (D) PDL1 expression (when known), (E) prior chemotherapy and (F) prior local treatment (p values are given for log-rank test). OS, overall survival; PDL1, programmed death receptor ligand 1.
Factors associated with OS in patients with NSCLC
In a multivariate analysis including MTV, and history of previous chemotherapy and/or local treatment, MTV remained the only significant independent factor associated with OS (HR 4.50, 95% CI 1.89 to 10.7, p<0.001).
Prediction of ETD
Immunotherapy was discontinued less than 3 months after initiation for 27 (36%) patients. The reasons for ETD were as follows: rapid progression of disease in 26 patients, immunotherapy-related hepatitis for 1 patient.
ETD was a strong surrogate marker of OS as 23 (85.2%)/27 patients with ETD died during follow-up, with a median OS time of 4.63 (95% CI: 3.6 to 10.1). In comparison, among the 48 patients who did not have ETD, only 6 (12.5%)/48 died during follow-up (the median OS time was not reached). OS was significantly shorter in patients who had ETD than for patients who were treated for at least 3 months (log-rank test: HR=15.9, 95% CI: 6.34 to 39.8, p<0.00001).
Mean MTV in patients who had ETD was significantly higher than in patients without ETD (t-test: p=0.01). There were no significant differences in terms of TLG (p=0.13), SUVmax (p=0.56) or SUVpeak (p=0.76).
Figure 4 shows the receiver operating characteristic (ROC) curves for PET parameters to predict ETD. Only MTV (AUC=0.76, 95% CI: 0.65 to 0.87) and TLG (AUC=0.72, 95% CI: 0.62 to 0.84) could accurately predict ETD. SUVpeak and SUVmax had no predictive values. In our population, the best threshold values were 36.2 cm3 for MTV and 294 cm3 for TLG. Using the median MTV (36.5 cm3) and TLG (267 cm3) as threshold values, sensitivity and specificity were estimated to be 78% (95% CI: 62% to 93%) and 63% (95% CI: 49% to 76%), respectively for MTV and 74.1% (95% CI: 57.5% to 90.6%) and 64.5% (95% CI: 51.1% to 78.1%), respectively for TLG.

ROC curves representing the value of (A) MTV, (B) TLG, (C) SUVmax and (D) SUVpeak to predict ETD after immunotherapy. AUC, area under the curve; ETD, early treatment discontinuation; MTV, metabolic tumor volume; ROC, receiver operating characteristic; SUVmax, maximum standardized uptake value; SUVpeak, peak standardized uptake value; TLG, total lesion glycolysis.
Discussion
To our knowledge, this is the largest prospective study to indicate that a high baseline MTV is an important independent predictive and prognostic factor in patients with advanced NSCLC before treatment with immunotherapy as it can both predict ETD and poor OS.
The prognostic value of MTV on baseline 18F-FDG PET/CT in patients with various malignancies treated with chemotherapy or radiotherapy, including NSCLC,12 13 has been extensively studied. In contrast, data on the prognostic value of MTV in patients treated with immunotherapy are limited. In a recent retrospective study including 142 patients, Ito et al demonstrated the prognostic value of baseline MTV for patients treated with ipilimumab for a melanoma.21 As in the current study, SUVmax and SUVpeak were not associated to survival. Concurrently, in a recent study retrospectively analyzing 32 patients treated with immunotherapy for NSCLC,22 Evangelista et al found that the sum of SUVmax in all lesions (SUVmaxwb) was significantly higher in non-responding patients than in responding patients. MTV and TLG were also higher but not statistically significant. In our study, SUVmax was not significantly associated with OS. The SUVmaxwb parameter described by Evangelista et al takes into account SUVmax but also the number of lesions. The association with tumor response might therefore be linked to tumor burden rather than the intensity of 18F-FDG uptake. The absence of statistical significance concerning MTV and TLG could be due to the small number of patients and/or to the way tumor response was assessed.
Recent studies have shown the prognostic value of baseline tumor burden as assessed by CT in patients treated with immunotherapy for melanoma and NSCLC.23 24 The sum of the maximum diameters of target lesions on baseline CT scans (baseline tumor size, BTS) was used as an index of tumor burden. A BTS above the median was associated with a worse OS. Conceptually, MTV seems to be a better marker of total tumor burden than BTS. Indeed, BTS is based on the diameters of a limited number of lesions (up to 5) which are subjectively selected. This selection is based not only on lesion size, but also on how well lesions are delineated on CT images. Poorly delineated lesions such as bone lesions are most often not taken into account. Furthermore, the shapes of the selected lesions are not taken into account. For each lesion, only a one-dimensional diameter is measured, which is quite different to a three-dimensional volume. In contrast, MTV from 18F-FDG PET/CT is a much more accurate measurement of tumor volume, which takes into account all lesions with the exception of brain metastases.
Tumor burden appears to be associated with survival in patients treated with various immunotherapies for various malignancies. As immune checkpoint inhibitors are not targeted towards a specific malignancy and have shown efficacy in various types of cancers, we can assume that the mechanisms by which MTV is linked to survival is similar in those malignancies. Huang et al have shown that the ratio between circulating reinvigorated CD8 T cells and tumor burden as assessed by CT could predict tumor response in patients treated with immunotherapy for a melanoma.25 We can hypothesize that patients with a high tumor burden have a generally lower reinvigorated CD8 T cells relative to tumor burden ratio, which would explain their lower survival rates.
In addition, we found that baseline MTV could predict ETD during immunotherapy. A time to progression lower than 3 months has already been reported to be a good surrogate marker of poor OS in patients treated with immunotherapy for NSCLC.26 Our results agree with these findings.
Hashimoto et al recently published the results of a retrospective study highlighting the prognostic value of MTV and TLG for PFS and OS in 85 patients treated with anti-PD1 antibodies for a previously treated NSCLC.27 In another study, Castello et al highlighted that a high MTV associated with a high-derived neutrophil‐to‐lymphocyte ratio was associated with a higher risk of hyperprogressive disease and therefore to OS and PFS for 46 prospectively included patients treated with immune checkpoint inhibitors for a NSCLC.28
Our study confirms these results on a larger prospective cohort and further emphasizes that MTV is a reliable, non-invasive prognostic biomarker for patients treated with immunotherapy for a NSCLC.
We found that the optimal MTV cut-off value to predict ETD in our population was 36.2 cm3. In their study Hashimoto et al found an MTV value of 5 cm3 to be the best cut-off value to predict OS and PFS, yet interestingly a value of 90 cm3 was also a good cut-off value to predict PFS. In their study, Castello et al did not report an optimal cut-off value for MTV but stated that an MTV value of 66 cm3 was considered low and a value of 148 cm3 was considered elevated. Moreover, overall MTV values varied between studies. Indeed, in our study, the median MTV value was 36.5 cm3 compared with a median of 17.8 cm3 for Hashimoto et al and a mean of 143.2 cm3 for Castello et al. These differences in MTV values can be due to differences between populations but also to differences between PET/CT procedures and segmentation methods.29 Indeed the injected dose of 18F-FDG differs between studies, as well as the PET/CT models and acquisition and reconstruction parameters. Furthermore while our segmentation method was similar to Castello et al, using a fixed threshold of 41% and 42% of the SUVmax respectively, Hashimoto et al used a specific threshold for each patient, based on liver uptake. Standardized multicenter studies may be needed to find a robust optimal cut-off value for MTV. These different optimal MTV cut-off values can also indicate that while patients with a very low MTV clearly have a better outcome and those with a very high MTV clearly have a worse one, patients with more intermediate MTV values have less predictable outcomes. Other predictors may be of particular interest for patients with intermediate MTV values.
The strong prognostic value of MTV in patients treated with immunotherapy and its predictive value concerning ETD suggest several potential future clinical applications in patients with NSCLC undergoing immunotherapy. MTV could be considered for patient stratification before treatment decision. Even though immunotherapy has been shown to be superior to chemotherapy in NSCLC, response rates are still insufficient. Combining PD1 or PDL1 antibodies to chemotherapy or other immunotherapies could increase response rates and survival by boosting immune response or lowering tumor burden respectively, thus lowering the reinvigorated CD8 T cells to tumor burden ratio. In a randomized controlled trial in patients with metastatic or unresectable melanoma, the best overall response to ipilimumab was 19%, compared with 58% to a combination of ipilimumab and Nivolumab. However, combination therapy also significantly increased the risk of irAEs with grade 3 or 4 toxicity occurring in 59% of patients treated with combination therapy, compared with 28% of patients receiving ipilimumab monotherapy.30 Phase 1/2 trials have foreshown similar results concerning NSCLC.31 In addition, combinations of immunotherapy and chemotherapy have been shown to be superior to chemotherapy as first-line treatment for NSCLC.32 33
Interestingly, in our population, we found that patients treated with first-line immunotherapy had a significantly lower OS than patients who had previously been treated with chemotherapy and/or local treatments. This difference in survival may be explained by the fact that patients who had not received prior treatment had higher MTVs than patients previously treated with local treatment or chemotherapy. This would suggest that combined treatment protocols including a phase of chemotherapy and/or radiotherapy aiming to diminish MTV could be superior to immunotherapy alone in patients with high MTVs. This difference in survival might also possibly be due to a bias in patient selection. Indeed, in our analysis, we compare patients who survived throughout a prior treatment phase to patients who have never received prior treatment. Patients who died during a prior treatment phase were not analyzed. A randomized control trial comparing first-line treatment with an association of chemotherapy–immunotherapy to first-line treatment with immunotherapy alone could confirm or infirm our hypothesis.
Most importantly, our results suggest that while single agent immunotherapies might be sufficient to achieve response for patients with low MTV, patients with high MTV could benefit the most from combination therapies. Evidently, these hypotheses for future applications of MTV in clinical practice and research must be properly tested in prospective randomized clinical trials.
We recognize some limitations of this study.
The methodology for MTV measurements (with a threshold value of 41% of SUVmax in each lesion) has been used in several previous studies, but more sophisticated approaches may provide more accurate volume measurements. Nevertheless, we believe that MTV as determined with our simple approach provides a reliable and reproducible estimate of whole-body tumor burden and would allow investigators to quantitatively compare tumor burden between individual patients. As discussed previously, standardization of MTV measurements is necessary to compare values between different centers.
The minimum follow-up time of 6 months was not long enough to observe the median OS time in patients with MTV over the median, yet it was sufficient to observe a statistically significant difference in OS and PFS between patients with low or high MTV. While this difference exists, it might be underestimated due to insufficient follow-up duration.
Conclusions
Our findings indicate that total tumor burden in patients with advanced NSCLC as quantified by MTV based on 18F-FDG PET/CT is a strong independent prognostic factor for OS after immunotherapy and can be used to predict ETD.
MTV has the considerable advantage of being a non-invasive, whole-body biomarker, available in routine clinical practice. Baseline MTV could therefore be a useful and simple tool to determine which of a single versus combined treatment protocol would be most beneficial for each patient. Ideally, randomized controlled trials should stratify patients based on baseline MTV.
Acknowledgments
The authors would like to thank Colin Debaigt for protocol submission to regulatory agencies.
References
Footnotes
Contributors DC helped in conceptualization, formal analysis, investigation, methodology, and writing the original draft. MP collected resources, performed validation, project administration, and helped in writing review and editing. RS performed data curation, validation, and helped in writing review and editing. JD performed supervision, validation, and helped in writing review and editing. CB collected resources and helped in writing review and editing. MP collected resources and helped in writing review and editing. AS collected resources, performed validation and helped in writing review and editing. MI, JB, NM, and JO collected resources and helped in writing review and editing. OH helped in conceptualization, methodology, project administration, supervision, validation, and writing review and editing.
Funding This project was made possible by the support of the GIRCI Méditerranée (France) which financed a research grant.
Competing interests MI reports personal fees from AstraZeneca, Bristol-Myers Squibb, Roche, Boehringer-Ingelheim, and Merck & Co outside the submitted work.
Patient consent for publication Not required.
Ethics approval All procedures performed in studies involving human participants were in accordance with the ethical standards of the national research committee and with the 1964 Helsinki declaration and its later amendments or comparable ethical standards.
Provenance and peer review Not commissioned; externally peer reviewed.
Data availability statement Data are available upon reasonable request. Deidentified participant data is available upon reasonable request to David Chardin (chardindj@gmail.com). Reuse can be permitted in the setting of a discussed research collaboration.