Article Text

Abstract
Background Blood-based biomarkers of anti-solid tumor immune checkpoint blockade (ICB) response are lacking. We hypothesized that changes in systemic cytokine levels with the initial doses of programmed cell death protein 1 (PD-1) pathway inhibitors would correlate with clinical responses. New ultrasensitive ELISA technology enables quantitation of plasma proteins in sub-picogram-per-milliliter concentrations.
Methods We measured plasma cytokines by ultrasensitive single-molecule array assays in patients with non-small-cell lung carcinoma before and during treatment with anti-PD-1 therapy. Association with best overall response and progression-free survival (PFS) was assessed by Kruskall-Wallis test and Kaplan-Meier plots with log-rank test, respectively.
Results A decrease in interleukin 6 (IL-6) levels was associated with improved PFS (n=47 patients, median PFS: 11 vs 4 months, HR 0.45 (95% CI 0.23 to 0.89), p=0.04). The extent of change in IL-6 differed between best overall response categories (p=0.01) and correlated with changes in C reactive protein levels. We also explored plasma cytokine levels in relation to immune-related adverse effects and observed some correlation.
Conclusions This study suggests the presence of a systemic, proteomic reflection of successful ICB outside the tumor microenvironment with plasma decreases in IL-6 and CRP.
- cytokines
- biomarkers, tumor
- immunotherapy
- lung neoplasms
This is an open access article distributed in accordance with the Creative Commons Attribution Non Commercial (CC BY-NC 4.0) license, which permits others to distribute, remix, adapt, build upon this work non-commercially, and license their derivative works on different terms, provided the original work is properly cited, appropriate credit is given, any changes made indicated, and the use is non-commercial. See http://creativecommons.org/licenses/by-nc/4.0/.
Statistics from Altmetric.com
Background
Cytokines are immunological signaling proteins that act primarily at the local cellular level but are also released into circulation, where most are present at very low concentrations.1 Across malignancies, the response to immune checkpoint blockade (ICB) is accompanied by changes in cytokine gene expression and cellular composition in the tumor microenvironment (TME).2 These immunological changes reflect the direct mechanism of programmed cell death protein 1 (PD-1) blockade and precede changes in tumor burden. Compared with the pretreatment response biomarkers, tissue programmed death ligand 1 (PD-L1) levels and tumor mutation burden (TMB), on-treatment changes in TME gene expression more accurately reflect long-term responses.3 4 Many of these changes implicate soluble proteins, cytokines and chemokines, that could enter systemic circulation and represent attractive targets for minimally invasive response assessment.
Single-molecule array (Simoa), a new technology measuring protein levels down to attomolar concentrations, enables accurate quantification of serum and plasma cytokine levels.5–7 Here we apply this technology to the development of ICB response biomarkers. Recent studies with Simoa have begun to better characterize the physiological and laboratory variation in blood cytokine levels. Even among healthy adults, the baseline levels of serum cytokines have been shown to vary by as much as 104 in concentration.8 The intraindividual variation was small, when samples were drawn weekly at the same time of day, over many months. For individuals who became ill with viral infection, the cytokine levels peaked around the time of viral illness symptoms but returned back to baseline.8 These observations suggest that each individual has a cytokine setpoint, potentially contributed to by genetic variants affecting circulating cytokine levels,9 and that short-term perturbations due to either disease, vaccine or medication lead to temporary deviations from the setpoint. Another study characterized the in vitro stability of plasma cytokines.5 Even when cytokines are found at sub-picogram-per-milliliter concentration, they could be accurately measured from clinical material stored at room temperature, with minor decreases over a time frame of 4 to 6 hours between collection and freeze. These findings suggest biological relevance in monitoring changes in an individual’s plasma cytokine levels.
In this study, we investigated plasma changes in 12 cytokines in relation to responses to PD-1 blockade in patients with non-small-cell lung carcinoma. We also explored the association of longitudinal changes in six cytokines with immune-related adverse effects (irAEs) in three patients.
Methods
Sample selection and response assessment
In this retrospective study, pretreatment and on-treatment plasma was collected at the Dana-Farber Cancer Institute between 2014 and 2018. Clinicopathological data and treatment outcomes were collected from retrospective chart review and updated as of June 15, 2019. Pretreatment blood was drawn on the same day prior to first administration of PD-1 inhibitor. A total of 63 patients with NSCLC were treated with either PD-1 or PD-L1 inhibitor monotherapy (n=43), PD-1 or PD-L1 inhibitor and other immunotherapy in a clinical trial setting (n=4), or with PD-1 inhibitor chemoimmunotherapy (n=16) in the first-line treatment setting (see flow chart in online supplemental figure 1). Patients treated with chemoimmunotherapy were excluded from the primary analysis for interleukin 6 (IL-6). Progression-free survival (PFS) was defined as the time from the start of immunotherapy to the date of investigator-assessed radiographic progression or death, whichever occurred first. Patients who were alive without disease progression were censored on the date of their last adequate disease assessment.
Supplemental material
Sample processing and cytokine measurements
Plasma was derived from whole blood EDTA specimens. Samples were stored at room temperature until processing whereby plasma was separated by low-speed centrifugation for 10 to 15 min at room temperature, aliquoted, and frozen at −80°C as described previously.5 10 Simoa assays were performed on thawed plasma as previously described with specifications provided (online supplemental tables 1 and 2). High-sensitivity C reactive protein (CRP) assays were performed on the Roche Cobas instrument in the clinical chemistry laboratory at Brigham and Women’s Hospital.
Data analysis
All samples were measured in duplicate and averaged. Lower and upper limits of quantitation (online supplemental figure 2) were derived from calibrators and sample concentrations with less than 20% coefficient of variation. Cytokine levels outside the lower or upper limits of quantitation were set to the respective limit. The cut-off for significant change in IL-6 was derived from empiric validation of the collection protocol. It was observed that in the time window from 2 to 6 hours from blood collection, IL-6 consistently decreased by an average of 15% and a maximum of 30% in 19 unique samples across a wide concentration range.5 Therefore, at or above a conservative cut-off of 40%, changes between pretreatment and on-treatment levels from the same patient were considered to represent significant biological variation and not potential artifact from in vitro decreases. In vitro decreases in IL-6 could be mitigated by sample refrigeration and rapid processing; however, for the purposes of this exploratory study, standard clinical laboratory workflows were used.
Event-time distributions were estimated using the Kaplan-Meier method and compared with the log-rank test. IL-6 changes by best overall response (BOR) were compared by Kruskall-Wallis test. Data were analyzed and graphed in GraphPad Prism (San Diego, California, USA).
Results
We identified 47 patients with metastatic NSCLC treated with inhibitors of the PD-1 pathway (table 1); 33 received pembrolizumab, ten received nivolumab, and four received other agents.
Clinicopathological characteristics and outcomes according to per cent change in IL-6 with start of PD-1 inhibitor
All patients had plasma collected immediately before first infusion of PD-1 or PD-L1 inhibitor and at on-treatment timepoints between 17 and 196 days on treatment. The majority of patients had adenocarcinoma (83%) and history of smoking (94%). Approximately half of patients received pembrolizumab monotherapy in the first-line setting (53%) and PD-L1 immunohistochemistry (IHC) levels were a median of 70% positive. Median PFS in the PD-1 or PD-L1 inhibitor only group was 4.3 months, median OS was 19.3 months, and the median follow-up time was 26.9 months. The overall response rate was 28% (13/47, 13 partial response (PR), 0 CR) and the disease control rate was 70% (33/47, 20 stable disease, 13 PR, 0 CR). 30% (14/47) had BOR of progressive disease.
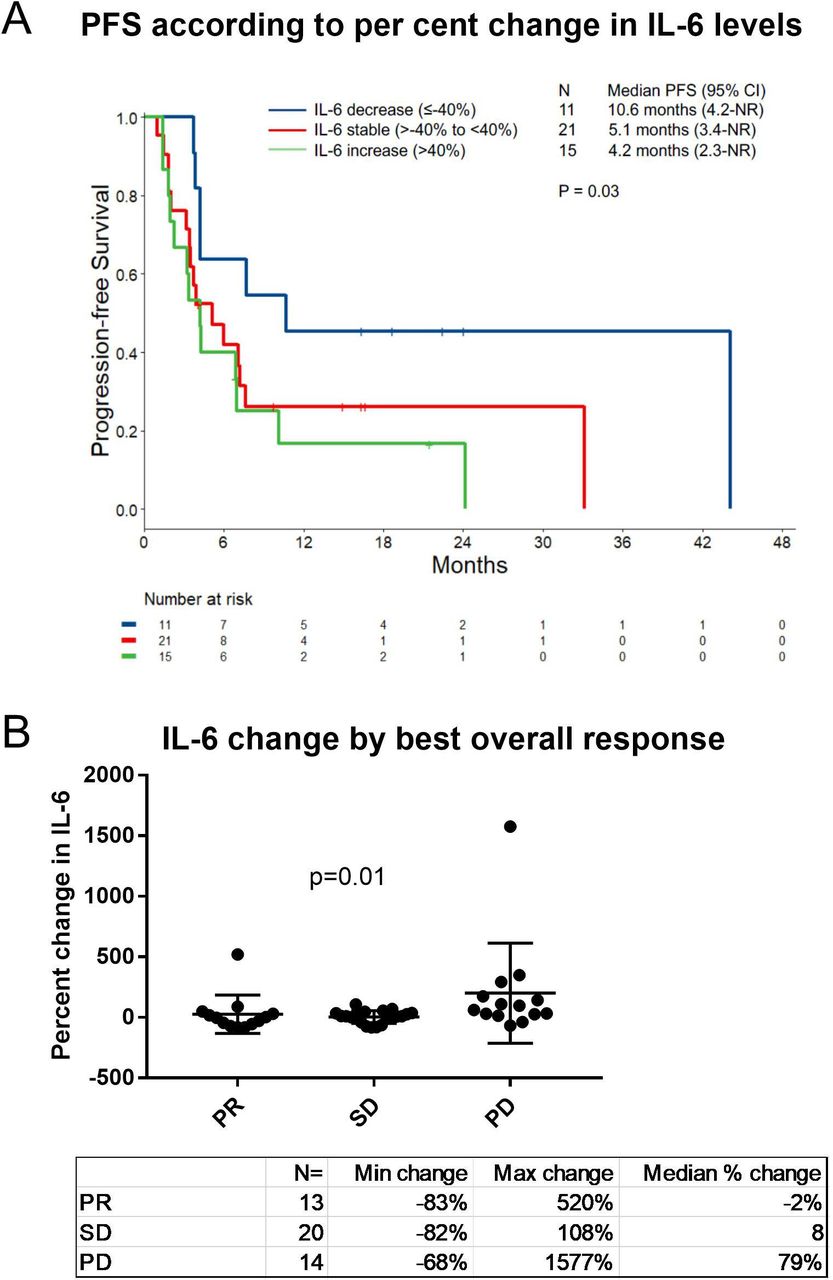
In this cohort, patients had a significantly different PFS according to whether they had decreased, stable or increased plasma IL-6 concentrations comparing pretreatment to on-treatment levels (p=0.03, figure 1A; table 1, earliest available on-treatment sample). Significant biological variation in IL-6 levels was predetermined as ≥40% change by experimental validation of the sample collection protocol (see description in the Methods section). Patients with decreased IL-6 (decreases of more than 40% from pretreatment to on-treatment timepoints, n=11) had a median PFS of 11 months (95% CI 4.2—NR) whereas those with stable (n=21) or increased IL-6 (n=15) had a median PFS of 5 months (95% CI 3.4—NR) and 4 months (95% CI 2.3—NR), respectively. The distributions of IL-6 changes differed according to BOR category, with more increases in IL-6 in the progressive disease category (p=0.01; figure 1B). Pretreatment IL-6 levels ranged from 0.58 to 68 pg/mL and did not correlate with PFS (online supplemental figure 3A). On-treatment IL-6 levels ranged from 0.60 to 78 pg/mL and only the quartile of patients with the lowest levels tended to have a longer PFS (p<0.01; online supplemental figure 3B). The majority of patients were sampled within 30 days of the baseline and only three patients had on-treatment samples collected after 70 days. Removing these three outliers from the analysis did not reduce the p value for the association to PFS. For patients in this cohort with available data, there was no significant association of PFS with either PD-L1 levels (n=29) or TMB (n=27) (online supplemental figure 3C,D). Patients with IL-6 decreases were younger (p=0.046) and had higher PD-L1 IHC levels (p=0.003) and higher TMB (p=0.02) (table 1, Kruskall-Wallis, age and TMB, and Fisher’s exact test, PD-L1). KRAS mutations were not observed in the IL-6 decreased group but were not significantly different across the categories (table 1, p=0.064, χ2 test). In a multivariate model, after adjusting for age, performance status, PD-L1 and TMB, IL-6 change did not retain a significant association with PFS (multivariable Cox regression analysis). However, due to the small sample size, neither did the known prognostic factors PD-L1 and TMB. We continued to a second patient cohort to study other potential cytokine changes (see flow chart in online supplemental figure 1).

Outcomes by interleukin 6 (IL-6) change (A). Progression-free survival (PFS) by IL-6 change category (decreased, stable, increased) from pretreatment to on-treatment with programmed cell death protein 1 (PD-1) inhibitor. Patients treated with chemotherapy were excluded from this analysis. p=0.03 by log-rank test for trend. (B). Percent of IL-6 change from pretreatment to on-treatment by best overall response category. p=0.01 by Kruskall-Wallis test. NR, not reached; PD, progressive disease; PR, partial response; SD, stable disease.
In addition to IL-6, we developed 10 other ultrasensitive Simoa plasma cytokine assays and one assay for the soluble IL-6 receptor, α subunit. We then applied the battery of assays on a subset of a cohort with clear clinical responses at first scan and uniform timepoints of plasma sampling: 12 pembrolizumab monotherapy patients (six responders and six non-responders) with on-treatment samples drawn three weeks after first dose of therapy (online supplemental figure 4A). All assays had sufficient sensitivity to precisely measure these protein levels in patient plasma (online supplemental figure 4B and 5). In addition to IL-6, IL-10, CXCL10, IL-17A, IL-15, and IL-1β increased more in non-responders (online supplemental figure 4C). We extended the analysis to patients with mid-treatment samples available at three weeks after the first dose of pembrolizumab monotherapy (another n=13) or chemoimmunotherapy (n=16, figure 2, including 25 monotherapy patients who were part of the figure 1 cohort) regardless of treatment response. Median PFS in both the PD-1 monotherapy and the chemoimmunotherapy subgroups was 6.0 months in this cohort. IL-6 decreases were observed with and without other cytokine decreases and in patients with both high and low PD-L1 IHC and TMB levels as well as across other disease characteristics (figure 2A). IL-6 percentage decrease was not statistically associated with PFS or BOR category in monotherapy (n=25) or chemoimmunotherapy (n=16) treated subgroups of this mixed cohort of limited sample size. None of the other five cytokines (IL-10, CXCL10, IL-17A, IL-15, and IL-1β) demonstrated statistically significant association with clinical responses in this cohort, though more decreases tended to occur in the half of patients with better clinical outcomes for all except IL-1β (figure 2A). Because IL-6 directly promotes CRP production in the liver, we measured CRP in this cohort and found a correlation to the per cent change in IL-6 (figure 2B) and the relationship to PFS (HR 0.23 (95% CI 0.08 to 0.66), p=0.006; figure 2C).11 As was observed with IL-6, the pretreatment levels did not correlate with response (figure 2D); however, the quartile of patients with the highest on-treatment CRP levels had shorter PFS (figure 2E).

All cytokines and C reactive protein (CRP) percent changes 3 weeks after one dose of pembrolizumab (monotherapy or combination chemotherapy) in relation to other clinicopathological features and treatment outcomes. (A) Heatmap illustrating cytokine changes in relation to other clinicopathological correlates and outcomes. Each column represents one patient. Columns are organized by best overall response category and progression-free survival (PFS). Black squares indicate missing data. White squares indicate KRAS non-mutated and no smoking history in the respective rows. Pink squares indicate PFS data were censored and patients did not progress by the analysis cut-off date. (B) Comparison of interleukin 6 (IL-6) and CRP percent changes. (C–E) PFS by CRP levels at either pretreatment (C), on-treatment (D) or percent change (E) according to quartile (D and E) or change category (C). p=0.42, p<0.01, p<0.01 by log-rank test for trend. IHC, immunohistochemistry; PD-L1, programmed death ligand 1; TMB, tumor mutation burden; NR, not reached.
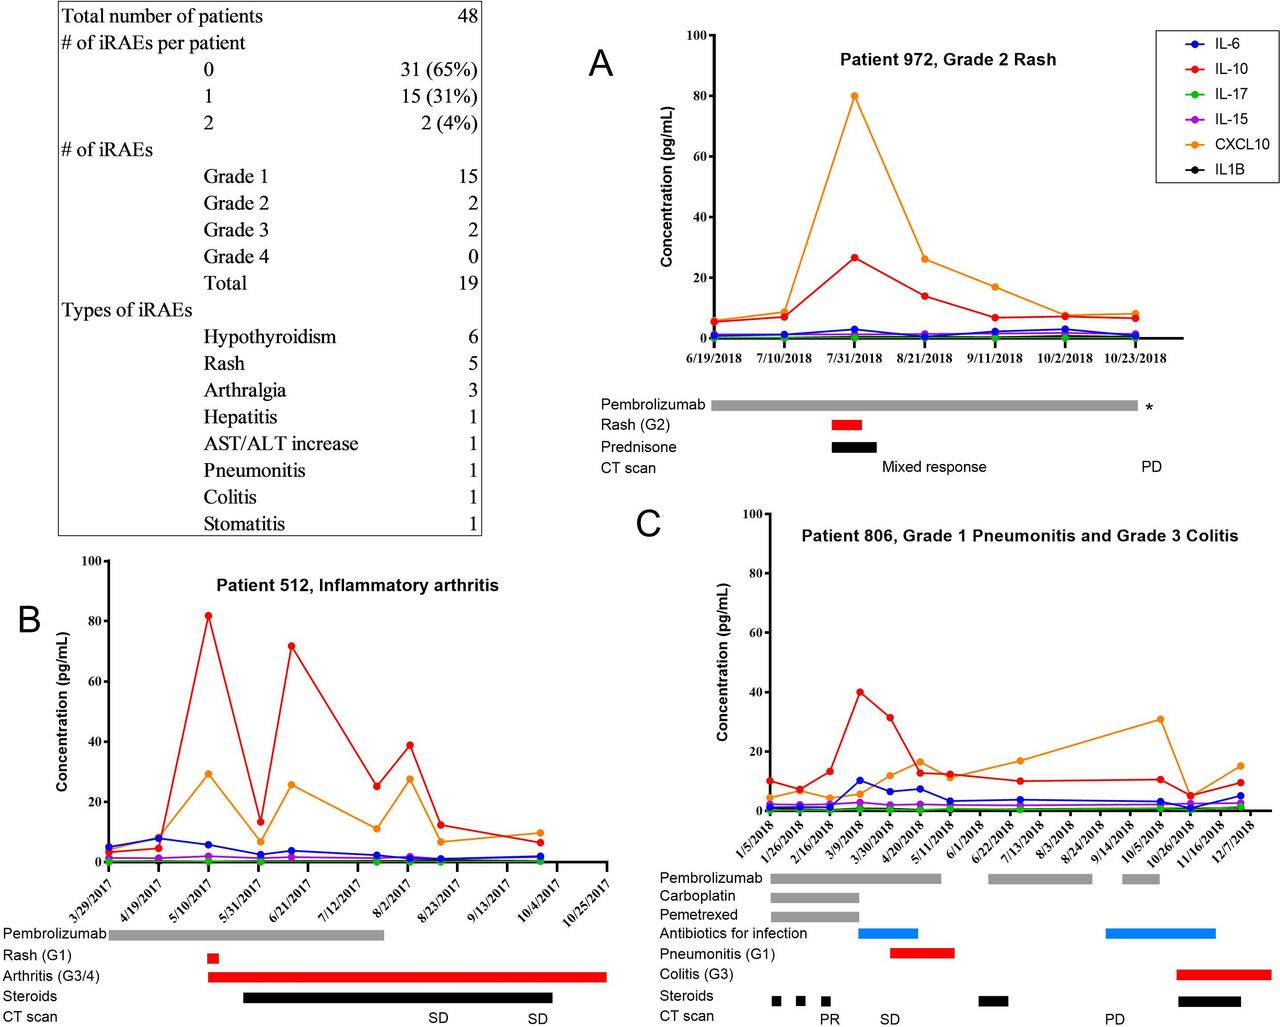
Given the associations of both CRP and IL-6 decreases with PD-1 inhibitor response, we next explored longitudinal changes in cytokines in relation to clinical appearance of irAEs. We focused on the first-line pembrolizumab monotherapy and chemoimmunotherapy treated cohort (n=48), as they had plasma collected every three weeks while on therapy. At the time of analysis, four of these patients were identified as having grade 2 or 3 irAEs (figure 3). After the second cycle of therapy, patient 972 (figure 3A) developed a rash over 80% body surface area with rapid response to oral steroids and no pembrolizumab treatment delay. The patient had a high peak in CXCL10 and IL-10 levels with return to baseline on resolution of clinical symptoms. This patient showed a mixed response to therapy on CT scan three weeks after developing the rash and had disease progression approximately four months later. Patient 512 (figure 3B) developed an inflammatory polyarthritis leading to cessation of pembrolizumab and showed recurrent peaks in CXCL10 and IL-10 levels. Patient 806 (figure 3C) was started on chemi-immunotherapy and developed comorbid infections as well as a grade three colitis leading to pembrolizumab cessation. IL-10 and IL-6 peaks predominated during infectious complications with CXCL10 peaked with colitis flare. Patient 696 (online supplemental figure 6) was initially misattributed as having an autoimmune hepatitis and was ultimately diagnosed on pathology with cholecystitis. This patient also demonstrated large peaks in CXCL10 and IL-10 around the time of LFT elevation, illustrating the general role of these cytokine networks in infectious and autoimmune processes.

Cytokine changes in relation to immune-related adverse effects (irAEs). Table summarizing the frequency, severity, and type of irAEs in the pembrolizumab monotherapy and chemoimmunotherapy cohort. Each panel represents longitudinal cytokine levels for a single patient with irAEs. The plots reflect concentrations of six cytokines (color key, top right) measured at 3-week intervals, just prior to each pembrolizumab infusion. The gray bars reflect duration of pembrolizumab treatment, red bars reflect duration of irAEs, black bars reflect steroid treatment, and blue bars reflect antibiotic treatment for infectious complications. Radiological responses and imaging timepoints are indicated along the bottom. ALT, alanine aminotransferase; AST; aspartate aminotransferase; IL, interleukin; PD, progressive disease; PR, partial response; SD, stable disease.
Discussion
In this study, we demonstrate that decreases in plasma IL-6 and CRP are associated with improved outcomes with anti-PD-1 therapy in NSCLC. We observe that percent change from baseline is the measure associated with treatment outcomes, likely because of the wide range of physiological baseline levels across individuals. The enhanced sensitivity of the Simoa platform enabled precise measurement of cytokine changes in plasma.
A major limitation of this study is that these findings with IL-6 and CRP came from two retrospective patient cohorts and that the findings could not be validated between the two cohorts. IL-6 associated significantly with PFS in the first cohort (n=47) but not the second, which was underpowered to show the degree of association observed in the first cohort (n=25), though the association of IL-6 and PFS did trend in the same direction. CRP was statistically associated with PFS in the second cohort but was not measured in the first cohort due to sample shortage. The identification of anti-PD-1 monotherapy-treated NSCLC subjects became more difficult in the course of this study due to the changing landscape of NSCLC treatment with the addition of anti-PD-1 to chemotherapy. Validation of these results in independent cohorts is crucial and can proceed with other retrospective sample sets, or from prospective studies if the impact of chemotherapy on these cytokine changes is first characterized.
Another limitation of this study is that the dynamic changes showed statistically significant association with PFS in univariate analysis but not in a multivariate model adjusting for age, performance status, PD-L1 and TMB. However, neither PD-L1 nor TMB were significantly associated with PFS in this multivariate model, which could be attributed to small sample size. Further research is needed to confirm the association of IL-6 and CRP decreases with increased responsiveness to anti-PD-1 in NSCLC.
Cytokines are generalized immune-signaling molecules, as illustrated by the four longitudinally monitored patients with cytokine peaks coinciding with irAEs and infectious complications. This lack of specificity may dampen cytokine predictive ability as ICB biomarkers, especially in patients with infectious comorbidities, viral disease, vaccination or other immunomodulatory therapy. However, monitoring changes in a narrow three-week (or even shorter) window around the start of PD-1 inhibitor may focus the association to ICB responses. Further research with larger patient cohorts sampled at uniform early on-treatment timepoints is needed to understand the predictive accuracy of plasma IL-6 and CRP decreases for radiological responses. Should these initial observations be supported, the rapid identification of monotherapy responders could help allocate higher risk therapies such as immunotherapy combinations and other investigational agents to monotherapy non-responders earlier in the course of their disease.
This clinical association to treatment response raises the question of whether there is a direct link between the IL-6/CRP pathway and the mechanism of PD-1 inhibitors. We sensitively measured 11 plasma cytokines implicated in the immunotherapy response and only IL-6 was associated with response across the cohort. Higher levels of IL-6 and/or CRP have been described as independent risk factors for poor response to PD-1 inhibition in melanoma and triple-negative breast cancer.12 13 In vitro studies have suggested CRP directly interferes with T-cell function.13 IL-6 has immunosuppressive functions and may drive a myeloid compartment that contributes to innate treatment resistance, such as the accumulation of T-cell suppressing neutrophils as was observed in mouse models of IL-17 and KRAS-driven NSCLC sensitive to IL-6 depletion.14 Intriguingly, in this study, there was a trend for fewer KRAS-mutant cancers in the group with IL-6 decreases and better PD-1 inhibitor outcomes; therefore, it will be interesting to further explore the potential association between plasma IL-6 changes and tumor mutational drivers, including KRAS and serine threonine kinase STK11/LKB1 mutations.
It is also possible that IL-6 directly reflects changes in tumor burden in NSCLC. Previous preclinical studies have shown IL-6 production by lung adenocarcinoma tumor cell lines and positivity in primary tumors.15 In a mouse model of NSCLC responding to PD-1 blockade, IL-6 levels decreased in bronchoalveolar lavage fluid.16 It is possible that a similar mechanism extends to patients and peripheral blood. Another possibility is that decreases in circulation reflect redistribution of inflammatory cells to the TME. The mechanistic possibilities for these observations are numerous. Here, we provide evidence to exclude that the changes in the levels of the solubilized form of the IL-6 receptor underlie the observed changes in levels of IL-6.
In this report, we demonstrate that an ultrasensitive protein assay can detect changes that correlate to immunotherapy responses in NSCLC. Our observation of peripheral blood changes in cytokine levels with ICB response corroborates findings from clinical single-cell studies. By paired single-cell sequencing of T-cell receptor and RNA, Yost and colleagues observed a large contribution of anti PD-1-responsive cytotoxic T cells from peripheral blood after treatment, which would not be reflected in a pretreatment tumor-infiltrating lymphocyte assessment.17 Huang and colleagues performed immunoprofiling of peripheral blood T cells and found that the ratio of a reinvigorated phenotype to tumor burden correlated to response.18 Single-cell and single-molecule studies, such as these, will likely overcome sensitivity boundaries and lead to on-treatment blood-based biomarkers to recognize and improve on solid tumor ICB responses much earlier in the course of treatment.
Acknowledgments
We thank the patients at Dana-Farber Cancer Institute for their contribution to this study.
References
Footnotes
Twitter @DrMarkAwad
Contributors AK, LC, MMA, PAJ, and DRW designed experiments. AK, BR, AA, CP, JS, and MS collected patient samples and clinical information. AK, LC, and PG performed experiments. AK, BR, and RN analyzed data and MMA and DRW critically reviewed the analysis. AK and DRW wrote the manuscript. All authors provided review of the manuscript.
Funding Sanofi provided research support for this study. The Expect Miracles foundation supported CP and JS.
Competing interests AK is an employee of Amgen and shareholder of Amgen and Allogene. RN is an employee and shareholder of Pfizer. CP is the principal founder of Xsphera Biosciences and is on the scientific advisory board of Xsphera Biosciences and Dropworks. CP has received honoraria from BioRad and AstraZeneca Korea. PAJ has received research support from Astellas, AstraZeneca, Daiichi Sankyo, PUMA, Eli Lilly, Boehringer Ingelheim, and Takeda Oncology and is a shareholder of Gatekeeper Pharmaceuticals and LOXO Oncology. MMA has received research support from Bristol-Myers Squibb, AstraZeneca, Genentech, and Eli Lilly. DRW is the scientific founder and a board member of Quanterix. AK and DRW received research support for this study from Sanofi. This research did not receive any other specific grant from funding agencies in the public, commercial or not-for-profit sectors. AK and DRW are named coinventors on a patent application related to this paper. The intellectual property is assigned to and owned by Partners Healthcare.
Patient consent for publication Not required.
Ethics approval Participation in this study was by institutional review board-approved protocol at Dana-Farber Cancer Institute with written informed consent prior to inclusion.
Provenance and peer review Not commissioned; externally peer reviewed.
Data availability statement Data are available on reasonable request. The datasets used and/or analyzed during the current study are available from the corresponding author on reasonable request.
Supplemental material This content has been supplied by the author(s). It has not been vetted by BMJ Publishing Group Limited (BMJ) and may not have been peer-reviewed. Any opinions or recommendations discussed are solely those of the author(s) and are not endorsed by BMJ. BMJ disclaims all liability and responsibility arising from any reliance placed on the content. Where the content includes any translated material, BMJ does not warrant the accuracy and reliability of the translations (including but not limited to local regulations, clinical guidelines, terminology, drug names and drug dosages), and is not responsible for any error and/or omissions arising from translation and adaptation or otherwise.