Article Text

Abstract
Background Obesity is a major risk factor for renal cancer, yet our understanding of its effects on antitumor immunity and immunotherapy outcomes remains incomplete. Deciphering these associations is critical, given the growing clinical use of immune checkpoint inhibitors for metastatic disease and mounting evidence for an obesity paradox in the context of cancer immunotherapies, wherein obese patients with cancer have improved outcomes.
Methods We investigated associations between host obesity and anti-programmed cell death (PD-1)-based outcomes in both renal cell carcinoma (RCC) subjects and orthotopic murine renal tumors. Overall survival (OS) and progression-free survival (PFS) were determined for advanced RCC subjects receiving standard of care anti-PD-1 who had ≥6 months of follow-up from treatment initiation (n=73). Renal tumor tissues were collected from treatment-naive subjects categorized as obese (body mass index, ‘BMI’ ≥30 kg/m2) or non-obese (BMI <30 kg/m2) undergoing partial or full nephrectomy (n=19) then used to evaluate the frequency and phenotype of intratumoral CD8+ T cells, including PD-1 status, by flow cytometry. In mice, antitumor immunity and excised renal tumor weights were evaluated ±administration of a combinatorial anti-PD-1 therapy. For a subset of murine renal tumors, immunophenotyping was performed by flow cytometry and immunogenetic profiles were evaluated via nanoString.
Results With obesity, RCC patients receiving anti-PD-1 administration exhibited shorter PFS (p=0.0448) and OS (p=0.0288). Treatment-naive renal cancer subjects had decreased frequencies of tumor-infiltrating PD-1highCD8+ T cells, a finding recapitulated in our murine model. Following anti-PD-1-based immunotherapy, both lean and obese mice possessed distinct populations of treatment responders versus non-responders; however, obesity reduced the frequency of treatment responders (73% lean vs 44% obese). Tumors from lean and obese treatment responders displayed similar immunogenetic profiles, robust infiltration by PD-1int interferon (IFN)γ+CD8+ T cells and reduced myeloid-derived suppressor cells (MDSC), yielding favorable CD44+CD8+ T cell to MDSC ratios. Neutralizing interleukin (IL)-1β in obese mice improved treatment response rates to 58% and reduced MDSC accumulation in tumors.
Conclusions We find that obesity is associated with diminished efficacy of anti-PD-1-based therapies in renal cancer, due in part to increased inflammatory IL-1β levels, highlighting the need for continued study of this critical issue.
- programmed cell death 1 receptor
- kidney neoplasms
- lymphocytes
- tumor-infiltrating
- immunotherapy
- CD8-positive T-lymphocytes
This is an open access article distributed in accordance with the Creative Commons Attribution Non Commercial (CC BY-NC 4.0) license, which permits others to distribute, remix, adapt, build upon this work non-commercially, and license their derivative works on different terms, provided the original work is properly cited, appropriate credit is given, any changes made indicated, and the use is non-commercial. See http://creativecommons.org/licenses/by-nc/4.0/.
Statistics from Altmetric.com
- programmed cell death 1 receptor
- kidney neoplasms
- lymphocytes
- tumor-infiltrating
- immunotherapy
- CD8-positive T-lymphocytes
Background
Although immune checkpoint blockade has revolutionized immune-based cancer treatment, clinical responses remain suboptimal. In renal cell carcinoma (RCC) less than 50% of patients achieve durable responses to antiprogrammed cell death (PD-1) monotherapy or dual blockade of PD-1 and cytotoxic T lymphocyte associated protein (CTLA)-4.1 As such, efforts are underway to identify the factors that limit treatment efficacy. Obesity may be one such factor.
Currently, over 39% of US adults have obesity (body mass index (BMI) ≥30 kg/m2).2 Obesity increases the risk of developing at least thirteen different types of cancer, including RCC,3 and prior reports suggest that over 60% of RCC subjects have overweight or obesity at diagnosis.4 Mounting evidence indicates that obesity negatively impacts immune function and immune-based interventions, such as vaccinations.5 Furthermore, multiple laboratories, including our own, have reported that obesity subverts antitumor immunity to facilitate tumor progression, particularly in preclinical models.6–11 Despite this, multiple retrospective studies have reported that obesity and/or an elevated BMI is associated with improved outcomes following chemotherapy, targeted therapies and/or immunotherapy administration in cancer subjects11–15—a paradox particularly evident in men with melanoma who received immune checkpoint inhibitors.12 Notably, several prior reports analyzed immunotherapy outcomes based partially or solely on results of clinical trials,12 15 16 raising the question of whether different outcomes may ensue with standard of care administration.
The effects of obesity on anti-tumor immunity and immune checkpoint blockade outcomes specifically in RCC patients remain unclear. Several prior studies examining RCC outcomes used a BMI cut-point of >25 kg/m2 which examines the effects of overweight plus obesity, rather than obesity alone.14 17 One such study found that a BMI >25 kg/m2 was associated with a trending reduction in overall survival (OS) in RCC patients (n=42) treated with anti-PD-1 or programmed cell death ligand (PD-L)1, but improved OS in RCC patients receiving targeted therapies at the same institution.18 However, another 2019 study of 90 RCC patients reported no difference in BMI status between patients who derived clinical benefit from anti-PD-1/PD-L1 versus those who were resistant to therapy.19 A third study found that in RCC patients (n=203) treated with immunotherapy (any monotherapy or combination of anti-PD-1/PD-L1/CTLA-4 during clinical trials or standard of care), obesity did not alter immune infiltration or improve survival after adjusting for risk score, but instead decreased PD-L1 expression and increased angiogenesis in renal tumors.16 Thus, further investigation of this critical issue is needed.
Here, we used multiple complimentary methods to examine the effects of obesity on anti-tumor immunity and anti-PD-1 outcomes in both RCC subjects and mice bearing orthotopic renal tumors. In doing so, we provide one of the first reports on interactions between obesity and immune checkpoint blockade outcomes in RCC patients receiving anti-PD-1 monotherapy as standard of care.
Methods
Human analyses
Retrospective study of metastatic RCC patients treated with anti-PD-1
An IRB-approved retrospective study of metastatic RCC patients treated with nivolumab or pembrolizumab at The University of Iowa (UI) and University of Alabama at Birmingham (UAB) Hospitals was conducted. Data were obtained via UI chart reviews or UAB mining of electronic hospital records using the i2B2 (Informatics for Integrating Biology and the Bedside) database to identify all patients (n=121) with kidney cancer who received nivolumab or pembrolizumab from December 2015 to June 2019. A chart review was conducted for all patients to obtain details on demographics, treatment specifics, date of progression and date of death (if expired) (online supplemental table 1). Only patients who had at least 6-months of follow-up from their first dose of immunotherapy, a BMI >18.5 kg/m2, and an Eastern Cooperative Oncology Group (ECOG) performance status score of 0–2 at treatment initiation were included in data analyses (n=72). Response to treatment (complete response, partial response, stable disease, progressive disease, not determined) was obtained from review of documentation in the attending clinical encounter. Patients were classified according to their BMI on the day of first dose of therapy based on the World Health Organization (WHO) standard definitions as either having obesity (BMI ≥30 kg/m2) or not (BMI 18.5–30 kg/m2).
Supplemental material
Prospective study of treatment-naive RCC subjects
Approval for this study was granted by the IRB of The UI. Adult patients with suspicious renal masses who were scheduled to undergo either partial or full nephrectomy were offered enrollment. Informed consent was obtained for subjects with localized renal masses (stages T1–T3) as well as age-matched and BMI-matched tumor-free healthy donors. Subjects with all histological subtypes of RCC were consented; only peripheral blood specimens with sufficient numbers of cells to permit collection of ≥20 000 events during flow cytometry (n=82) were analyzed; fresh tumor samples were obtained and stained from 19 subjects. Exclusion criteria: active secondary malignancy, immune-modulating medications and metastatic disease. Demographic information (online supplemental tables 2 and 3) was obtained from electronic health records. BMI was calculated from subject’s height/weight at surgery. Patients were classified according to their BMI based on the WHO standard definitions as non-obese (NOB) BMI <30 kg/m2 or as having obesity (OB) BMI ≥30 kg/m2.
Animals/diets
Female and male BALB/c mice (7–8 weeks of age) were purchased from the Charles River Frederick colony. Mice were maintained on a low-fat chow diet (LFD) for 1 week to acclimate, then randomized to either LFD or a high-fat diet (HFD; Research Diets; catalog #12492) for 20 weeks and were allowed ad libitum access to food and water throughout. After 20 weeks, lean, diet-induced obese (DIO) and OB-resistant (OB-Res) mice were identified as described,8 20 then randomized to treatment groups. Mice were housed five to a cage in standard caging under specific-pathogen-free conditions in 12:12 light:dark cycles at 22°C (72 °F average).
Cell lines
Renca, a BALB/c syngeneic renal adenocarcinoma cell line, was purchased from American Type Culture Collection (ATCC), engineered by lentiviral transduction to stably express firefly Luciferase, and cultured as described.21 Cells were used at the same passage number throughout the study to minimize experimental variation. CMS5, a BALB/c syngeneic fibrosarcoma cell line, was a generous gift of Paul Allen (Washington University School of Medicine) and was maintained as described.22 Cell lines were not validated after purchase/receipt. Renca and CMS5 cells were tested and identified as mycoplasma-negative.
Tumor challenge and therapeutic administrations
Orthotopic murine renal cancer model and AdTR/CpG/PD-1 therapeutic administration
Intrarenal tumor challenges were performed as reported.21 Renal tumor growth was confirmed at day 6 post-challenge via bioluminescent imaging (BLI). Seven days post-tumor challenge, mice were reinjected in the tumor-bearing kidney with either sterile saline or 100 µg CpG1826 (Integrated DNA Technologies) plus 109 pfu of replication-deficient adenovirus encoding a membrane-bound version of full-length murine tumor necrosis factor (TNF)-related apoptosis-inducing ligand (TRAIL) (AdTR) protein (UI Viral Vector Core). On days 10, 13 and 16 post-tumor challenge, mice received intraperitoneal injections of saline, 250 µg of Rat IgG2a Isotype Control (Clone: 2A3, BioXCell), or 250 µg of anti-PD-1 (Rat IgG2a, clone: RMP1-14, BioXCell). In some experiments, tumor-challenged mice receiving AdTR/CpG/PD-1 were injected i.p. every 3 days with saline or neutralizing antibody against CCL5 (50 µg/mouse, clone: 53405, R&D Systems) or interleukin (IL)-1β (20 mg/kg, clone: B122, BioXCell) beginning at day 5 or day −5 relative to tumor challenge, respectively.
Murine fibrosarcoma and adoptive transfer system
Subcutaneous tumor studies with CMS5 fibrosarcoma cells were completed as described.22 23 To track T cell proliferation, 1×10⁶ naive, CFSE-labeled, tumor antigen-specific, T cell receptor (TCR) transgenic CD8+ DUC18 T cells were adoptively transferred on day 4 post-tumor challenge. Tumor outgrowth was monitored via calipers. Inguinal draining lymph nodes were harvested 4 days after transfer for T cell proliferation assays. The no-DUC18 T cell control endpoint was day 15; the DUC18 T cell recipient endpoint was day 21 post-tumor challenge.
Bioluminescent imaging (BLI)
On day 6 post-tumor challenge, BLI was performed to confirm that tumor burdens were statistically equivalent across experimental groups prior to randomization to treatment. BLI was accomplished using an IVIS Lumina III (PerkinElmer) and analyzed as described.21 Tumor luminescence was calculated in radiance (photons/sec/cm2/sr) using the Living Image Software, V.4.5.2.
Sample preparation and flow cytometry
Murine sample preparation
Murine renal tumors were harvested and disrupted using a Miltenyi GentleMacs Dissociator (Miltenyi Biotech) in HBSS followed by enzymatic digestion in 5 ug/mL LiberaseTM (Roche;) and 37.5 ug/mL DNase I (Sigma-Aldrich) at 37°C with agitation for 30 min. Tumor-draining lymph nodes from CMS5 tumor-bearing mice were harvested and single cell suspensions were generated by disrupting with glass slides.
Human sample preparation
Human tumor samples obtained from surgical pathology on the day of nephrectomy were mechanically homogenized in Roswell Park Memorial Institute (RPMI) 1640 to a single cell suspension using a GentleMacs Dissociator, then stained without freezing. Human peripheral blood samples were taken in the preoperative area, processed over Ficoll to permit mononuclear cell harvest and frozen in autologous serum until use. Prior to staining, peripheral blood mononuclear cells were thawed and suspended in complete media (RPMI basal medium plus 10% fetal calf serum).
Flow cytometric analyses
To block Fc receptors, human samples were incubated in 5% normal rat serum and murine samples were incubated in TruStain FcX (BioLegend) and normal rat serum then stained using antibodies listed in online supplemental table 4. Intracellular staining of murine Foxp3 was performed according to manufacturer instructions using a Foxp3/Transcription factor staining set (ThermoFisher). For murine IFNγ, TNF⍺ and perforin intracellular staining, bulk tumor cells were ex vivo stimulated for 4 hours with plate-bound, purified anti-CD3 and anti-CD28 (BioLegend). GolgiPlug protein transport inhibitor (BD Biosciences) was added for the final 2 hours. Cells were harvested and stained using BD Biosciences Fixation/Permeabilization Solution Kit. Results were obtained using an Attune NxT (ThermoFisher) or BD LSR II (BD Biosciences) flow cytometer and analyzed with FlowJo Software. Dead cells were excluded via Zombie Aqua or Green Fixable Viability Dye (BioLegend). Fluorescence minus one controls were used to objectively determine gate boundaries for positive events.
RNA isolation/quantification/quality
Murine tumors were excised and stored in RNAlater stabilization solution (ThermoFisher) at −80°C until bulk RNA isolation using the Qiagen RNeasy Mini Kit. RNA integrity was determined using an Agilent 2100 Bioanalyzer. Samples with RIN values >8 were used in iRepertoire analyses.
NanoString immunogenetic profiling
As a screening tool, immune-related gene expression patterns were interrogated on whole-tumor RNA using the nanoString murine PanCancer Immune Profiling Panel according to manufacturer’s instructions by the UAB nanoString facility.
Protein quantification
Murine renal tumors were harvested, weighed, and disrupted using a Miltenyi GentleMacs Dissociator or pestle (USA Scientific) in Dulbecco’s Phosphate Buffered Saline (DPBS) at a concentration of 0.2 g of tissue per 1 mL of DPBS. Tissue supernatant was collected and stored at −80°C until processing. Murine cytokines/chemokines in tumor homogenates and human plasma leptin were quantified using the Bio-Plex Multiplex System (Bio-Rad) and analyzed on a Bio-Plex 200 (Bio-Rad) or MAGPIX (ThermoFisher) instrument.
Statistics
Statistical analyses were performed utilizing Prism, V.7.00 (GraphPad), unless specifically noted elsewhere. Gaussian distribution was assessed using Shapiro-Wilk normality testing. Throughout, statistical differences between two groups were analyzed using parametric two-tailed unpaired Student’s t-tests or non-parametric two-tailed Mann-Whitney U tests, as appropriate. Statistical significance is denoted as asterisks (*) for parametric tests or as pound signs (#) for non-parametric tests. Statistical differences among multiple groups with one independent variable were analyzed using parametric or Kruskal-Wallis nonparametric one-way analysis of variance (ANOVA) with Dunn’s post hoc multiple comparison testing. In studies with multiple groups and two independent variables (ie, obesity status and therapy groups), two-way ANOVAs were performed with Bonferroni’s post hoc multiple comparison testing. Statistical differences in studies examining survival outcomes in mice were calculated using Log-rank (Mantel-Cox) testing. To examine linear correlations, linear regression analyses were performed where indicated. To assess changes in tumor weights over time, mixed-effects modeling with a Bonferroni correction was used. Note that in all figures, statistical comparisons between all groups were performed; however, only comparisons that were significantly different or trending (p<0.15) were shown on figures to improve data clarity.
Statistical analysis for RCC patients receiving anti-PD-1
Patients’ demographic and clinical characteristics were summarized as mean and SD or median and range for continuous variables, and as frequency and proportion for categorical variables. In the univariate analysis, Wilcoxon test and Fisher’s exact test were used for continuous variables and categorical variables, respectively. OS was defined as the interval from the first dose of immunotherapy to the date of death or to the last follow-up date if patients were still alive (censored). Progression-free survival (PFS) was defined as the interval from the first dose of immunotherapy to the date of progression or the date of death and censored at the last follow-up date if the patients were still alive without progression. A multivariable Cox proportional hazard regression model was used to evaluate the association between OS/PFS and obesity status, controlling for age, sex, International Metastatic RCC Database Consortium (IMDC) risk score and the number of prior therapies. The associations between obesity status and other outcomes, such as deceased rate within 90 days, objective response rate and disease control rate, were evaluated using multivariable logistic regression with Firth’s penalized likelihood approach, controlling for age, sex, IMDC risk score and the number of prior therapies. All analyses were performed using SAS V.9.4.
Identification of murine therapy non-responders versus responders
The weights of excised tumor-bearing kidneys from individual lean treatment-naive mice at day 28 were recorded and the mean calculated. AdTR/CpG/PD-1 therapy reduced the mean day 28 tumor-bearing kidney weight by 75% relative to no therapy (NT) controls (see Figure 4 in the Results section). This value was, therefore, used as a threshold to objectively define treatment responders (ie, individual mice with a ≥75% reduction in excised tumor-bearing kidney weight relative to NT controls) vs treatment non-responders (NR) (ie, individual mice with a <75% reduction in excised tumor-bearing kidney weight relative to NT controls) in subsequent experiments. To control for slight, non-significant differences in day 28 tumor weights between lean, DIO and OB-Res mice, the 75% response threshold was defined for each group (ie, lean treated mice were compared with lean NT mice, DIO treated mice were compared with DIO NT mice, etc.).
Hierarchical clustering and visualization of expression (mRNA) results
Raw nanoString-determined gene expression reads were subjected to unbiased hierarchical clustering analysis according to previously published methods24 25 across all 750 genes in 21 different samples of interest using Matlab (version R2016b). Differential clusters are presented in an annotated heatmap based on standardized expression values, along with the resulting hierarchical clustering dendrogram. Differentially expressed genes were identified in nSolver Analysis Software (nanoString) as genes with an unadjusted p value of less than 0.05 vs the respective baseline control given the exploratory nature of this study. Cell type scores were generated through nSolver Advanced Analysis (nSolver V.4.0).
Data availability
Gene expression data from this study are available from the corresponding author on reasonable request.
Study approval
Written informed consent was received from each subject prior to inclusion and participation in our study. All animal procedures were approved by the Institutional Animal Care and Use Committee at UAB, an AAALAC-accredited institution.
Results
Obesity is associated with poorer PFS and OS in metastatic RCC patients receiving anti-PD- 1 as standard of care
We began by examining survival outcomes of RCC patients with and without obesity following anti-PD-1 treatment. Recent retrospective studies investigating the effects of obesity on immunotherapy outcomes in RCC have provided intriguing but conflicting results: that increased adiposity (defined as BMI >25 kg/m2) trended toward being detrimental,18 that obesity (BMI >30 kg/m2) had no impact on outcomes in multivariate analysis,16 or that obesity improved PFS but not OS in patients who showed primary clinical benefit.19
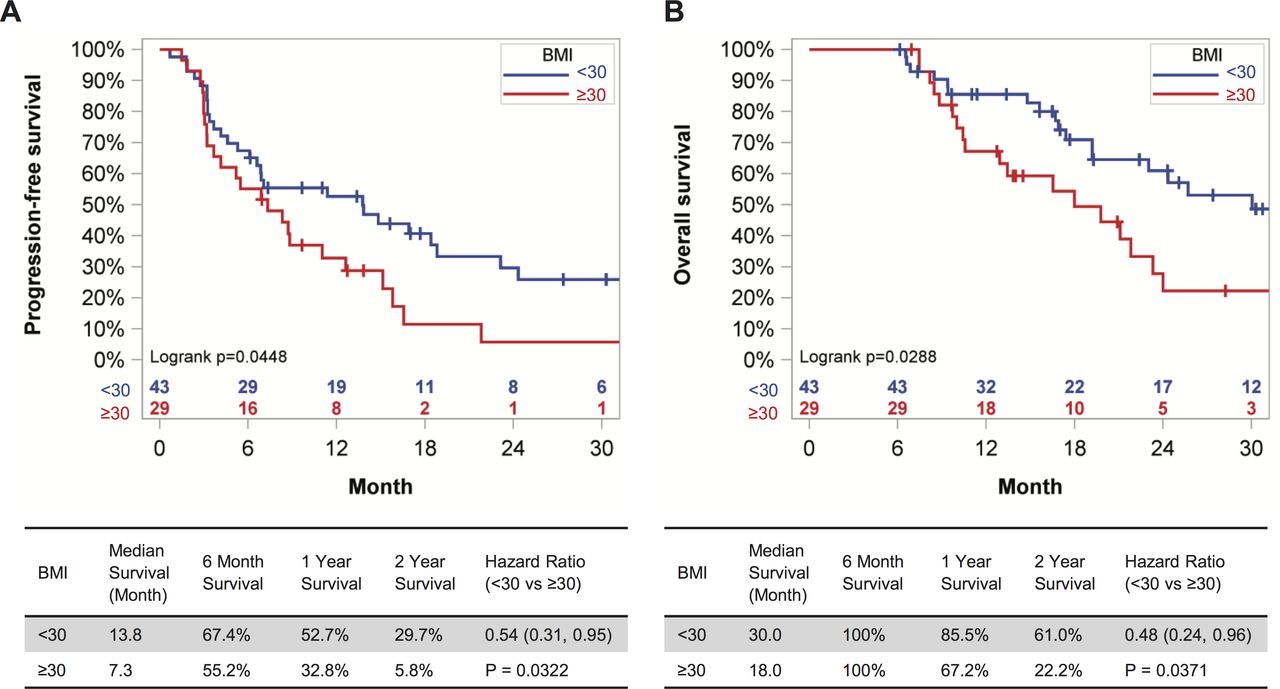
We examined this issue by evaluating outcome data for all RCC patients treated with standard of care anti-PD-1 who had ≥6 months of follow-up from treatment initiation at the UAB Hospital (n=54) and the UI Hospitals and Clinics (n=18). All patients had an ECOG performance status of 0–2 and none had received prior immunotherapies. Demographic information for these patients can be found in online supplemental table S1. The WHO-defined BMI cut point of 30 kg/m2 was used to identify patients with obesity (OB) or without (NOB). The mean BMI of the OB cohort was 38.74 kg/m2 vs 25.07 kg/m2 for the NOB. Obesity at treatment initiation was associated with a significant reduction in PFS (p=0.0448), as well as OS (p=0.0288) in Kaplan-Meier analysis (figure 1A,B). Specifically, obesity was associated with a 6.5 month-reduction in median PFS and a 12-month reduction in OS. Notably, after controlling for patients’ age, sex, number of prior treatments received and IMDC risk score, the Cox proportional hazard regression on PFS indicated that the hazard of disease progression in patients with BMI <30 kg/m2 was 54% (95% CI (0.31% to 0.95%; p=0.0322)] of that seen in patients with BMI ≥30 kg/m2; for OS the risk was 48% (95% CI 0.24% to 0.96%; p=0.0371). When BMI ≥25 kg/m2 was used as the cut-point instead of 30 kg/m2, to permit evaluation of the combined effects of overweight and obesity, the Kaplan-Meier curves for PFS and OS were no longer statistically different (p=0.5520 and p=0.8279, respectively) (online supplemental figure S1). Therefore, host obesity was associated with unfavorable survival outcomes in RCC patients treated with anti-PD-1 immunotherapy.

Host obesity is associated with reduced PFS and OS in metastatic RCC patients receiving anti-PD-1 as standard of care. (A) PFS and (B) OS of metastatic RCC patients with at least 6 months of follow-up after initiation of anti-PD-1 therapy as standard of care, categorized by BMI status. Survival curves for PFS and OS across BMI categories were generated with the Kaplan-Meier method. HRs were calculated from a Cox model controlling for patients’ age, sex, IMDC risk score and number of prior therapies. BMI, body mass index; IMDC, International Metastatic RCC Database Consortium; OS, overall survival; PD-1, programmed cell death-1; PFS, progression-free survival; RCC, renal cell carcinoma.
Obesity is associated with reduced frequencies of PD-1high intratumoral CD8+ T cells in treatment-naive renal cancer
We next explored the possibility that underlying differences in CD8+ tumor-infiltrating lymphocyte (TIL) phenotypes existed in the presence of obesity that might contribute to the divergent response to anti-PD-1. PD-1 expression on CD8+ T cells regulates T cell function and cancer immunotherapy outcomes.26 27 Although frequently regarded only as an indicator of T cell functional exhaustion, PD-1 is upregulated following antigen recognition during the earliest stages of T cell activation.28 Thus, in the tumor microenvironment, PD-1 expression is used as an indicator of T cell encounter(s) with antigens,27 29 as repeated TCR engagement increases PD-1 levels.26 30 31
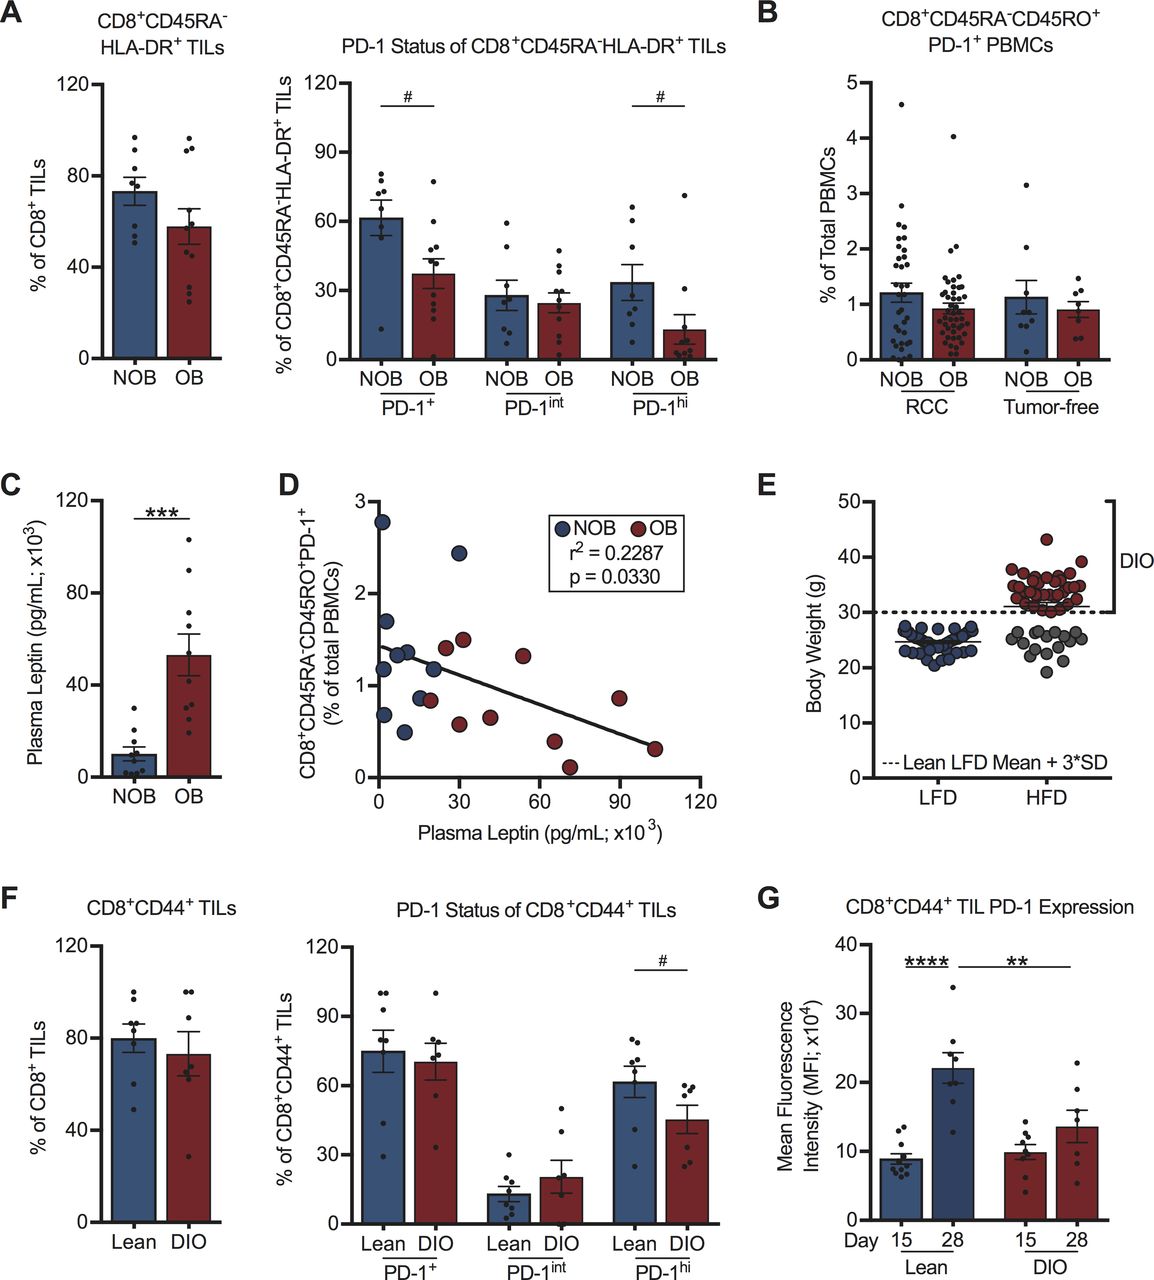
We therefore analyzed PD-1 expression on CD8+ TILs from a subset of treatment-naive RCC subjects with (BMI ≥30 kg/m2; n=11) or without (BMI <30 kg/m2; n=8) obesity. Demographic information for these RCC subjects can be found in online supplemental table S2. This analysis revealed that obesity did not alter the activation status (CD45RA-HLA-DR+) of CD8+ TILs; however, we observed significantly reduced percentages of activated PD-1+CD8+ TILs and PD-1highCD8+ TILs with obesity (figure 2A, gating as per online supplemental figure S2A). No obesity-associated alterations in the frequency of activated PD-1+CD8+ T cells in the peripheral blood of RCC subjects (n=82) or tumor-free donors (n=19) were found (figure 2B). Demographic information for tumor-free donors is in online supplemental table S3. RCC subjects with obesity displayed the expected elevations in plasma leptin (figure 2C and online supplemental figure S2B), but we found negative correlations between the frequencies of circulating activated PD-1+CD8+ T cells and plasma leptin concentrations (figure 2D) or subject BMI (online supplemental figure S2C), contrasting with prior findings in melanoma.11

Host obesity is associated with decreased frequencies of activated PD-1hiCD8+ TILs in treatment-naive human and murine renal tumors. (A) Intratumoral and (B) peripheral blood CD8+ T cells from NOB and OB treatment-naive RCC subjects and tumor-free donors. Frequencies of (A) activated CD8+ TILs, activated PD-1-expressing CD8+ TILs, and (B) peripheral blood activated PD-1+CD8+ T cells from RCC subjects and tumor-free donors. (C) Plasma leptin levels from NOB and OB RCC subjects. (D) Linear regression of activated PD-1+CD8+ PBMCs and plasma leptin levels in NOB and OB RCC subjects. (E) Resulting body weights for lean low-fat diet (LFD) and diet-induced obese (DIO) high-fat diet (HFD)-fed mice. Dotted line indicates three SD above the mean weight of LFD fed animals and the threshold for classification as DIO. (F) CD8+ TILs from lean and DIO treatment-naive mice on day 28 post-tumor challenge. Frequencies of activated CD8+ TILs and activated PD-1-expressing CD8+ TILs are shown. (G) PD-1 expression on activated CD8+ TILs at days 15 and 28 post-tumor challenge. Murine data are pooled from at least two independent experiments. Data are presented as means ±SEM. Statistical differences were calculated using parametric t-tests (***p<0.001), non-parametric Mann-Whitney U tests (#p<0.05), linear regression, or two-way ANOVA followed by post hoc Bonferroni’s multiple comparisons tests (**p<0.01, ****p<0.0001). ANOVA, analysis of variance; BMI, body mass index; NOB, non-obese; OB, obese; PBMCs, peripheral blood mononuclear cells; PD-1, programmed cell death-1; RCC, renal cell carcinoma; TIL, tumor-infiltrating lymphocyte.
To address whether similar trends existed regarding PD-1 expression on CD8+ TILs in mice with renal tumors, we used our well-characterized model of DIO.8 20 In this model, BALB/c mice are randomized to either a HFD or a LFD for 20 weeks prior to orthotopic renal tumor challenge. Individual HFD-fed mice are identified as DIO only if their body weight is ≥3 SD above the mean body weight of the age-matched LFD-fed lean cohort (figure 2E). DIO mice identified in this manner display classic hallmarks of obesity (increased adiposity, serum leptin and insulin and adipose tissue crown-like structures).8 20 Following orthotopic, syngeneic renal tumor challenge, an equivalent percentage of CD8+ TILs cells were activated (CD44+) in DIO and lean animals, with ~75% of these CD44+ T cells expressing PD-1, regardless of obesity status at a late day 28 time point (figure 2F, gating as per figure 3). Similar to what was observed in RCC subjects, DIO mice had decreased frequencies of activated PD-1highCD8+ TILs. Notably, PD-1 expression on activated CD8+ TILs from lean mice increased from day 15 to day 28 post-tumor challenge (figure 2G), reflecting prior reports that sustained antigen presence and repeated TCR engagement drive heightened PD-1 expression.30–32 In contrast, CD8+ TILs from DIO mice did not display increased PD-1 expression over time, resulting in significantly reduced PD-1 expression on CD8+ TILs from DIO mice versus lean mice at day 28 (figure 2G). Thus, we found that obesity was associated with reduced frequencies of PD-1highCD8+ TILs in both human subjects with RCC and an orthotopic mouse model of renal cancer, implying that CD8+ TIL responses are indeed altered by obesity and illustrating the clinical relevance of our murine tumor model for further study.

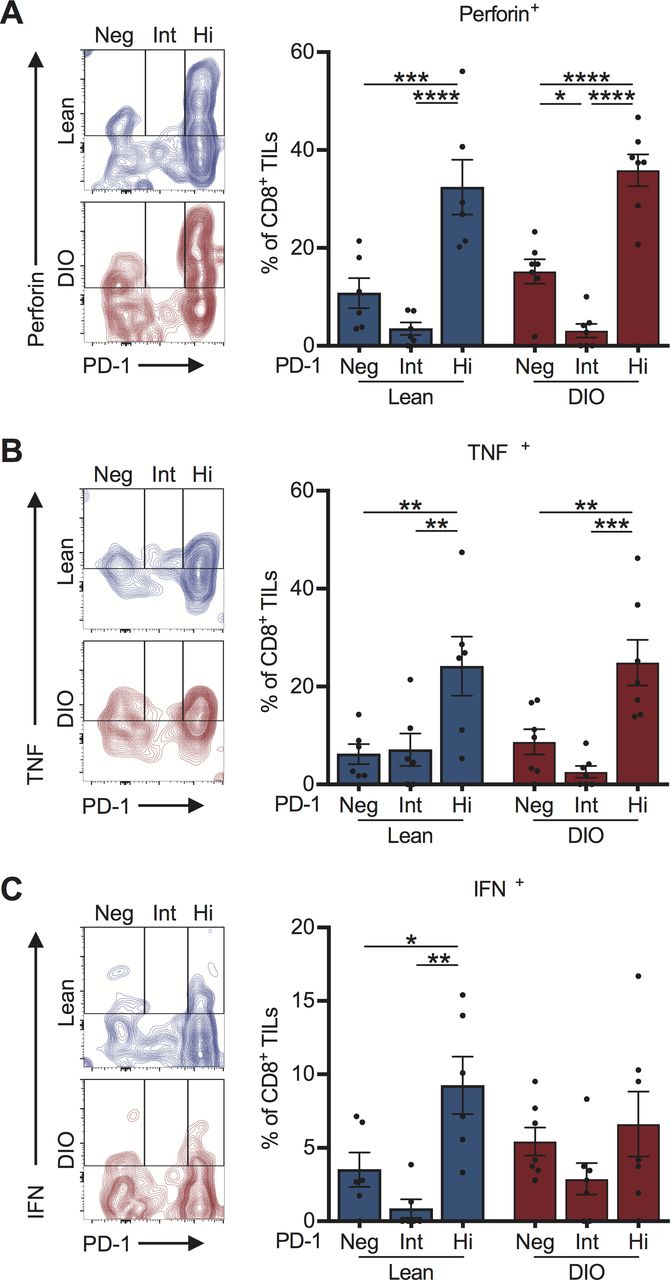
Tumor-infiltrating PD-1highCD8+ T cells retain potent effector function in both lean and DIO treatment-naive mice. On day 28, post-tumor challenge CD8+ TILs from lean and DIO treatment-naive mice were evaluated ex vivo for their expression of PD-1 and production of effector cytokines (A) perforin, (B) TNF⍺ and (C) IFNγ. Representative flow plots for each cytokine are shown. Graphs show data pooled from at least two independent experiments and presented as means ±SEM for indicated cell subpopulations based on PD-1 status. Statistical differences were calculated using two-way ANOVA with Bonferroni’s multiple comparisons tests (*p<0.05, **p<0.01, ***p<0.001, ****p<0.0001). ANOVA, analysis of variance; DIO, diet-induced obese; Hi, PD-1 high; IFNγ, interferon-γ; Int, PD-1 intermediate; Neg, PD-1 negative; PD-1, programmed cell death-1; TIL, tumor-infiltrating lymphocyte; TNF⍺, tumor necrosis factor ⍺.
PD-1highCD8+ TILs retain effector function in the treatment-naive setting
We next assessed the functional capacity of PD-1highCD8+ TILs from treatment-naive mice as prior studies indicated that, depending on the tumor type,33 PD-1+CD8+ TILs can exist either as functional effectors or as exhausted cells that are resistant to re-invigoration with anti-PD-1. We found a higher frequency of PD-1highCD8+ TILs secreting perforin and tumor necrosis factor (TNF)α relative to PD-1int or PD-1neg subsets (figure 3A,B). This pattern was conserved within both lean and DIO cohorts. Similar patterns were observed for interferon (IFN)γ secretion in lean, but not DIO, mice (figure 3C). Thus, obesity is associated with reduced frequencies of functionally-competent, PD-1highCD8+ TILs in the treatment-naive setting, suggesting the presence of a diminished endogenous T cell response.
Obesity compromises the response to a combinatorial PD-1-based immunotherapy
Given the obesity-associated decrease in functional PD-1highCD8+ TILs in our murine model, we hypothesized that host obesity would impair anti-PD-1 immunotherapy outcomes. However, single agent anti-PD-1 was unable to reduce day 28 excised renal tumor burdens in either lean or DIO mice (figure 4A,B, and online supplemental figure S3A, respectively). Notably, lean mice treated with anti-PD-1 did experience significant, but modest, improvements in survival relative to NT controls (figure 4C), an outcome reflecting survival benefits detected in RCC patients who receive anti-PD-1 monotherapy. Consequently, we developed a combinatorial therapeutic approach to evaluate the effect of host obesity on immunotherapy outcomes, wherein anti-PD-1 was administered downstream of our previously described in situ T cell priming therapy.8 34 This priming approach consists of adenovirus encoding murine TRAIL (AdTR) coadministered with the toll-like receptor 9 agonist CpG (AdTR/CpG) at day 7 post-tumor challenge (figure 4A), after renal tumors are established and when tumor burdens are statistically equivalent based on BLI (figure 4H).35 36 Both AdTR37 and CpG38 have been used in phase 1 clinical trials with low toxicity, illustrating potential translational relevance. Here, combinatorial AdTR/CpG/PD-1 reduced renal tumors by 75% in young, lean mice and was more efficacious than either AdTR/CpG or anti-PD-1 alone (figure 4B), leading to prolonged survival through day 100 (figure 4C). A similar analysis in older, DIO mice revealed that neither single agent anti-PD-1, AdTR/CpG, nor the combination of AdTR/CpG/PD-1 led to a significant reduction in excised renal tumor weights (online supplemental figure S3A). However, the combination of AdTR/CpG/PD-1 did reduce tumor weights by 42% in DIO mice, an improvement over the 3% and 4% reductions detected in mice treated with either anti-PD-1 or AdTR/CpG, respectively.
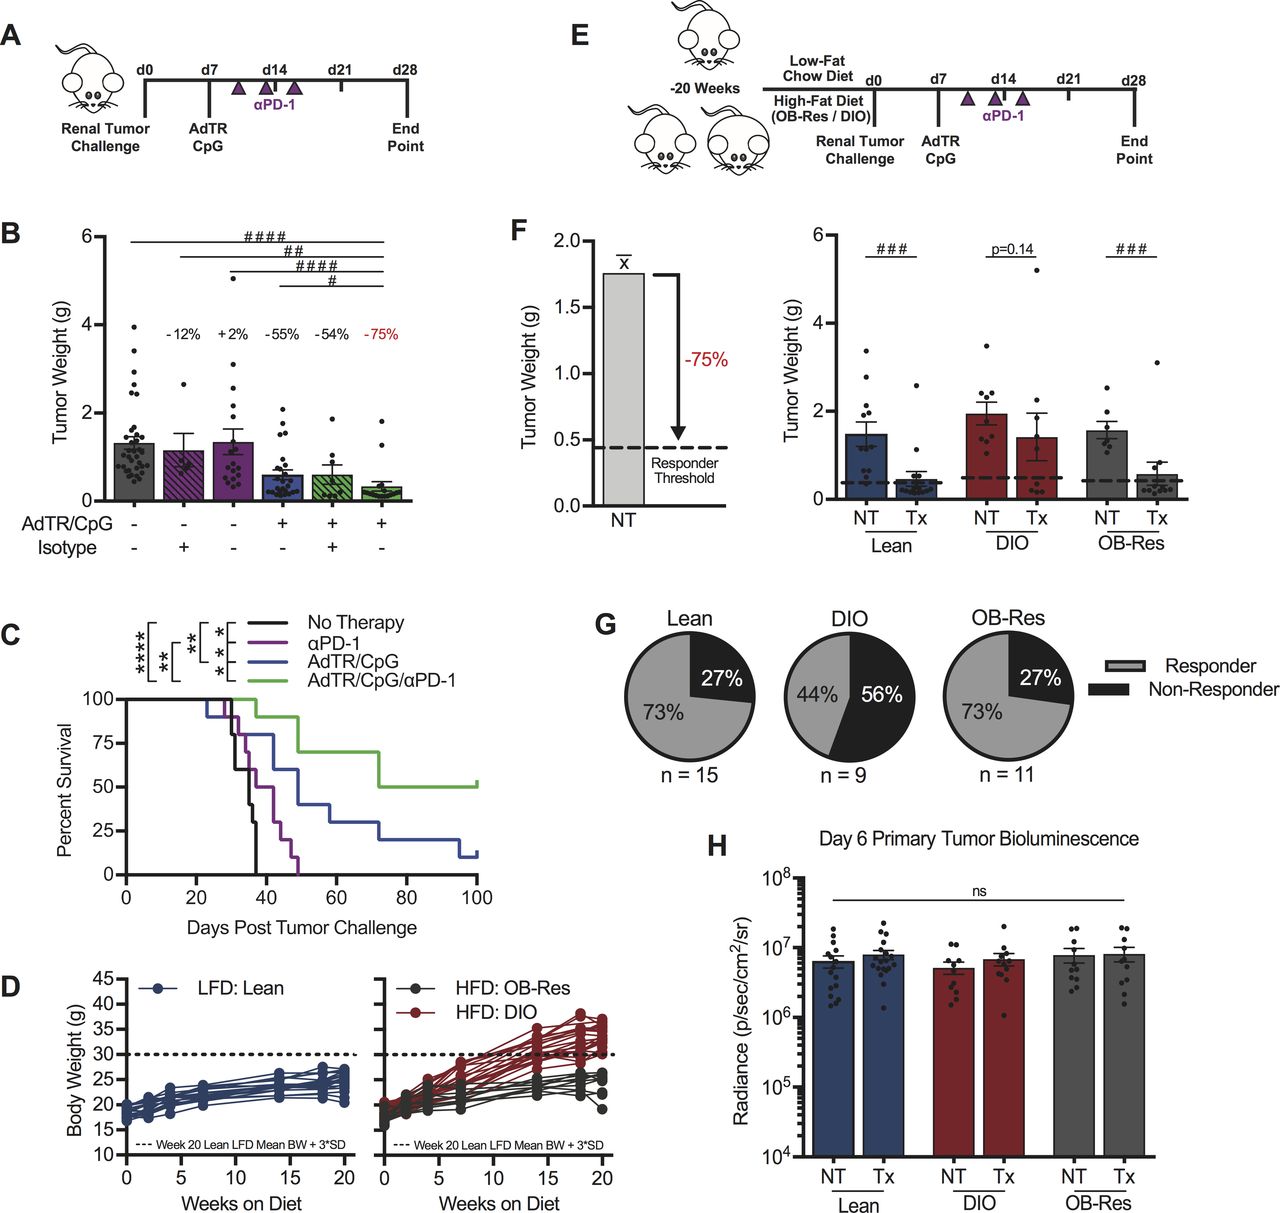
Obesity reduces the efficacy of a novel AdTR/CpG/PD-1 combinatorial immunotherapy in pre-clinical renal cancer. (A) Experimental design for panels (B, C). (B) Day 28 renal tumor weights for lean animals, treated as indicated. Percentage indicates change in tumor burden relative to untreated controls. (C) Percent survival. (D) Change in body weights of LFD and HFD-fed animals. (E) Experimental design for panels (F, G). (F) Responder threshold (dashed line) was calculated as a >75% reduction in therapy-treated tumor burden compared with untreated controls as determined in (B). Day 28 renal tumor weights for lean, DIO and obese resistant (OB-Res) animals. (G) Response rates for lean, DIO and OB-Res therapy-treated animals from (F). (H) Day 6 tumor burden prior to therapy administration as determined by bioluminescence. Data are pooled from (C) a single experiment (n=10/group) or (B, D, F–H) two or more independent experiments and presented as means±SEM, survival or individual animals shown. Statistical differences were calculated using (B) non-parametric Kruskal-Wallis test with uncorrected Dunn’s multiple comparisons test (#p<0.05, ##p<0.01, #### p<0.0001), (C) log-rank (Mantel-Cox) test (*p<0.05, **p<0.01, ***p<0.001, ****p<0.0001), (F) non-parametric Mann-Whitney U tests (###p<0.001) or (H) two-way ANOVA with Bonferroni’s multiple comparisons tests as appropriate. ANOVA, analysis of variance; DIO, diet-induced obese; HFD, high-fat diet; LFD, low-fat chow diet; ns, not significant; NT, no therapy; PD-1, programmed cell death-1; Tx, AdTR/CpG/PD-1 therapy.
We therefore used this AdTR/CpG/PD-1 approach to evaluate the impact of obesity on therapeutic efficacy in age-matched mice. Lean and DIO mice (figure 4D) were established, challenged with orthotopic renal tumors, then treated with AdTR/CpG/PD-1 (figure 4E). Because AdTR/CpG/PD-1 reduced excised tumor weights by an average of 75% in young, lean mice relative to untreated controls (figure 4B), we classified individual AdTR/CpG/PD-1-treated mice as responders if they exhibited a ≥75% reduction in excised tumor weight, relative to the mean tumor weight of their respective untreated controls (figure 4F). These objectively determined responder thresholds are indicated by dotted lines in figure 4F. Lean mice maintained on LFD for 20 weeks displayed significant reductions in tumor weights after receiving AdTR/CpG/PD-1 immunotherapy (figure 4F), translating to a response rate of 73% (figure 4G). In contrast, immunotherapy did not significantly alter tumor weights in DIO mice (figure 4F) and a response rate of only 44% was achieved (figure 4G), demonstrating impaired immunotherapeutic outcomes in DIO mice. Next, we evaluated changes in excised renal tumor weights over time, and found that at day 15 post-tumor challenge, tumor weights were not significantly different among lean and DIO mice, in the absence or presence of AdTR/CpG/PD-1 therapy (online supplemental figure S4). However, by day 28, lean mice receiving AdTR/CpG/PD-1 exhibited a significant reduction in renal tumor burdens relative to lean and DIO NT controls and DIO mice receiving AdTR/CpG/PD-1(online supplemental figure S4). In DIO mice, no significant reductions in tumor burdens were observed following therapy administration (online supplemental figure S4). These outcomes reflect our clinical observations in RCC patients treated with anti-PD-1 (figure 1), further highlighting the clinical relevance of our preclinical renal tumor model.
As lean and DIO mice are fed different diets, we investigated the possibility that HFD administration, rather than obesity, was impairing therapeutic efficacy in DIO mice. To do this, we used our previously characterized OB-Res BALB/c mice.20 OB-Res mice are DIO cage-mates maintained on the same HFD for 20 weeks, but they demonstrate no weight gain relative to LFD-fed controls (figure 4D). More importantly, we have reported that OB-Res mice are physiologically comparable (ie, adiposity, serum leptin and insulin) to lean LFD-fed mice.20 AdTR/CpG/PD-1 efficacy was maintained in OB-Res mice (figure 4F), resulting in a response rate of 73% (figure 4G), equivalent to that observed in lean mice. Therefore, the loss of therapeutic efficacy in DIO mice was linked to obesity, rather than HFD use.
We then examined potential underlying factors that could contribute to decreased tumor clearance and response rates in DIO mice. These included: tumor burdens at treatment initiation (figure 4H), body weights of individual DIO mice at tumor challenge, the frequency of PD-L1+ CD45+ or CD45- cells within renal tumors, and day 28 excised renal tumor weights in untreated mice (online supplemental figure S3B–E). No significant changes in any of the above parameters were found. We also interrogated intratumoral T cell receptor (TCR) diversity via deep sequencing at day 28 in untreated lean and DIO mice, as it was previously reported that obesity compromises TCR repertoire diversity.39 However, whole tumor αβ T cell repertoire sequencing revealed no significant differences in magnitude or diversity between DIO and lean mice (online supplemental figure S3F). Finally, as these studies were conducted using female mice, we asked if our observations extended to male mice. We determined that the reduced response rate to immunotherapy also occurred in male DIO mice, as only 17% of DIO males but 78% of lean males responded to AdTR/CpG/PD-1 (online supplemental figure S3G), demonstrating that loss of immunotherapeutic efficacy in DIO mice was consistent in both males and females. Therefore, none of the above factors appeared to contribute to differential AdTR/CpG/PD-1 response rates in DIO versus lean mice.
Lean and OB AdTR/CpG/PD-1 responders display similar intratumoral gene expression profiles that are distinct from those of non-responders (NR)
To identify potential mediators of obesity-associated immune dysfunction within tumors, we evaluated gene expression profiles (GEPs) from whole renal tumors in untreated lean and DIO mice. We performed nanoString Immune profiling of 750 immune-related genes in tumor-free or tumor-bearing kidneys from treatment-naive DIO versus lean mice. GEPs were remarkably conserved between lean and DIO treatment-naive tumors and tumor-free contralateral kidneys (online supplemental figure S5A,B), illustrating that underlying immune responses were minimally impacted by obesity.
Next, we asked if obesity altered immune-related GEPs following AdTR/CpG/PD-1 therapy. We therefore used nanoString immune profiling as a screening tool to identify broad immunogenetic changes in whole renal tumors from individual lean and DIO untreated mice, as well as treatment responders and NR. Here, unbiased two-way hierarchical analysis revealed that all lean and DIO treatment responders clustered together (figure 5A) and were characterized by a conserved group of highly expressed genes (denoted by the yellow dendrogram). Strikingly, DIO NR clustered with lean and DIO no therapy (NT) mice, demonstrating their lack of robust immune remodeling in response to therapy administration. Lean NRs were characterized by a conserved group of highly expressed genes (denoted by the green dendrogram).
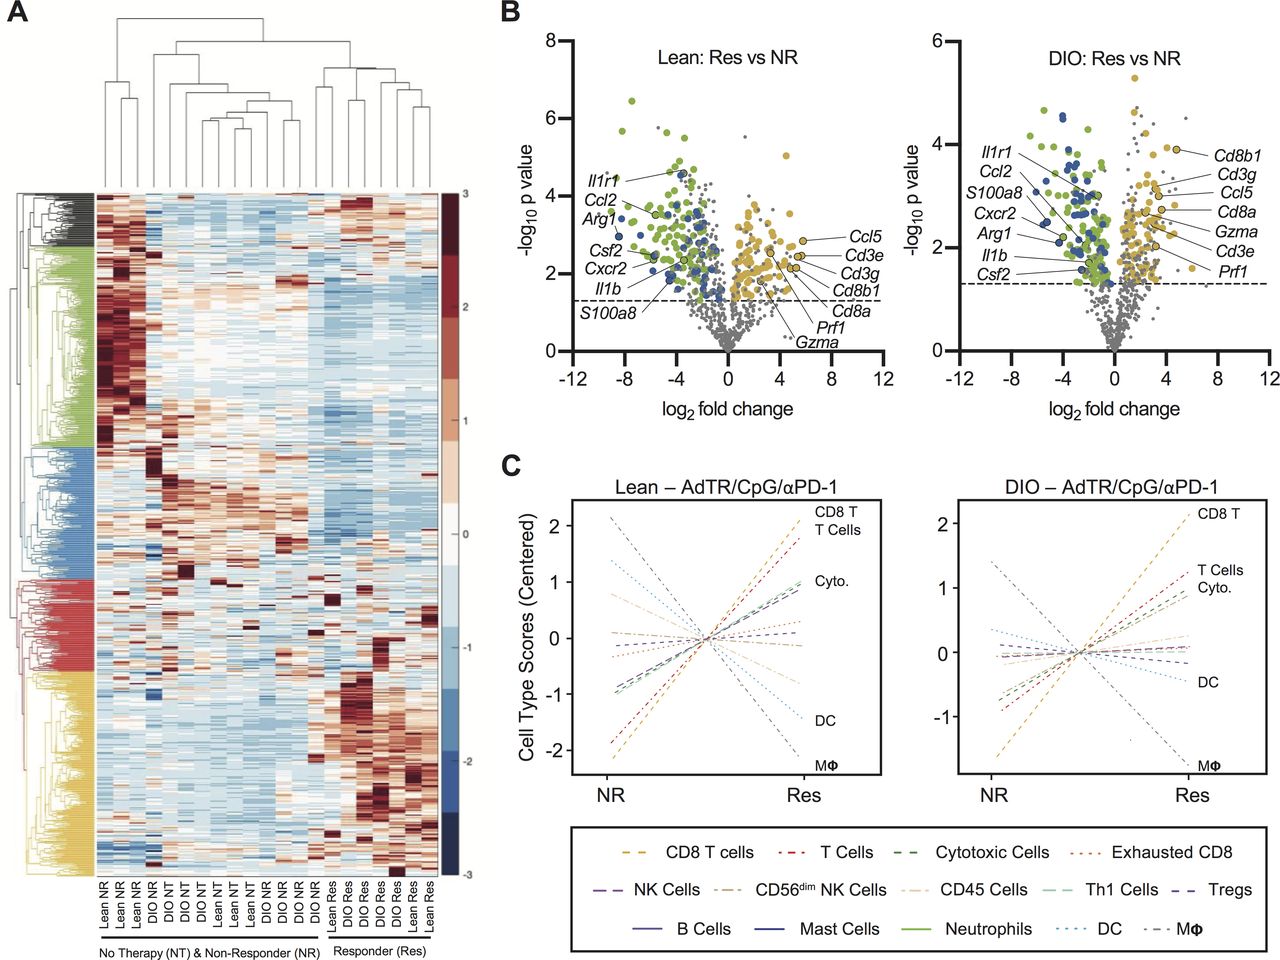
Lean and DIO AdTR/CpG/PD-1 responders share a conserved tumoral gene expression profile that is distinct from those of non-responders and treatment-naive mice. (A) Heatmap depicting unbiased hierarchical clustering and gene expression patterns for 750 immune-related genes in the tumors of therapy-naive and therapy-treated lean and DIO animals. (B) Volcano plots showing expression of 750 genes in (left) lean and (right) DIO responders versus respective non-responders. Dashed line indicates an exploratory unadjusted p value threshold (p=0.05) to screen differentially expressed (DE) target genes. Dot colors correspond to genes from green, blue and yellow hierarchical clusters in (A) that were also significantly (p<0.05) DE in both lean and DIO responders versus non-responders. (C) NanoString-generated cell type scores comparing relative gene expression-based population abundance in responding and non-responding lean and DIO therapy-treated animals. DC, dendritic cell; DE, differentially expressed; DIO, diet-induced obese; no therapy, NT; non-responder, NR; PD-1, programmed cell death-1; Res, responder.
To more fully understand GEPs that characterized a productive response to therapy, we used volcano plots to identify genes that were differentially expressed (DE; p<0.05 significance threshold indicated by dotted line) in lean or DIO responders versus their respective NR group (figure 5B). We identified several gene expression changes conserved in both lean and DIO responders. Of the shared responder genes (online supplemental table S4), many of those upregulated were indicative of CD8+ T cell immunity (ie, CD3e, CD3g, Cd8a, Cd8b, Ccl5, Gzma, Prf1). Conserved downregulated genes included those related to myeloid-lineage population dynamics (ie, Csf2, Ccl2, S100a8, Cxcr2, Il1r1, Il1b and Arg1). These patterns were reinforced through our analysis of nanoString cell type scores, which showed that tumors from lean and DIO responders had increased CD8+ T cell (‘CD8 T’) and cytotoxic cell scores (‘Cyto’, comprizing both T cells and NK cells) relative to NR. Responders also had simultaneous reductions in dendritic cell (DC) and macrophage (“MΦ”) scores (figure 5C). As the majority of DC in Renca tumors from DIO mice are myeloid lineage cells with potent suppressor functions,8 our GEP analyses suggested that productive immune responses to AdTR/CpG/PD-1 were characterized by strong CD8+ T cell responses with concomitant reductions in myeloid cell responses.
Increased prevalence of effector PD-1intCD8+ TILs and concurrent ablation of myeloid-derived suppressor cells underlies successful therapeutic outcomes in both lean and DIO mice
We next sought to validate and expand on the identified immunogenetic changes (figure 5) via flow cytometric cellular profiling of day 28 tumors from lean and DIO therapy-naive and therapy-treated mice. The percentages of activated (CD44+) CD8+ TILs were robustly and significantly increased in both lean and DIO AdTR/CpG/PD-1 responders relative to respective untreated controls (figure 6A), confirming our nanoString data. In contrast, lean and DIO NR exhibited a weak intratumoral CD44+CD8+ T cell presence. Furthermore, in lean and DIO responders to AdTR/CpG/PD-1 therapy, activated CD8+ TILs had low PD-1 expression (figure 6B), likely due to effective tumor clearance limiting repeated TCR engagement.26 30 31 We also observed significant increases in the frequencies of IFNγ+CD8+ TILs in lean and DIO responders, relative to their respective untreated controls and NR (figure 6C). We determined that reduced PD-1 expression in responders was driven by a relative shift toward PD-1intCD8+ TILs in both lean and DIO mice (figure 6D). In both lean and DIO responders, IFNγ, TNFα and perforin were produced primarily by PD-1intCD8+ TILs (figure 6E). Next, as CD4+ TILs are known to modulate the quality and magnitude of CD8+ TIL responses,40 we examined the CD4+ T cell response. Activated CD4+ TILs (online supplemental figure S6A) were elevated in both lean and DIO therapy responders (online supplemental figure S6B). However, CD4+Foxp3+ Treg percentages were unchanged by obesity or response to therapy (online supplemental figure S6B). These results indicate that immunotherapy administration in lean and DIO responders initiated a robust expansion of intratumoral PD-1intCD8+ T cells that produced IFNγ, TNFα and perforin.

Successful response to immunotherapy in both lean and DIO mice is associated with a predominance of effector PD-1intCD8+ TILs and reduced MDSCs. Analysis of day 28 intratumoral leukocytes from indicated treatment groups. (A) Frequencies of activated CD8+ TILs, (B) PD-1 expression on activated CD8+ TILs, (C) frequencies of IFNγ+ CD8+ TILs, (D) activated CD8+ TILs based on PD-1 expression level, (E) cytokine producing CD8+ TILs based on PD-1 expression level and (F) MDSCs. (G) Ratio of activated CD8+ TILs to MDSCs. Data are pooled from at least two independent experiments and presented as means±SEM. Statistical differences were determined by two-way ANOVA followed by post hoc Bonferroni’s multiple comparisons tests (*p<0.05, **p<0.01, ***p<0.001, ****p<0.0001). ANOVA, analysis of variance; DIO, diet-induced obese; IFNγ, interferon-γ; MDSCs, myeloid-derived suppressor cells; NR, non-responder; NT, no therapy; PD-1, programmed cell death-1; Res, responder; TILs, tumor-infiltrating lymphocyte.
We previously reported that in this orthotopic Renca model, obesity is associated with heightened intratumoral immune suppression via myeloid-lineage DC and myeloid-derived suppressor cell (MDSC) which actively suppress CD8+ T cell proliferation when sort-purified and functionally evaluated ex vivo.6 8 Here, DIO therapy responders exhibited significant reductions in tumor-infiltrating CD11b+CD11chighMHC II+ DC (online supplemental figure S7A), relative to NR (online supplemental figure S7C). DC subtype analysis (online supplemental figure S7B) showed no alterations toward or away from conventional DC1 (XCR1+Sirpα) or DC2 (XCR1-Sirpα+) subsets with obesity or response to treatment (online supplemental figure S5D,E). Total intratumoral MDSCs (CD45+/CD11b+/CD11c-/MHC II-/Ly6G+ or Ly6C+) (gating strategy as per online supplemental figure S7A) were also significantly reduced in DIO and lean responders to AdTR/CpG/PD-1 therapy, relative to respective NR and untreated controls (figure 6F). MDSC subtype analysis showed a predominance of polymorphonuclear ‘PMN-MDSCs’ over monocytic ‘M-MDSCs’ (online supplemental figure S7F–G), although both subtypes are suppressive in this model.6 Notably, the ratio of CD44+CD8+ TILs to MDSCs was significantly and favorably increased in DIO and lean responders (figure 6G), confirming our nanoString data (figure 5). Thus, our cellular analyses illustrated that AdTR/CpG/PD-1 success in both lean and OB mice was defined by immune responses that culminate in similar, favorable ratios of activated CD8+ T cells to MDSCs within tumors. Therefore, obesity reduced the percentage of mice that respond favorably to this immunotherapy, without altering the quality of immune responses in DIO versus lean treatment responders.
Obesity-associated alterations in intratumoral chemokine signatures contribute to diminished therapeutic outcomes
Next, we sought to identify factors responsible for the differential response rates to therapy in DIO versus lean mice. We examined intratumoral immune responses at an early day 15 time point in treatment-naive mice, with the goal of identifying obesity-associated drivers of the divergent therapy outcomes we had identified (figure 4F,G). At this time, DIO mice displayed a trending but non-significant reduction in the frequency of activated CD44+CD8+ TILs versus lean mice (figure 7A), suggesting that baseline T cell priming and trafficking were predominantly intact in DIO hosts.
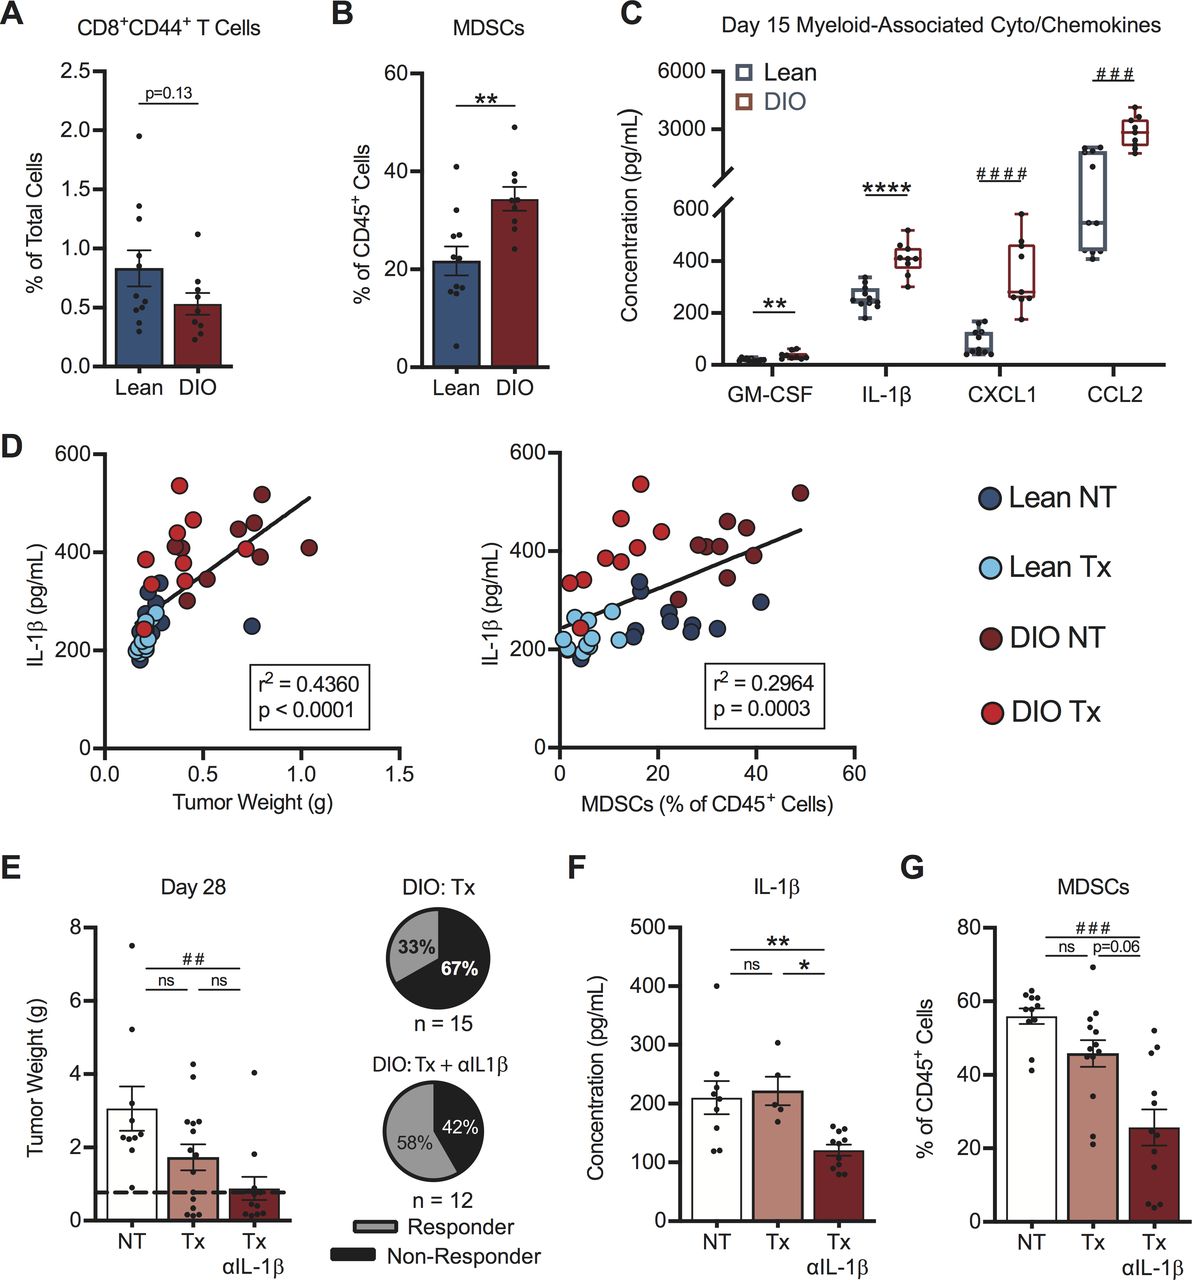
Early intratumoral chemokine alterations in obese mice drive differential therapy response rates. On day 15, post-tumor challenge lean and DIO treatment-naive mice were evaluated for (A) activated CD8+ TILs, (B) MDSCs and (C) myeloid-associated cyto/chemokines within tumors. Linear regression of intratumoral (D) IL-1β concentrations versus (left) tumor weight and (right) MDSCs in lean and DIO therapy-naive and therapy-treated animals. DIO animals were treated with no therapy or AdTR/CpG/PD-1±anti-IL-1β neutralizing antibody. Day 28 endpoint (E) tumor weights, corresponding response rates, intratumoral (F) IL-1β concentrations and (G) MDSCs. Data are pooled from at least two independent experiments and presented as means±SEM or boxes defining 25th to 75th percentiles with line at median and whiskers extending to minimum and maximum points. Statistical differences were calculated using parametric t-tests (*p<0.05, **p<0.01, ****p<0.0001), non-parametric Mann-Whitney U tests (##p<0.01, ###p<0.001, ####p<0.0001), or linear regression analyses as appropriate. DIO, diet-induced obese; IL-1β, interleukin-1β; MDSCs, myeloid-derived suppressor cells; ns, not significant; NT, no therapy; PD-1, programmed cell death-1; Tx, AdTR/CpG/PD-1 therapy.
To more directly evaluate the effects of obesity on CD8+ T cell priming in tumor-bearing mice, we used a complementary CMS5 fibrosarcoma tumor model that permits tracking of tumor antigen-specific T cell responses to an endogenous tumor antigen.22 23 Equal numbers of naive, tumor antigen-specific, TCR transgenic DUC18 CD8+ TILs from lean mice were CFSE-labeled and transferred into lean or DIO recipients with early established tumors. Comparable percentages of activated (CD25+) proliferative DUC18 T cells were present in tumor-draining inguinal lymph nodes from lean and DIO mice at day 4 post-T cell transfer (online supplemental figure S8A), illustrating that T cell priming was not impaired by host obesity in this model. However, analysis of endpoint CMS5 tumor areas showed tumor regression (ie, no palpable tumor detected) in 75% of lean recipients, as expected,22 23 but only 33% of DIO recipients (online supplemental figure S8B). Therefore, despite intact T cell priming, transferred DUC18 T cells were less able to control CMS5 tumors outgrowth in obese animals, reflecting our findings in mice with renal tumors.
Having found no obvious defects in T cell priming in DIO mice, we examined MDSCs within renal tumors. At day 15 post-tumor challenge, DIO mice had significantly increased frequencies of tumor-infiltrating MDSCs in the absence of therapy (figure 7B). We therefore examined known soluble mediators of MDSC responses. Treatment-naive DIO mice had increased intratumoral concentrations of the MDSC-related proteins GM-CSF, IL-1β, CXCL1 and CCL26 41–43 at day 15, relative to lean mice (figure 7C). IL-1β is a known driver of MDSC generation, accumulation and suppressive capacity,44 45 and was decreased at the gene expression level in both lean and DIO responder mice (figure 5B). Investigating the IL-1β pathway is clinically relevant, as high intratumoral IL-1β gene expression is an unfavorable prognostic in renal cancer patients (p<0.001, thehumanproteinatlas.org) and elevated IL-1β in human renal tumors is associated with increased MDSC accumulation.43
In our renal cancer model, intratumoral IL-1β concentrations correlated positively with both tumor size and tumor-infiltrating MDSC abundance across all categories of lean and DIO treatment-naive and therapy-treated animals (figure 7D). We therefore asked if neutralization of IL-1β in AdTR/CpG/PD-1 treated DIO mice would improve treatment response rates. Indeed, administration of anti-IL-1β in DIO mice receiving AdTR/CpG/PD-1 led to a significant reduction in tumor weights vs NT controls, and improved the mean response rate to 58% vs 33% in DIO AdTR/CpG/PD-1-treated mice with intact IL-1ß (figure 7E). Administration of anti-IL-1β in DIO mice receiving AdTR/CpG/PD-1 reduced intratumoral concentrations of IL-1ß (figure 7F) and also lowered concentrations of other myeloid-related proteins within tumors, including GM-CSF, CXCL1 and CCL2 (online supplemental figure S9A–C). Use of anti-IL-1β did not alter intratumoral concentrations of IL-2, IL-4, or CCL20 (online supplemental figure S9D–F), illustrating the specificity of this approach. Importantly, neutralizing IL-1β did reduce the frequencies of total MDSCs within renal tumors (figure 7G). Thus, reduced AdTR/CPG/PD-1 response rates in DIO mice were mediated in part by early, heightened elevations in intratumoral IL-1β concentration and MDSCs, changes that negated the largely intact CD8+ T cell response present in OB hosts.
Finally, we asked if the mean response rate in lean mice could be impaired by neutralizing a chemoattractant mediator of effector T cell trafficking into tumors. In concordance with our finding that host obesity did not significantly alter day 15 CD44+CD8+ TIL accumulation, we observed no differences in the intratumoral concentrations of T cell-related chemokines (CCL4, CCL5, CXCL10 and CXCL11) in DIO versus lean animals (online supplemental figure S10A). However, CCL5 was recently identified as a key regulator of CD8+ TIL trafficking in human renal tumors,41 and we found that elevated CCL5 was associated with reduced tumor weights and increased CD44+CD8+ T cell infiltration into renal tumors of mice (online supplemental figure S10B). Neutralizing CCL5 in lean mice receiving AdTR/CpG/PD-1 therapy reduced the mean response rate from 86% (in mice with intact CCL5) to 46% (online supplemental figure S10C) and administration of isotype had no effect (online supplemental figure S10D). Collectively, our results implicate IL-1β and CCL5 as important regulators of AdTR/CPG/PD-1 outcomes in lean and DIO mice with renal tumors.
Discussion
Here, we report that that obesity, as defined by the WHO’s BMI cut point of ≥30 kg/m2, is associated with worse OS and PFS in metastatic RCC patients who received standard of care anti-PD-1, as evidenced by clinical outcome data from two independent institutions. These clinical trends are reflected in the reduced response rates we observed in DIO mice-bearing established renal tumors, wherein an anti-PD-1-based combinatorial immunotherapy had reduced efficacy. We demonstrate that this outcome arises in part from early, obesity-associated elevations in intratumoral IL-1β concentration and MDSCs. Neutralization of IL-1β was sufficient to restore immunotherapy response rates in DIO mice to the level seen in lean animals. These immunotherapy outcomes are consistent with our flow cytometric data regarding the PD-1 status of CD8+ TILs from both human and murine renal tumors, which illustrate that obesity is associated with reduced frequencies of activated PD-1highCD8+ TILs. Our data also concur with an earlier report by Thommen et al that linked elevated frequencies of PD-1highCD8+ TILs with improved responses to anti-PD-1 in a cohort of non-small cell lung carcinoma patients.26 In RCC, we find fewer PD-1highCD8+ TILs and worse responses to anti-PD-1 with obesity. Thus, our human and murine findings present a cohesive view regarding the detrimental effects of host obesity on anti-PD-1-based treatment outcomes, a provocative scenario given the current focus on obesity paradox paradigms in cancer immunotherapy.
Our findings are consistent with multiple preclinical studies that show obesity alters the tumor microenvironment and/or immune response to facilitate tumor progression and dissemination. For example, we had reported previously that obesity was associated with increased frequencies of tumor-infiltrating DC that suppressed CD8+ T cells ex vivo, corresponding with reduced efficacy of AdTR/CpG.8 Additional obesity-associated mechanisms include: myeloid cell promotion of metastasis via IL-5 and GM-CSF,10 altered MDSC responses that impede CD8+ T cell immunity,6 46 decreased NK function,47 and increased production of pro-inflammatory cytokines from myeloid cells and adipocytes that promote tumor cell proliferation and immunosuppression.7 Additional studies showed that obesity triggers adverse changes in the T cell compartment, ranging from reduced T cell thymic progenitors39 to impaired metabolism and effector function in CD8+ TILs.48 More recently, we demonstrated that DIO mice with mammary carcinoma display immunotherapy resistance, due in part to CXCL1-driven accumulation of FasL+ MDSCs inducing apoptosis in effector CD8+ TILs.49 Our current study extends this body of literature by providing novel insight regarding the role for obesity-associated intratumoral IL-1β in the development of a tumor microenvironment that is more resistant to anti-PD-1-based immunotherapy (figure 7 and online supplemental figure S9).
Despite the numerous pre-clinical findings illustrating the negative effects of obesity on antitumor immunity, several retrospective clinical outcome studies report obesity paradox paradigms in patients with melanoma and other mixed tumor types. These studies indicated that obesity (BMI ≥30 kg/m2) is associated with improved outcomes following immune checkpoint blockade with anti-PD-1 or anti-PD-L1 in the presence or absence of anti-CTLA-4, administered either during clinical trials or as standard of care.11 12 15 However, published reports examining the effects of obesity on immune checkpoint inhibitor outcomes in RCC, specifically, are less supportive of this obesity paradox paradigm. For example, a recent meta-analysis reported beneficial effects of combined overweight plus obesity (BMI ≥25 kg/m2), in terms of immune checkpoint blockade outcomes, across a variety of tumor types.17 Three independent RCC studies were included in this meta-analysis, but none examined immune checkpoint blockade outcomes using the WHO-defined cut-off of BMI ≥30 kg/m2 to determine the specific effects of obesity on clinical outcomes, as we did here. One of these studies, by Bergerot et al, found that elevated BMI was beneficial when RCC patients received targeted therapies such as VEGF or mTOR inhibitors, but found a detrimental trend when immune checkpoint inhibitors were used at the same institution.18 A 2019 report by Sanchez et al examined retrospective outcomes from an observational cohort of RCC patients (n=203) treated at Memorial Sloan Kettering between 2011 and 2018 with immune checkpoint inhibitors (monotherapy or any combination of anti-PD-1/PD-L1/CTLA-4).16 In this cohort, obesity was not associated with increased mortality after adjusting for IMDC risk score. This is in contrast to the authors reported results from the COMPARZ clinical trial of pazopanib vs sunitinib, wherein obesity was associated with improved OS.16 These results raise the possibility that obesity may differentially impact immune checkpoint inhibitor versus targeted therapy outcomes in RCC. Our analysis examined outcomes only in RCC patients receiving anti-PD-1 monotherapy as standard of care and thus provides an insight that is distinct from that of prior studies, which performed analyses across multiple tumor types, immunotherapeutic agents, and/or a combination of clinical trial and standard of care administration.11 12 14–16 Therefore, perhaps due to the these dissimilar nature of the analyses performed to date, no clear consensus regarding the effects of obesity on immune checkpoint inhibitor outcomes in RCC has yet emerged.
Our finding that treatment-naive RCC subjects with obesity and DIO mice had reduced percentages of PD-1highCD8+ TILs is intriguing, particularly because this TIL subset maintained potent effector function in untreated mice (figure 3). Given our findings that obesity promotes early MDSC accumulation in mice, we postulate a scenario in which obesity promotes increased IL-1β within tumors, thereby increasing the frequency of tumor-infiltrating MDSCs, resulting in an impaired ability of CD8+ TILs to engage with cognate antigen and respond by increasing PD-1 expression. In support of this model, we found that neutralizing IL-1β restored immunotherapeutic efficacy in DIO animals (figure 7E). This reflects findings from other groups, wherein blocking IL-1β reduced tumor growth in the presence and absence of obesity,9 50 51 and improved response to anti-PD-1 immunotherapy in lean mice with mammary carcinoma.45 Furthermore, we observed that PD-1 expression on CD8+ TILs increased over time in untreated lean, but not DIO, mice (figure 2G). Other groups have found that high proportions of PD-1highCD8+ TILs prior to therapy predicted improved anti-PD-1 responses in patients with lung cancer,26 and elevated frequencies of PD-1+CD8+ T cells in the pretreatment setting correlated with response to anti-PD-1 in murine melanoma.11 Thus, the frequency of PD-1+CD8+ TILs and expression levels of PD-1 on those cells should be examined more closely for potential associations with PD-1 outcomes in cancer patients, particularly in the context of obesity where heightened inflammation and MDSC accumulation occur.
Naturally, our study contains limitations. For example, our pre-clinical model of kidney cancer does not permit the examination of tumor antigen-specific T cell responses and is syngeneic to BALB/c mice, which develop obesity without insulin resistance.20 This is notable as type 2 diabetes may well influence immunotherapy outcomes in clinical practice. Despite this limitation, our orthotopic Renca model resembles human RCC in terms of the immune responses to these renal tumors: the total frequency of activated CD8+ TILs is unchanged with obesity whereas the frequencies of PD-1highCD8+ TILs are reduced with obesity (figure 2), and in the significant but modest improvement in animal survival following anti-PD-1 monotherapy (figure 4). Our study also investigated immune-mediated mechanisms contributing to impaired AdTR/CpG/PD-1 response with obesity, specifically focusing on obesity-associated IL-1β. However, obesity-associated inflammation is propagated through multiple adipokines and proinflammatory cytokines51 that we did not fully examine. Because obesity is a multifactorial disease, it is likely that multiple mechanisms will synergize to dictate immunotherapy success or failure in cancer patients. Additional in-depth transcriptomic studies such as those recently reported by Sanchez et al,16 as well as detailed cellular analyses, will permit a deeper understanding of when and why obesity is associated with positive or negative outcomes in cancer patients receiving immunotherapy. Additionally, we do not know if therapy-induced survival is also negatively impacted in our DIO mice. However, based on our prior results examining survival in DIO mice that received only AdTR/CpG,8 we fully expect that DIO mice would show significant reductions in survival in response to AdTR/CpG/PD-1, relative to age-matched lean counterparts. Given the retrospective nature of our survival outcomes data in RCC patients, we were unable to clinically validate our observations in mice regarding the roles of IL-1β and CCL5 in immunotherapy outcomes; therefore, future studies should examine the abundance and function of these proteins in immunotherapy-treated RCC patients with and without obesity. Finally, although our survival outcomes analysis features RCC patients from two separate institutions, our cohort is small and it will be essential to perform similar studies with larger cohorts at other institutions, so that separate analyses for underweight, normal weight, overweight and OB patients can be conducted.
Conclusions
Obesity is a health concern that is reaching epidemic proportions globally, and its increasing prevalence shows no sign of slowing. Our study provides important insights into the effects of obesity on anti-PD-1-based treatment outcomes: in mice receiving a combinatorial AdTR/CpG/PD-1 therapy, as well as in RCC patients receiving anti-PD-1 monotherapy as standard of care, obesity was associated with poorer treatment outcomes. These unified results add a critical element to our current understanding of the ways in which obesity impacts anti-tumor immunity and immune checkpoint blockade outcomes. However, given the uncertainty in the field, rigorous continued study of this critical issue is needed to better inform patient care.
Acknowledgments
The authors would like to thank the following UAB cores and facilities: nanoString facility, and particularly Debbie Della Mana, the O’Neal Comprehensive Cancer Center’s Preclinical Imaging Shared Facility, the Heflin Center for Genomic Science Genomics Core, and the Animal Resources Program. We also thank the Genitourinary Molecular Epidemiology Research resource at UI’s Holden Comprehensive Cancer Center, and the Rock-N-Ride charity of Iowa. The authors would also like to thank the laboratory of Dr. Francis Lund for use of the MAGPIX Luminex plate reader.
References
Supplementary materials
Supplementary Data
This web only file has been produced by the BMJ Publishing Group from an electronic file supplied by the author(s) and has not been edited for content.
Footnotes
SKB, RMO and JTG contributed equally.
Contributors LAN and SKB conceived the study. LAN, SKB, RMO, JTG and WJT designed experiments. LAN, SKB, RMO, JTG, WJT, GW, LT, CBR, DML and KIF performed experiments and analyzed data. KEN and TTM-L analyzed data. MB, LB and LT helped consent RCC patients into the prospective study and process biospecimens. JG, KN and JAB helped acquire renal tumor specimens. LAN and EY helped obtain i2B2 and outcome data for UAB RCC patients. HY, RG, and YZ performed chart reviews and acquired outcome data for UI RCC patients. PL performed statistical analyses of human subject data and provided statistical guidance on murine data analysis and interpretation. AM, BPG, RES, GJW, AKS, DML, RCA, JAB, EY, YZ, and KN provided scientific guidance. LAN, SKB, RMO, JTG, WJT, GW, AM, BPG, DML, TTM-L and AKS revised and edited the manuscript. All authors provided critical review and final approval of the manuscript. Authorship order among co-first authors was assigned accordingly: SKB designed, conducted and analyzed initial experiments; RMO and JTG designed, conducted and analyzed follow-up experiments. LAN and RMO wrote the manuscript and JTG created/compiled figures for publication.
Funding Research reported in this publication was supported by NIH Grant #5R01CA181088 to LAN, NIAID award #T32AI007051 and NCI award #R25CA047888 to SKB, NHLBI award #T32HL105349 and NCI award #T32CA047888 to RMO, NIGMS award #T32GM008111 to JTG, NIDDK award #T32DK062710 and NCI award #T32CA183926 to WJT, NIDDK award #P30DK056336 (to UAB Nutrition and Obesity Research Center), and NIH awards #P30CA013148 and #1S10OD021697 (to UAB O’Neal Comprehensive Cancer Center Preclinical Imaging Shared Facility). TTM-L was supported by her startup package through the UAB School of Medicine.
Disclaimer The content is solely the responsibility of the authors and does not necessarily represent the official views of the NIH.
Competing interests CBR is currently employed by Immunomic Therapeutics. RCA serves as an advisory board member for Clovis, Tesaro and LEAP therapeutics. EY receives research funding from Eli Lilly and serves as an advisory board member for Bayer and AstraZeneca.
Patient consent for publication Not required.
Ethics approval Approval for our prospective human subjects study was granted by the IRB of The University of Iowa (UI). IRB approval for our retrospective study of metastatic RCC patients treated with anti-PD-1 was obtained from The University of Iowa and University of Alabama at Birmingham (UAB) Hospitals.
Provenance and peer review Not commissioned; externally peer reviewed.
Data availability statement Data are available on reasonable request. All data relevant to the study are included in the article or uploaded as online supplemental information. Gene expression data from this study are available from the corresponding author on reasonable request.
Supplemental material This content has been supplied by the author(s). It has not been vetted by BMJ Publishing Group Limited (BMJ) and may not have been peer-reviewed. Any opinions or recommendations discussed are solely those of the author(s) and are not endorsed by BMJ. BMJ disclaims all liability and responsibility arising from any reliance placed on the content. Where the content includes any translated material, BMJ does not warrant the accuracy and reliability of the translations (including but not limited to local regulations, clinical guidelines, terminology, drug names and drug dosages), and is not responsible for any error and/or omissions arising from translation and adaptation or otherwise.