Article Text

Abstract
Background We previously showed selectively hampered activation of lymph node-resident (LNR) dendritic cell (DC) subsets in the breast cancer (BrC) sentinel lymph node (SLN) to precede a state of profound T cell anergy. Reactivating these DC subsets by intratumoral delivery of the Toll-like receptor-9 (TLR9) agonist CpG-B could potentially offer a promising immune therapeutic strategy to combat this immune suppression and prevent disease spread. Unfortunately, CpG-B can limit its own immune stimulatory activity through direct TLR9-mediated activation of signal transducer and activator of transcription 3 (STAT3), pinpointed as a key regulator of immune suppression in the tumor microenvironment. Here, we have investigated whether in vitro exposure to CpG-B, with or without simultaneous inhibition of STAT3 signaling, could overcome immune suppression in BrC SLN.
Methods Immune modulatory effects of CpG-B (CPG7909) with or without the JAK2/STAT3 inhibitor (STAT3i) AG490 were assessed in ex vivo cultured BrC SLN-derived single-cell suspensions (N=29). Multiparameter flow cytometric analyses were conducted for DC and T cell subset characterization and assessment of (intracellular) cytokine profiles. T cell reactivity against the BrC-associated antigen Mammaglobin-A was determined by means of interferon-γ ELISPOT assay.
Results Although CpG-B alone induced activation of all DC subsets, combined inhibition of the JAK2/STAT3 pathway resulted in superior DC maturation (ie, increased CD83 expression), with most profound activation and maturation of LNR DC subsets. Furthermore, combined CpG-B and JAK2/STAT3 inhibition promoted Th1 skewing by counterbalancing the CpG-induced Th2/regulatory T cell response and significantly enhanced Mammaglobin-A specific T cell reactivity.
Conclusion Ex vivo immune modulation of the SLN by CpG-B and simultaneous JAK2/STAT3 inhibition can effectively overcome BrC-induced immune suppression by preferential activation of LNR DC, ultimately restoring type 1-mediated antitumor immunity, thereby securing a BrC-specific T cell response. These findings provide a clear rationale for clinical exploration of SLN-immune potentiation through local CpG/STAT3i administration in patients with BrC.
- breast neoplasms
- dendritic cells
- immunomodulation
This is an open access article distributed in accordance with the Creative Commons Attribution Non Commercial (CC BY-NC 4.0) license, which permits others to distribute, remix, adapt, build upon this work non-commercially, and license their derivative works on different terms, provided the original work is properly cited, appropriate credit is given, any changes made indicated, and the use is non-commercial. See http://creativecommons.org/licenses/by-nc/4.0/.
Statistics from Altmetric.com
Introduction
In recent years data have accumulated to support a key role for immune-regulated pathways in breast cancer (BrC) development and response to (neo)adjuvant chemotherapy.1 2 These data have reignited interest in BrC immunotherapy, especially for triple negative (TN) and human epidermal growth factor receptor positive (HER+) BrC subtypes.3 4
Dendritic cells (DCs) are vital for the initiation of T cell-mediated antitumor responses as mature DCs are able to (cross) present tumor antigens to activate (cytotoxic) T cells. Unfortunately, tumor-derived factors suppress maturation of DC and instead promote the development of immature myeloid cells that in turn can expand regulatory T cells (Treg), all of which interfere with cytotoxic T cell functionality and contribute to tumor progression.5 6 Indeed, in a flow cytometry-based study, mapping the immune landscape in BrC sentinel lymph nodes (SLNs), we have recently shown that BrC-induced immune suppression coincides with selectively hampered activation of lymph node-resident (LNR) DC subsets, that is, plasmacytoid DC (pDC) and LNR conventional DC (LNR-cDC).7 The SLN represents the site where tumor-reactive T cells should first be primed, but also where immune suppression is expected to shape the premetastatic niche. As such, SLNs are an important target for therapeutic intervention, in particular for immune modulatory strategies aiming to bolster DC activation.
In two separate phase 2 trials in patients with melanoma, we have previously established the immune-potentiating effects of the CpG-B oligonucleotide CPG7909 (CpG), a synthetic Toll-like receptor-9 (TLR9) agonist.8–12 Local administration of CpG increased activation of LNR DC subsets in the SLN and enhanced local and systemic melanoma antigen (Ag)-specific CD8+ T cell responses, resulting in a reduction in SLN metastases and in a significant improvement of recurrence free survival. Unfortunately, CpG can down-modulate its own immune stimulatory activity through direct TLR9-mediated activation of signal transducer and activator of transcription 3 (STAT3), and indirectly by upregulating type I interferons (IFN-I) and STAT3-mediated factors (such as interleukin 6 (IL-6) and IL-10) that in turn can activate STAT3, creating a feedforward mechanism for STAT3 activation in non-TLR9 expressing cDC.13–16 Activation of STAT3, mostly through the JAK2/STAT3 pathway, acts as a master switch in (tumor-induced) immune suppression and premetastatic niche formation,14 15 17 18 explaining the collateral expansion and/or activation of Tregs on CpG treatment,12 19 which might be more detrimental in breast tumors as they generally are more immunologically quiescent. In BrC, activation of the JAK2/STAT3 pathway has been linked to the promotion of an immunosuppressive tumor microenvironment (TME), even in early stage disease.20–23 Moreover, STAT3 overexpression in BrC correlates with higher risk of lymph node metastasis and inversely correlates with response to neoadjuvant chemotherapy.24–26
Evidence for the therapeutic efficacy of combined TLR9 stimulation and STAT3 inhibition was previously provided by Kortylewski et al, showing superior immune stimulatory effects of CpG by eliminating collateral STAT3‐mediated suppressive effects in a mouse-melanoma model.13 27 28 In BrC however, similar strategies have not yet been explored.
Taken together, these observations have prompted the ex vivo functional validation of combined CpG targeting and JAK2/STAT3 inhibition as a potential treatment strategy to modulate the immune status of SLN in patients with BrC. To this end BrC SLN‐derived viable single‐cell samples were used to study the immune modulatory effects of CpG with or without JAK2/STAT3 inhibition on the tumor‐conditioned lymph node microenvironment ex vivo. Our findings provide a clear rationale for further clinical exploration of the immune potentiation of BrC SLN through local administration of a CpG+JAK2/STAT3 inhibitor (STAT3i) cocktail, possibly in conjunction with existing (neo)adjuvant systemic therapies.
Methods
Patients
From 29 female patients with clinically node negative BrC, scheduled to undergo an SLN procedure, viable cells were collected from SLN for subsequent ex vivo immune modulation. Patients with a concurrent malignancy were excluded, as well as patients actively undergoing chemotherapy or immunotherapy. In online supplemental table S1, the clinical and pathological characteristics per patient are shown, linked to the specific experiments for which the SLN of these patients were used.
Supplemental material
SLN cell sampling
Before routine histopathological examination and after confirmation by the pathologist that the SLN was suitable for cell harvesting (ie, >0.5 cm), viable cells were scraped from the SLN using a previously described method.7 29 Collected SLN cells were washed two times in complete medium (CM), comprising Iscove’s Modified Dulbecco’s Medium (IMDM) (BioWhittaker, Verviers, Belgium) supplemented with 10% heat inactivated Fetal Calf Serum (Hyclone Laboratories, Logan, Utah, USA), 100 IE/mL sodium penicillin, 100 µg/mL streptomycin sulfate, 2 mM L-glutamine (P/S/G), and 0.01 mM 2-mercapoethanol, counted, and used directly for further ex vivo immune modulation or stored in liquid nitrogen until further use.
Immune modulatory agents and culture conditions
All experiments described below were performed using BrC SLN cell samples, ex vivo cultured with or without the following immune modulatory agents (ie, culture conditions): IMDM only, that is, negative control (C1), CpG (C2) and CpG+JAK2/STAT3i (C3).
Synthetic CpG-B (CPG7909, Coley Pharmaceutical Group, Wellesley, Massachusetts, USA) was added at a final concentration of 5 µg/mL, and the JAK2/STAT3i AG490 (Invitrogen, PHZ1204), hereinafter referred to as STAT3i, at a final concentration of 10 µM.30–32
DC subset phenotyping
Cell samples from 16 BrC SLNs were used for assessment of DC subset frequency and activation state after culture for 2 days (n=10) and/or 7 days (n=7) under conditions C1–C3. Of note, only one SLN was used to start both a 2-day and 7-day culture. Gating strategies (pre-culture and post-culture) used for phenotypic characterization of the analyzed DC subsets in this study are shown in online supplemental figure S1.
Supplemental material
Before start of the SLN cell culture, a separate fraction of the cell suspension was prestained with monoclonal antibodies (mAbs) BDCA2-FITC and CD123-PerCp-Cy5.5, in order to facilitate post-culture gating and fluorescence-activated cell sorting (FACS) analyses of the pDC subset, as membrane expression of these markers were in part lost during culture; by this prestaining procedure the pDC subset could still be detected post-internalization of the markers and bound mAbs. Cells were resuspended at 1×10⁶ cells/mL in CM and cultured according to conditions C1–C3 for 2 or 7 days at 37°C in a humidified 5% CO2 incubator. In the 7-day cultures, after 48 hours 300 µL medium was replaced with fresh CM with or without CpG±STAT3i. After 2 or 7 days, supernatants were harvested and stored at −20°C for cytokine detection. SLN cells were harvested and stained for FACS analyses as described below.
Due to variations in cell yield per SLN and between culture conditions, in four cases DC subset phenotyping was restricted to either the pDC or cDC subset(s), in two cases not all three culture conditions were tested and in three cases analysis of co-stimulatory markers was limited to CD83. Additionally, as we prioritized post-culture (C1–C3) DC subset analyses, pre-culture DC subset analyses were not performed in two cases. See online supplemental table S1.
Cytokine and chemokine analyses
Supernatants of the SLN cultures were analyzed for cytokine content using the human inflammatory cytokine bead array (CBA) kit at day 2 of culture (cytokines: IL-8, IL-1β, IL-6, IL-10, tumor necrosis factor-α (TNF-α) and IL-12p70) or the Th1/Th2 CBA kit at day 7 of culture (cytokines: IL-2, IL-4, IL-6, IL-10, TNF-α and interferon-γ (IFN-γ)). A CBA flex kit was used for detection of the chemokines CCL2, CCL5, CXCL9 and CXCL10 (day 2 and day 7). CBA analyses were performed following the manufacturer’s instructions and with the use of CBA analysis software (all from BD Biosciences).
Polyclonal T cell expansion and intracellular T cell cytokine analyses
Cells from five BrC SLNs were used for analysis of intracellular T cell cytokines after a 7-day polyclonal T cell expansion (as previously described)9 in the absence or presence of CpG and/or STAT3i. Expanded T cells were stimulated for 4–5 hours in a humidified 5% CO2 incubator at 37°C with 50 ng/mL phorbol myristate acetate and 500 ng/mL ionomycin in the presence of 1:500 Golgiplug (BD Biosciences). After stimulation cells were harvested, washed and subsequently used for staining and FACS analyses as described below.
Flow cytometric staining and analyses
DC and T cell subsets in BrC SLN cell samples were phenotypically analyzed by four-color flow cytometry using mAbs, directed against: CD3, CD11c, CD25 (BD Biosciences, all labeled with allophycocyanin (APC)); CD3 and CD14 (BD Biosciences; both labeled with peridinin chlorophyll protein-cyanine 5.5 (PerCP-Cy5.5)); CD19 (BD Biosciences, labeled with PerCP); CD123 (BD Biosciences, labeled with phycoerythrin (PE)-Cy5) CD1a, CD8 (BD Biosciences) and CD40, CD83 (Beckman Coulter), all labeled with PE; CD4 (BD Biosciences), CD83 (Beckman-Coulter), CD86 (Pharmigen), BDCA2 (Miltenyi Biotec), all labeled with fluorescein isothiocyanate (FITC). We previously found CD40 to be the most sensitive activation marker for pDC8 and therefore opted to include this rather than the (for pDC) less sensitive CD86 marker. Vice versa, we preferred CD86 over CD40 as activation marker for the cDC subsets because we have previously shown that under unstimulated (ie, medium control) conditions CD40 expression level of cDC subsets is approximately 100%, and more limited upregulation of CD40 levels across cDC subsets was observed after in vivo CpG-B delivery.8 10
Staining was performed in phosphate buffered saline supplemented with 0.1% bovine serum albumin and 0.02% sodium azide for 30 min. For detection of Tregs, intracellular FoxP3 staining was performed using the eBioscience (San Diego, California, USA) PE-antihuman FoxP3 staining set following the manufacturer’s instructions. The phenotypic definitions for each of the assessed immune subsets is presented in online supplemental table S2.
Supplemental material
STAT3 phosphorylation (pSTAT3) was assessed by intracellular staining with the PE-conjugated mAb against pSTAT3 (pY705, clone 4/pSTAT3; BD Phosflow), following the manufacturer’s instructions.
Expanded T cells from SLN cell samples were used for analysis of intracellular T cell cytokines. After stimulation (see above) cells were stained with APC-conjugated CD4 and PerCP-conjugated CD8 surface mAbs (BD Biosciences) and after fixation with Cytofix/Cytoperm solution and permeabilization with Perm/Wash solution (both from BD Biosciences) cells were stained intracellularly with PE-conjugated mAbs specific for IL-4 or IL-5 and with FITC-conjugated mAbs specific for IFNγ, TNFα or IL-2 (BD Biosciences).
Flow cytometric analyses were performed on a FACSCalibur flow cytometer (Becton Dickinson) equipped with Cellquest data acquisition and analysis software. Data were analyzed using Kaluza analysis software. Matching isotype antibodies were used as negative controls.
Mammaglobin-A-specific T cell stimulation and IFNγ ELISPOT analyses
In 9 BrC SLNs, Ag-specific T cell IFNγ release was assessed against a pool of 21 overlapping long peptides covering the Mammaglobin-A (MAM-A) sequence (PepMix Human MAM-A; JPT) as tumor Ag, and against a pool common recall Ags selected from human leukocyte antigen class I and II-restricted T cell epitopes from Clostridium tetani, Epstein-Barr virus, human cytomegalovirus and influenza A (PepMix-CEFT; JPT), as positive control.
Cell suspensions were equally divided into responder and stimulator cells. Stimulator cells were loaded with either MAM-A (1 µg/mL) or with CEFT (1 µg/mL) and 3 µg/mL β2-microglobulin (30C-cp1022U; Fitzgerald Industries). After 1–3 hours of incubation at 37°C, stimulator cells were washed to remove unbound peptides. Stimulator and responder cells were resuspended at 1×10⁶/ mL IMDM+10% human pooled serum+P/S/G and were co-seeded in triplicate in a 12-well or 24-well plate. To each well, IL-2 (10 U/mL; Novartis) and IL-15 (10 ng/mL; 34-8159; eBioscience) were added and depending on the culture condition CpG±STAT3i was added. Per culture condition and peptide pool at least 3×10⁶ cells (MAM-A) and 2×10⁶ (CEFT) were used. Cells were incubated for 10 days in a humidified 5% CO2 incubator at 37°C. Every 3–4 days the medium was replenished with IL-2 and IL-15. Cells were harvested at day 10 and seeded in 2×3–6 replicate wells at a density of 1×10⁵/ well (MAM-A) or 0.5×10⁵/well (CEFT) in a multiscreen 96-well plate coated with an IFNγ catch antibody (3420-2A; Mabtech). Cells were either rechallenged overnight with the peptides to which they were initially stimulated or cultured with a dimethylsulfoxide (DMSO) vehicle control. Of note, as a technical control, phytohemagglutinin (PHA) at a concentration of 5 µg/mL was tested in duplicate (10,000 cells/well) for each plate. Next day the cells were flicked off and the plates were developed according to manufacturer’s instructions. Spots were counted by an automated ELISPOT reader (AID Diagnostika). T cell ELISPOT activity (ie, Ag-specific T cell reactivity) was expressed as the number of spots per well per 1×10⁵ cells (MAM-A) or 0.5×10⁵ cells (CEFT), obtained by subtracting frequencies of spot-forming T cells in the DMSO control wells from those in the peptide-stimulated wells. Enhancement of the observed unmodulated Ag-specific T cell reactivity was considered significant when (1) the mean number of spots in the test condition (C2 or C3) was significantly higher than the mean number of spots in the control condition (C1) in a post-hoc test of a one-way analysis of variance (ANOVA) or Kruskall-Wallis test; and (2) the mean number of spots in the test condition (C2 or C3) exceeded the mean number of spots in the control condition (C1) by at least twofold.
Additionally, prior to rechallenge for the IFNγ ELISPOT assay, we used any leftover cells from the MAM-A-stimulated SLN cell cultures (n=6) to measure CD4, CD8 and Treg frequencies by means of FACS analyses.
Statistical analyses
Normal distribution was tested using the Shapiro-Wilk test. Differences were tested for statistical significance using repeated measures one-way ANOVA with post-hoc Tukey tests in case of normally distributed data, or alternatively by the Friedman test with post-hoc Dunn’s tests. In case of missing values a mixed-effects model was applied, with post-hoc multiple comparison Tukey’s test. For the assessment of differences in T cell ELISPOT activity, ordinary one-way ANOVA (normal data distribution) or Kruskall-Wallis (non-normal data distribution) with corresponding post-hoc tests were used. Data were analyzed using Prism 8 Software. P values of <0.05 were considered statistically significant.
Results
AG490 can inhibit CpG-induced STAT3 activation
To ascertain that the JAK2/STAT3 inhibitor AG490 (STAT3i) could counteract CpG-induced STAT3 activation, we assessed pSTAT3 in both TLR9− cDCs (marked by shared high expression levels of CD11c) and TLR9+ pDCs in three separate BrC SLN cell samples cultured for 2 and 24 hours, in the absence or presence of CpG or CpG+STAT3i (see figure 1A for a representative result of pSTAT3 in CD11chi cDCs at 24 hours). Although observed differences were borderline significant due to low sample number and intersample variability, clear effects were observed (see figure 1 and online supplemental figure S2). We confirmed the capability of CpG to activate STAT3 in SLN-derived DCs, in both cDCs and in pDCs, demonstrated by an approximate twofold increase in pSTAT3 expression, both by mean fluorescence intensity and percentage positive cells. Whereas pSTAT3 expression was effectively constrained to unstimulated levels by STAT3i at 24 hours for both cDCs and pDCs (figure 1B), this was not yet the case at 2 hours (online supplemental figure S2), revealing CpG-induced pSTAT3 to be rapidly initiated whereas the inhibitory effects of AG490 took longer to take effect.
Supplemental material
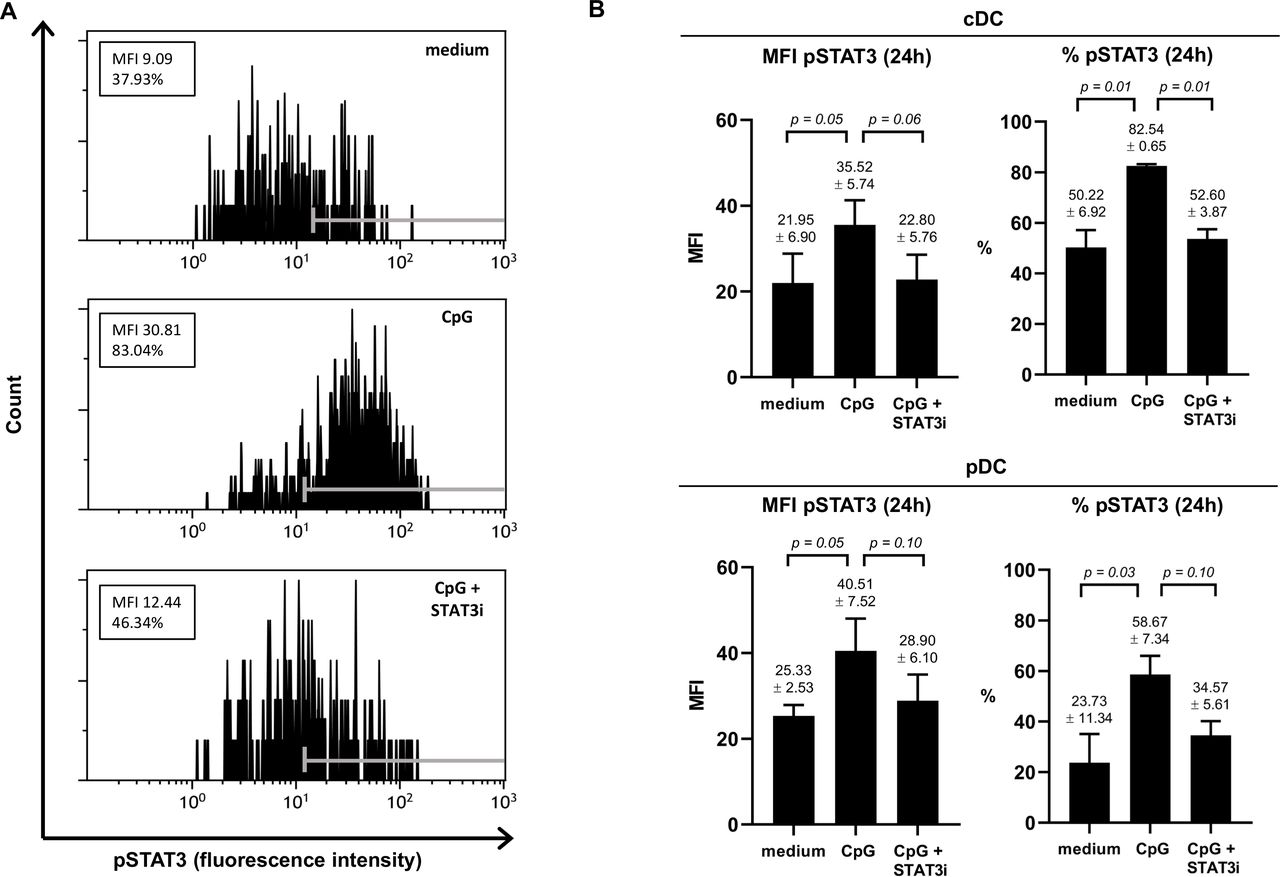
Effect of CpG±AG490 on pSTAT3 levels in BrC SLN-derived cDC and pDC. Phosphorylated signal transducer and activator of transcription 3 (pSTAT3) levels (assessed by flow cytometric analysis) in the conventional DC population (phenotypically characterized by shared CD11chi) and the pDC subset measured in metastasis negative BrC SLN cell samples, cultured for 24 hours with medium, CpG or CpG+AG490. (A) Representative histogram plots of pSTAT3 fluorescence intensity (FI) levels in CD11chi CDC (24 hours) from one of three individual BrC SLN cell samples are shown. Positive FI ranges according to fluorescence minus one control values are displayed with gray markers in each histogram. Both the mean fluorescence intensity (MFI) values and percentage pSTAT3 positive cells are displayed in boxes. (B) MFI of pSTAT3 and percentage pSTAT3 positive cells (both at 24 hours of culture) of cDCs (top bar graphs) and pDCs (bottom bar graphs) in three individual BrC SLN cell samples. Bars represent mean with SEM, with mean pSTAT3 levels (±SEM) of each culture condition and corresponding p values displayed above the error bars. BrC, breast cancer; cDCs, conventional DCs; DC, dendritic cell; pDCs, plasmacytoid DCs; SLN, sentinel lymph node; STAT3i, STAT3 inhibitor.
Superior DC maturation, with preferential activation of LNR DC subsets after ex vivo SLN-immune modulation with CpG+STAT3i
We identified the four DC subsets as previously described in a comprehensive flow cytometry-based study mapping the immune landscape in BrC SLN.7 These included two migratory CD1a+ cDC subsets: CD11cintCD1ahi Langerhans cells; CD11chiCD1aint dermal-like DCs and two LNR DC subsets: the CD1a − CD11c + CD14 − LNR-cDC and the CD123+BDCA2 + pDC. Gating strategies (pre-culture and post-culture) are shown in online supplemental figure S1.
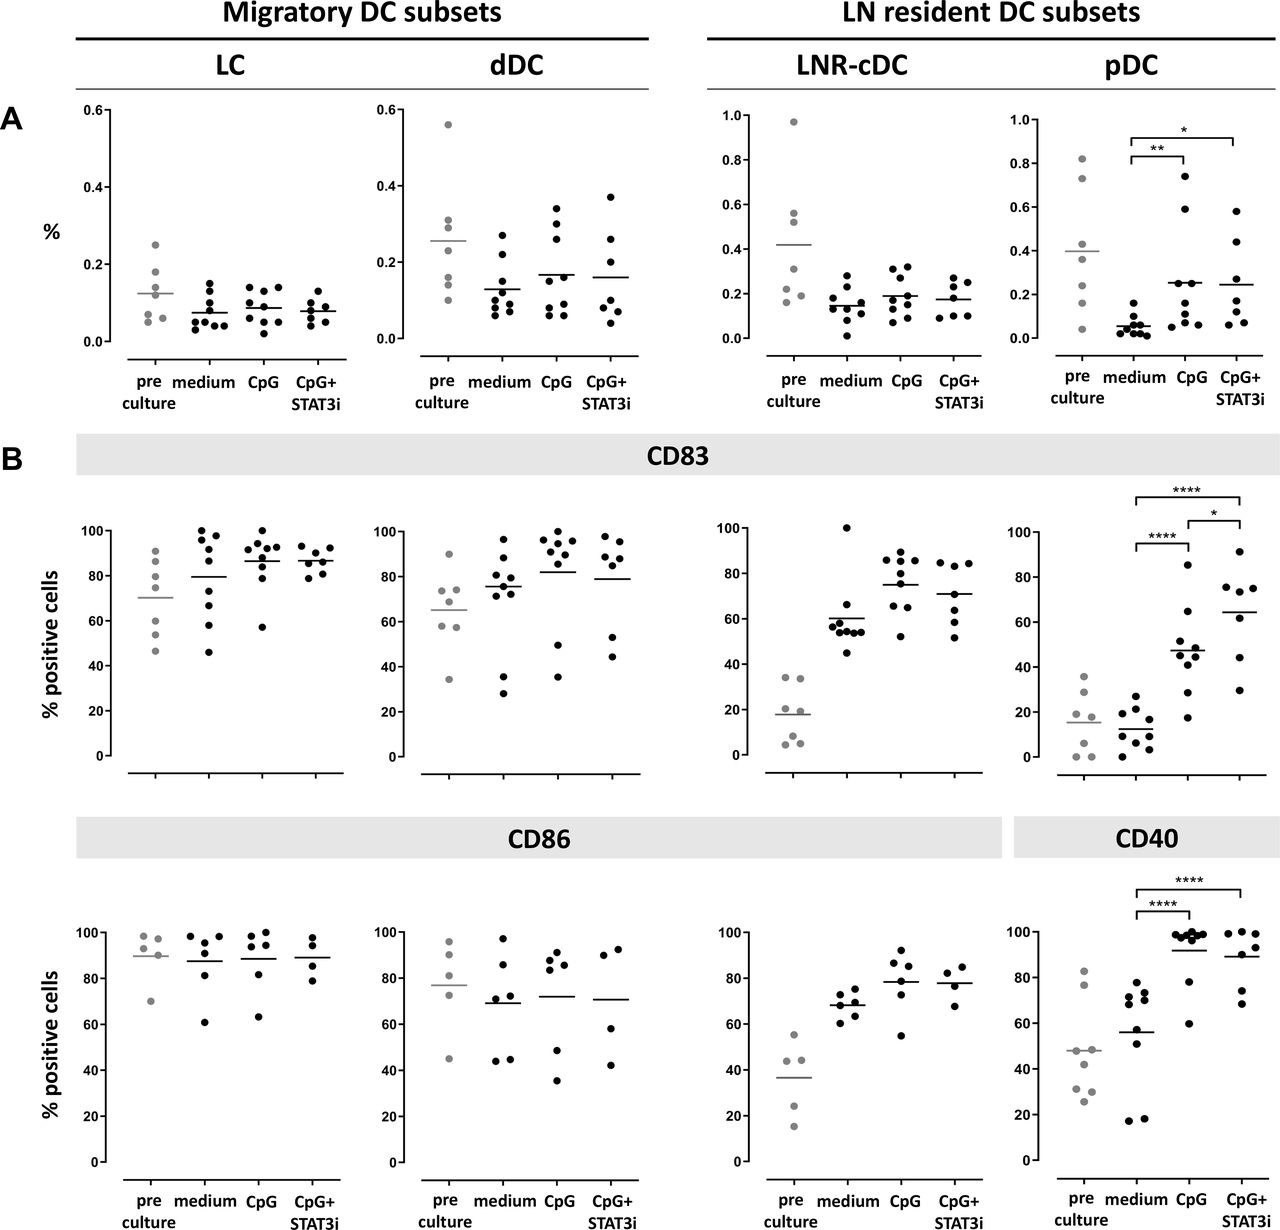
Frequency and activation state of the four DC subsets after 2 days and 7 days ex vivo immune stimulation are shown in figures 2 and 3, respectively. cDC subset frequencies dropped during culture for all subsets as compared with pre-culture rates, regardless of the culture condition. Improved survival of pDC was observed by CpG exposure in the cultures (figures 2A and 3A).

Frequency and activation state of DC subsets pre/post-SLN single-cell culture (at day 2). Columns represent the different DC subsets. On the left the two CD1a+ migratory cDC subsets (LC and dDC), on the right the two LN resident DC subsets (LNR-cDC and pDC). In each dot plot, day 2 post-culture data of each culture condition (medium, CpG and CpG+STAT3i) are shown and compared. Corresponding pre-culture data are displayed in gray dots. (A) Frequencies of DC subsets, expressed as percentage of total LN cells. (B) Expression levels of maturation (CD83) and co-stimulatory/activation (CD86 for cDC and CD40 for pDC) surface receptors on different DC subsets, expressed as percentage of positive cells within each subset. Bars represent means. *p=0.01–0.05; **p=0.001–0.01; ***p=0.0001–0.001 and ****p<0.0001 in a repeated measures one-way ANOVA (or mixed-effects model in case of missing values), with post-hoc multiple comparison Tukey’s test. ANOVA, analysis of variance; cDC, conventional DC; DC, dendritic cell; dDC, dermal-like DC; LC, Langerhans cell; LN, lymph node; LNR, LN resident; pDC, plasmacytoid DC; SLN, sentinel LN; STAT3i, signal transducer and activator of transcription 3 inhibitor.

Frequency and activation state of DC subsets pre/post-culture SLN single-cell culture (at day 7). Columns represent the different DC subsets. On the left the two CD1a+migratory cDC subsets (LC and dDC), on the right the two LN resident DC subsets (LNR-cDC and pDC). In each dot plot, day 7 post-culture data of each culture condition (medium, CpG and CpG+STAT3i) are shown and compared. Corresponding pre-culture data are displayed in gray dots. (A) Frequencies of DC subsets, expressed as percentage of total LN cells. (B) Expression levels of maturation (CD83) and co-stimulatory/activation (CD86 for cDC and CD40 for pDC) surface receptors on different DC subsets, expressed as percentage of positive cells within each subset. Bars represent means. *p=0.01–0.05; **p=0.001–0.01; ***p=0.0001–0.001 and ****p<0.0001 in a repeated measures one-way ANOVA or Friedman, with post-hoc multiple comparison Tukey’s or Dunn’s test. ANOVA, analysis of variance; cDC, conventional DC; DC, dendritic cell; dDC, dermal-like DC; LC, Langerhans cell; LN, lymph node; LNR, LN resident; pDC, plasmacytoid DC; SLN, sentinel LN; STAT3i, signal transducer and activator of transcription 3 inhibitor.
Activation marker levels on the cDC subsets were increased by day 2 relative to pre-culture values, revealing maturation induction by handling and culture per se without significant enhancement by CpG with or without STAT3i (figure 2B). In contrast, activation of pDC in the medium control condition remained similar to pre-culture levels, revealing significant activation by CpG at day 2 of culture, and even more so by the combination of CpG and STAT3i, as demonstrated by the further upregulated CD83 levels. By day 7, significant upregulation of the activation markers by CpG (over the medium condition) was observed on both cDC and pDC subsets, and significantly more so for the maturation marker CD83 when CpG was combined with STAT3i (figure 3B). Overall, the immune modulatory effects of CpG, with or without STAT3i, were most profound on the LNR DC subsets (ie, LNR-cDC and pDC) (figures 2B and 3B).
Combined CpG and STAT3i results in superior Th1 skewing by counteracting CpG-induced Th2 cytokine release
Based on optimal early release of inflammatory cytokines related to DC activation and optimal release of effector cytokines on T cell activation/differentiation by day 7 of SLN cultures, supernatants taken after 2 days were used for inflammatory cytokine analyses, whereas supernatants taken after 7 days were used for Th1/Th2 cytokine analyses. Chemokine analyses were performed both after 2 and 7 days. At day 2, significantly increased levels of IL-6, TNFα and IL-10 were found in the supernatants of both the CpG and CpG+STAT3i conditioned SLN cell cultures (figure 4A), whereas IL-1b, IL-8 and IL-12p70 levels were unchanged compared with medium control samples (see online supplemental figure S3). Moreover, irrespective of STAT3i, significantly increased levels of all analyzed chemokines (day 2) were observed in CpG conditioned cultures. By day 7, levels of CCL5, CXCL9, CXCL10 in the CpG±STAT3i groups were even further increased over the medium control samples. Of note, by day 7 CCL2 levels in both the CpG and CpG STAT3i groups had returned to medium control levels (figure 4B). Similarly, at day 7, all Th1 cytokines were increased in the CpG and CpG+STAT3i cultures as compared with the medium control, significantly so for IL-6, TNFα and IFNγ (figure 4C), as were IL-10 levels. CpG combined with STAT3i targeting, resulted in decreased IL-4 levels compared with CpG alone (p=0.05), leading to an even more significantly skewed Th1 profile (as compared with medium control samples) when adding STAT3i to CpG as determined by IFNγ/IL-4 ratios (figure 4C).
Supplemental material
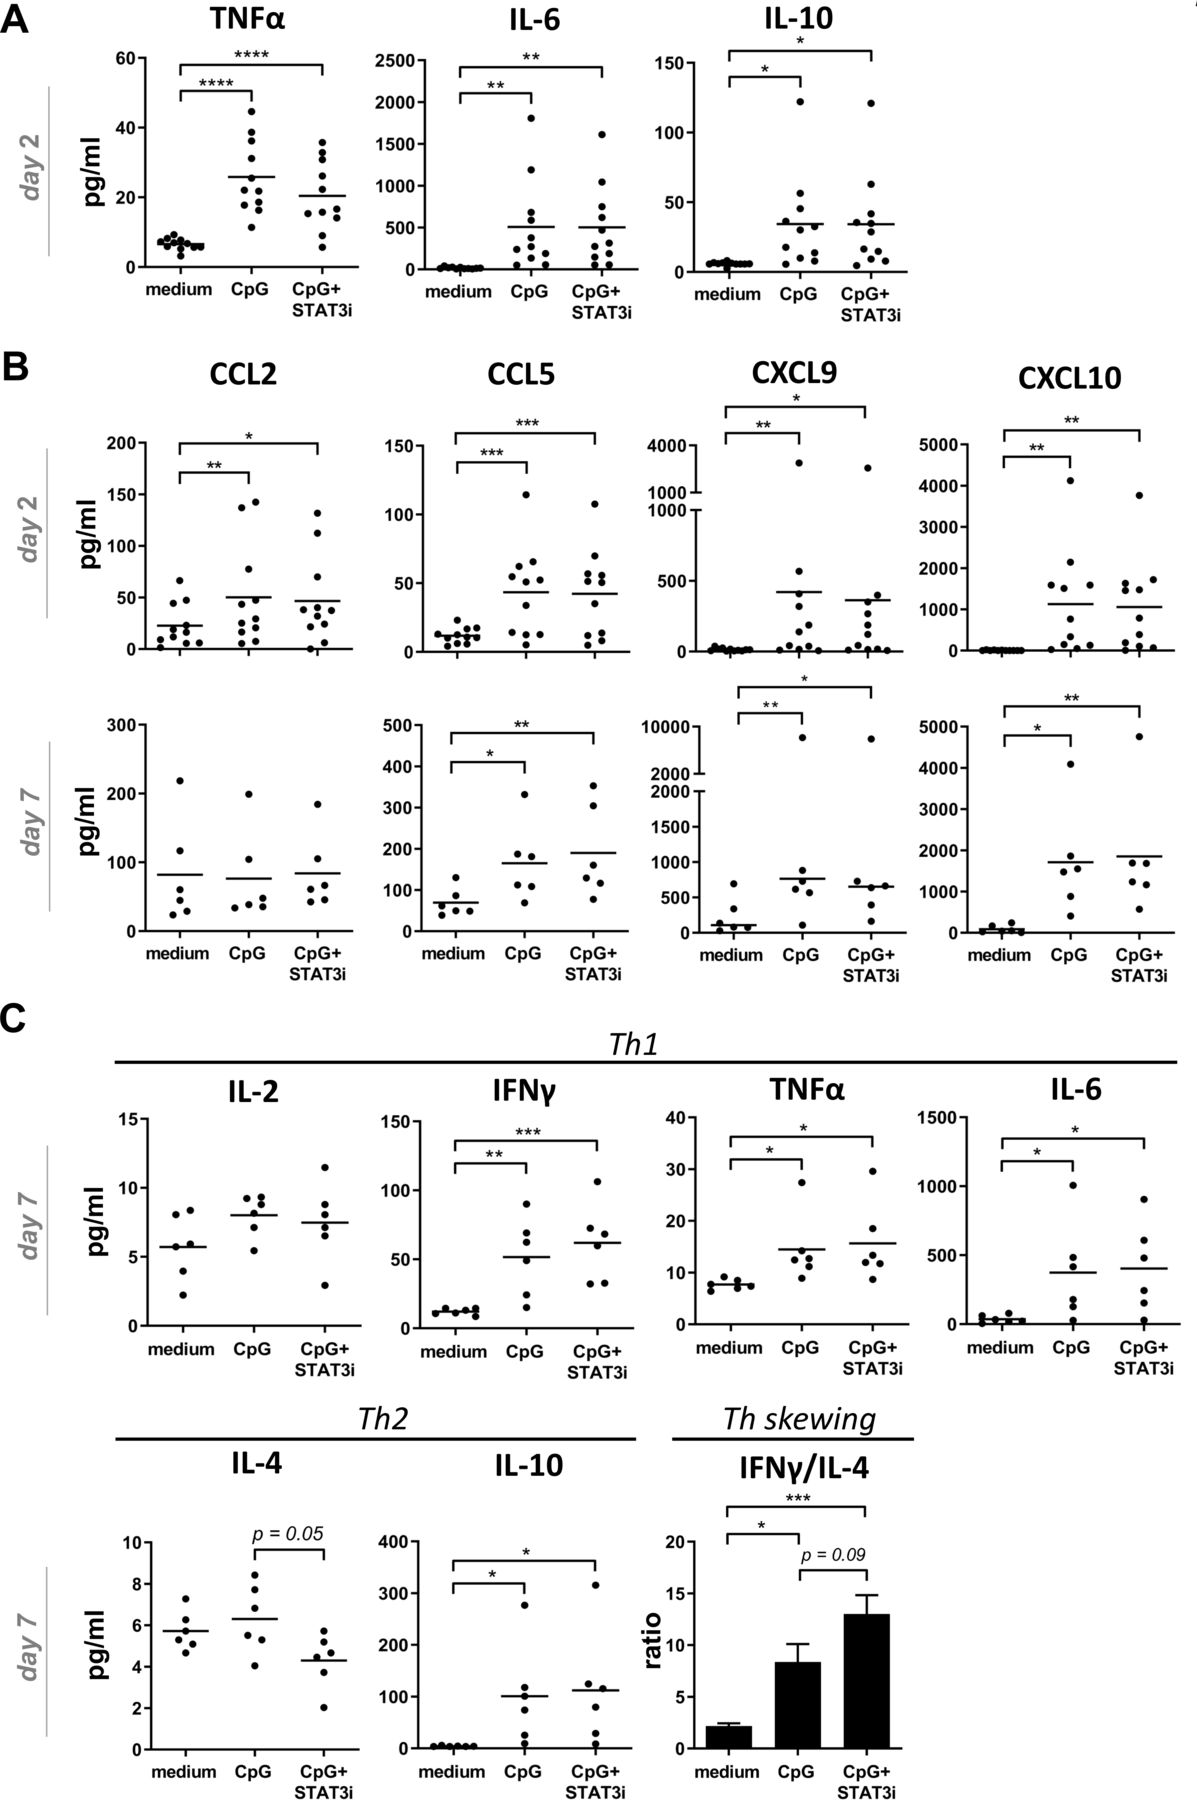
Cytokine and chemokine release in BrC SLN cell cultures. Cytokine/chemokine release levels (pg/mL) in supernatants of medium, CpG and CpG+STAT3i conditioned BrC SLN single-cell suspensions. (A) Cumulative inflammatory cytokine levels after 2 days of culture (n=11), (B) cumulative chemokine levels after 2 (n=11) and 7 days (n=6) of culture and (C) Th1/Th2 cytokine levels and Th skewing after 7 days of culture (n=6). Means (in bar graphs with SEM) are shown. *p=0.01–0.05; **p=0.001–0.01 and ***p=0.0001–0.001 in an RM one way ANOVA or Friedman with post-hoc multiple comparison Tukey’s or Dunn’s test. ANOVA, analysis of variance; BrC, breast cancer; IFNγ, interferon-γ; IL, interleukin; RM, repeated measure; SLN, sentinel lymph node; STAT3i, signal transducer and activator of transcription 3 inhibitor; TNFα, tumor necrosis factor-α.
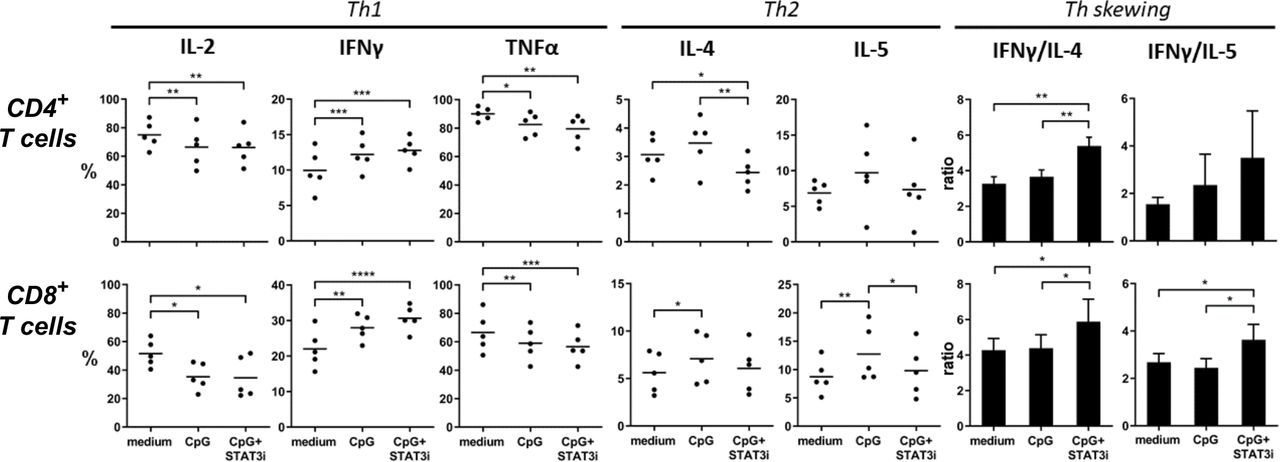
Furthermore, the effects of CpG, with or without STAT3i, on CD4+ and CD8+ T cell-specific skewing was measured by intracellular detection of T cell cytokines after anti-CD3/CD28 plate-bound T cell expansion of SLN single-cell samples (figure 5, n=5). After expansion mean percentage (±SEM) of CD4+ and CD8+ T cells were, respectively, 54.05% (±3.83) and 6.35% (±0.55) in medium control samples; 41.29% (±4.83) and 9.81% (±1.25) in CpG conditioned samples and 41.68% (±3.21) and 10.45% (±1.25) in CpG+STAT3i conditioned samples. Whereas CpG exposure during expansion decreased IL-2 and TNFα expression, expression of IFNγ, IL-4, and IL-5 were upregulated in both CD4+ and CD8+ T cells. Remarkably, the addition of STAT3i to CpG alone further upregulated IFNγ expression but significantly downregulated IL-4 expressing CD4+ T cells (p=0.008) and IL-5 expressing CD8+ T cells (p=0.03), resulting in significant Th1 skewing compared with CpG in both CD4+ and CD8+ effector T cells (p=0.003 for CD4+ T cell IFNγ/IL-4 ratio; p=0.04 and p=0.01 for CD8+ T cell IFNγ/IL-4 and IFNγ/IL-5 ratios).

Intracellular CD4+ and CD8+ cytokine profiles. Intracellular cytokine levels in anti-CD3/CD28 expanded SLN cell samples (n=5), cultured with medium, CpG and CpG+STAT3i of CD4+ (top row) and CD8+ (bottom row) T cells after PMA/ionomycin stimulation. Shown are percentages of T cells positive for the indicated intracellular Th1 and Th2 cytokines and Th skewing. Means (in bars graphs with SEM) are shown. *p=0.01–0.05; **p=0.001–0.01; ***p=0.0001–0.001 and ****p<0.0001 in a repeated measures one way ANOVA with post-hoc multiple comparison Tukey’s test. ANOVA, analysis of variance; IFNγ, interferon-γ; IL, interleukin; PMA, phorbol myristate acetate; SLN, sentinel lymph node; STAT3i, signal transducer and activator of transcription 3 inhibitor; TNFα, tumor necrosis factor-α.
Combined SLN modulation with CpG and STAT3i enhances MAM-A-specific T cell-specific responses and simultaneously decreases CpG-induced Treg frequencies
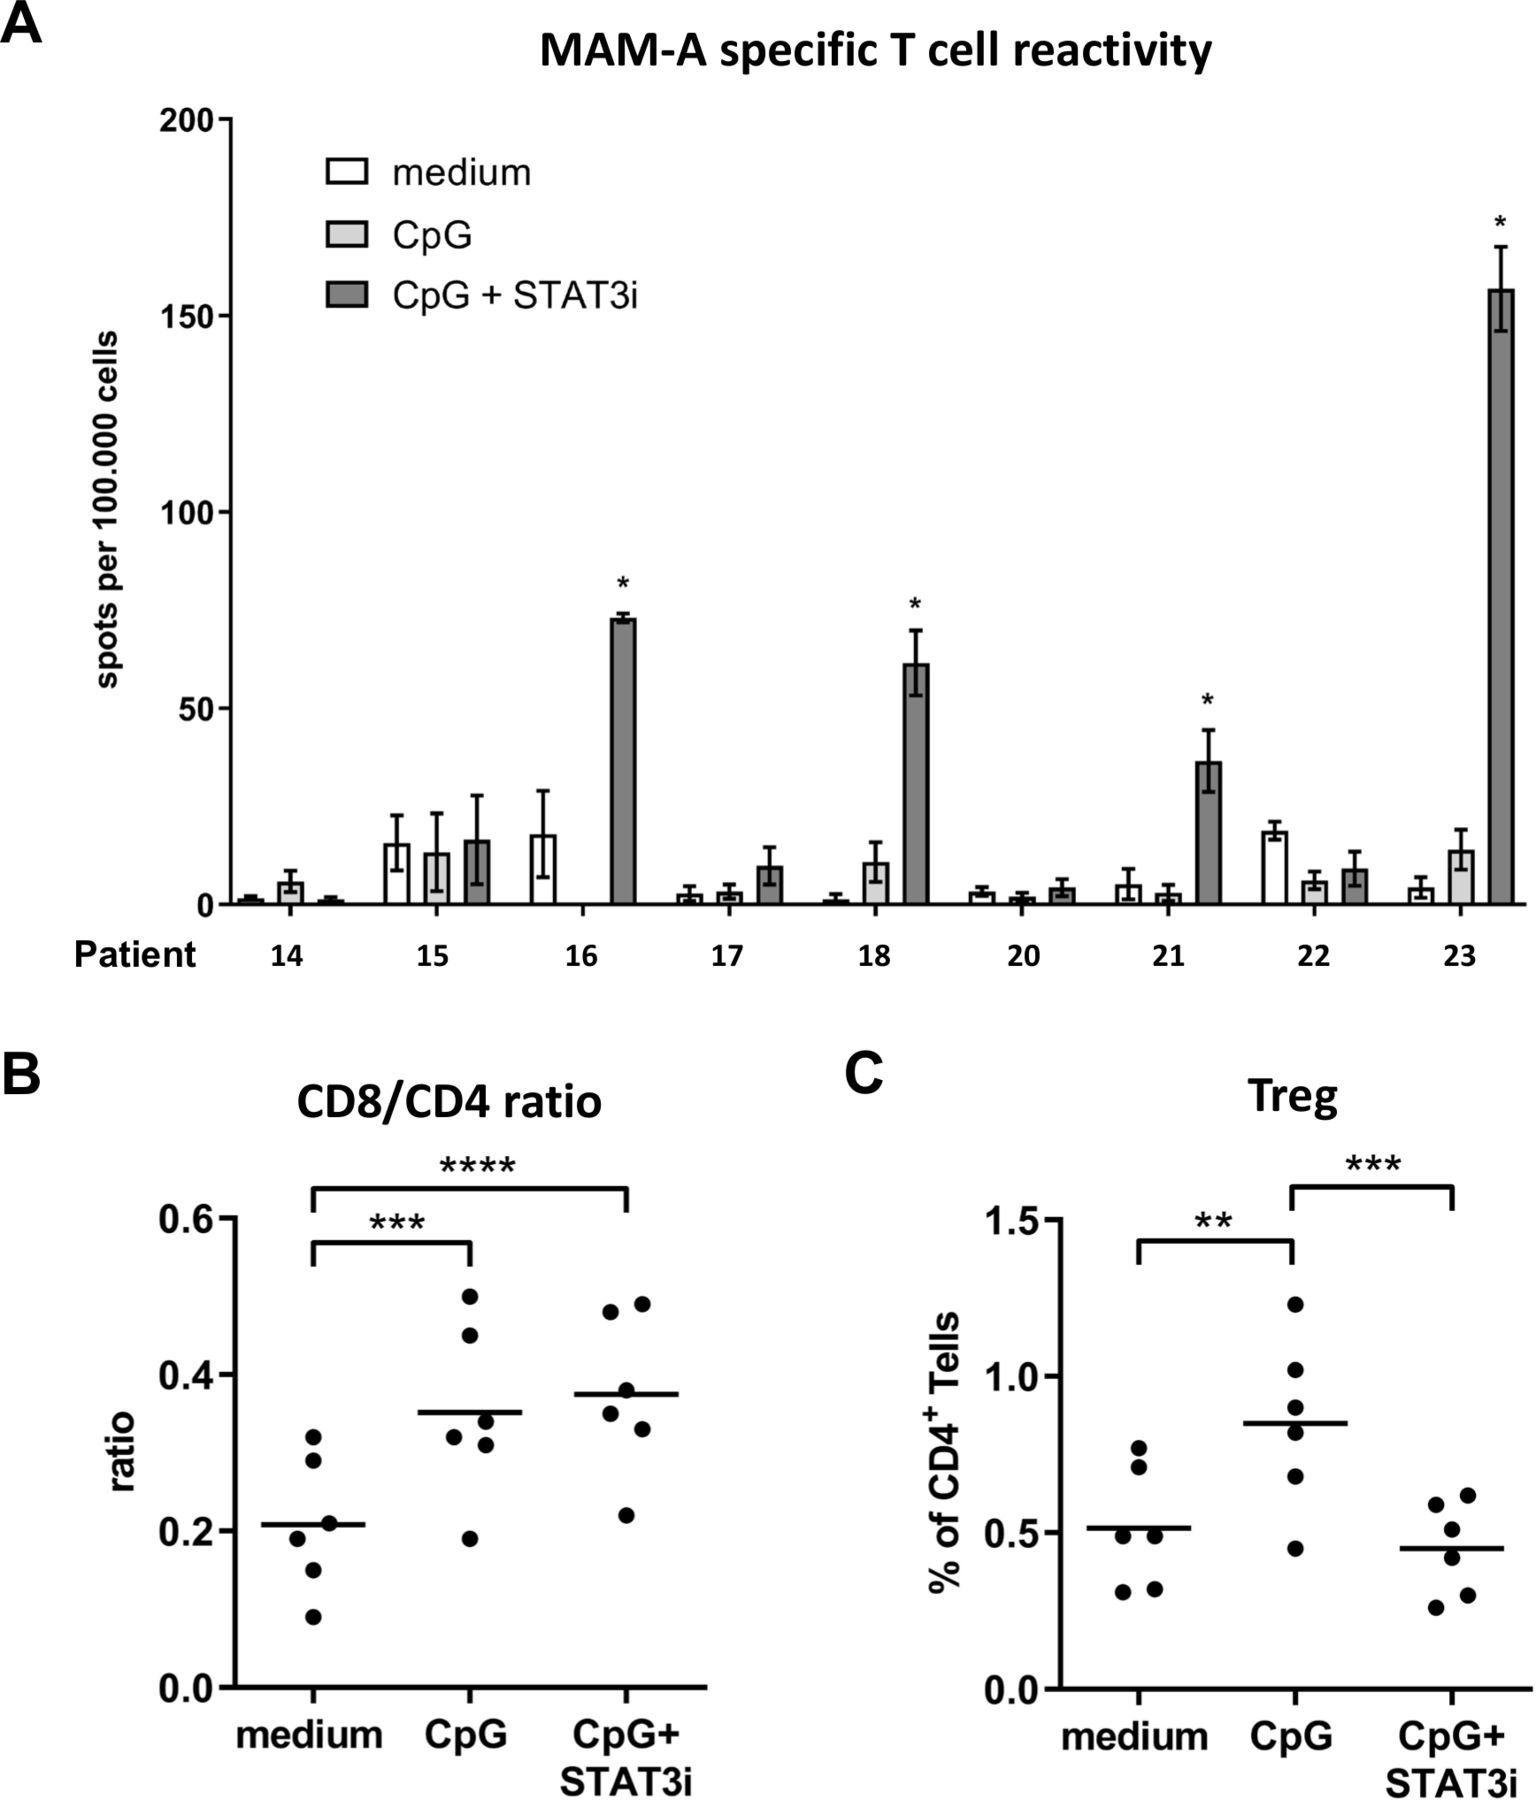
Nine BrC SLN single-cell suspensions were cultured with a set of overlapping peptides covering the sequence of the BrC-associated Ag MAM-A, in the absence or presence of CpG±STAT3i, over a period of 10 days. Subsequently, Ag-specific T cell reactivity was measured on restimulation by IFNγ ELISPOT readout. Reactivity against a CEFT peptide pool was determined as a measure of general immunocompetence, with Ag-specific mean spots per 100,000 wells exceeding 100 in all BrC SLN and culture conditions; in all assays technical PHA controls were positive (data not shown). All nine BrC SLNs tested for BrC-specific T cell responses corresponded to hormone receptor (HR) positive BrC which were either pT1, that is, ≤2 cm (8/9) or pT2, that is, >2–5 cm (1/9); only one SLN was metastasis positive (online supplemental table S1). Compared with medium control samples, significantly enhanced MAM-A-specific T cell reactivity was detected in four of nine BrC SLNs after combined CpG and STAT3i modulation, whereas no such reactivity could be detected in the CpG group (figure 6A). Of the four SLNs revealing significantly enhanced MAM-A-specific T cell reactivity, all were metastasis negative and derived from pT1 BrC.

Mammaglobin-A (MAM-A)-specific T cell reactivity and (regulatory) T cell subsets (Tregs). (A) MAM-A-specific T cell reactivity (by IFNγ ELISPOT readout) per patient (n=9) measured in BrC SLN cell samples cultured with medium (open bars), CpG (light gray bars) and CpG+STAT3i (dark gray bars) for 10 days. MAM-A-specific T cell reactivity was expressed as the number of MAM-A-specific spots per well per 1×10⁵ cells with spots in DMSO control wells subtracted. Bars represent mean (±SEM) of at least triplicate samples. Asterisks (*) represent significant enhanced MAM-A specific T cell reactivity (compared with medium), according to criteria as formulated in the methods section. Patient numbers correspond to those in the general overview of patient characteristics and experiments summarized in online supplemental table S1. (B) CD8/CD4 ratios and (C) Tregs in the same 10 day BrC SLN cell cultures prior to MAM-A-specific restimulation (n=6); **p=0.001–0.01 and ***p=0.0001–0.001 in an RM one way ANOVA with post-hoc multiple comparison Tukey’s test. ANOVA, analysis of variance; BrC, breast cancer; DMSO, dimethylsulphoxide; IFNγ, interferon-γ; RM, repeated measure; SLN, sentinel lymph node; STAT3i, signal transducer and activator of transcription 3 inhibitor.
In six of nine tested samples, CD4+ and CD8+ T cell frequencies were measured prior to the IFNγ ELISPOT assay: mean percentages (±SEM) were, respectively, 50.29% (±3.04) and 9.89% (±1.26) in medium control samples; 42.64% (±2.60) and 14.36% (±1.07) in CpG conditioned samples and 42.60% (±2.72) and 15.44% (±1.11) in CpG+STAT3i conditioned samples. In both the CpG and CpG+STAT3i group, we observed significantly higher CD8/CD4 ratios as compared with the medium controls (figure 6B), which was mostly due to preferential CD8+ T cell expansion (nearly 50% relative increase). Additionally, frequencies of CD4+CD25hiFoxP3hi Tregs were significantly higher in the CpG group as compared with the medium control group. On combined CpG and STAT3i modulation, these Treg frequencies were significantly decreased and comparable to medium control levels (figure 6C).
Discussion
DCs are central regulators of antitumor immunity and as such represent prime targets of BrC-mediated immune suppression. In a previous comparative analysis of healthy breast draining LN versus SLN of patients with BrC, we showed that BrC-induced immune suppression primarily affected LNR DC subsets (ie, pDC and LNR-cDC) rather than migratory CD1a+ DC subsets. Moreover, this suppression already occurred prior to lymph node involvement and preceded profoundly disabled T cell effector functions in tumor-involved BrC SLN, pinpointing these LNR DC subsets as pivotal regulators of cellular immune suppressive pathways and therefore as promising therapeutic targets to combat BrC-induced immune suppression and secure the induction of effective antitumor immunity.7 In this report we have explored an SLN-immune modulatory strategy to effectively counteract this previously described immune suppression in BrC SLN.
We cultured viable BrC SLN-derived single-cell suspensions in the absence or presence of the immune stimulatory agent CpG with or without a small-molecule inhibitor of the JAK2/STAT3 pathway, AG490 (STAT3i), and determined the effects on DC subset frequency and activation state after 2 and 7 days of culture. We believe that the 7-day cultures most accurately reflect the overall effects of the specific immune modulatory agents (ie, CpG and CpG+STAT3i), because at day 7 external effects (ie, effects of handling and of culture per se) were minimized demonstrated by the observation that DC subset activation/maturation state in the unstimulated control group was either lower or comparable to pre-culture levels as opposed to findings at day 2. Moreover, inhibition of the JAK2/STAT3 pathway results in time-dependent activation of NF-κB which is believed to be the underlying mechanism for DC activation through JAK2/STAT3 inhibition.18 33 This notion, combined with previous findings that CpG-induced pDC activation allows the indirect (and thus delayed) activation of non-TLR9 expressing cDC subsets through induction of local cytokine release from pDC, most notably IFN-I,8 34 provides additional support that the 7-day cultures also allow these delayed effects to become detectable. In keeping with this, CpG-induced pDC activation was already detectable and significant by day 2, whereas CpG-induced activation of the cDC subsets was only detectable and significant by day 7.
Based on results from the 7-day cell cultures, CpG exposure induced activation (ie, increased CD86 or CD40 expression) of all DC subsets, whereas maturation (marked by CD83 expression) was most profoundly induced in LNR DC subsets (ie, pDC and LNR-cDC). These results are in line with our previous findings that local CpG administration in patients with melanoma led to the preferential recruitment and maturation of these LNR DC subsets.8 10 In our current study, we additionally assessed the immune modulatory effect of combined STAT3 targeting. The direct antitumor effect of STAT3i alone has been established in several pre-clinical BrC studies.35–37 However, while in these studies STAT3i was assessed in the context of targeting the primary tumor itself where STAT3 activation is abundantly present, in our study design we specifically aimed to target BrC draining SLN. As the BrC SLN in our study were derived from patients in the early stage and were mostly metastases free, baseline STAT3 activation was likely less present than in these tumor models but was predominantly induced by CpG administration (as also illustrated by figure 1). Indeed, in three separate BrC SLN cultures no activating effects of STAT3i only were observed (online supplemental figure S4). Therefore, our approach of combining STAT3i with CpG administration was specifically intended to counterbalance CpG-induced STAT3 activation and associated Th2 skewing and Treg expansion.
Supplemental material
Adding STAT3i to CpG further enhanced the maturation state (CD83 expression) of all DC subsets, but most significantly of the LNR-cDC and pDC subsets. Whereas pDCs are involved in IFN-I-driven boosting of cytotoxic T cell responses,38 the LNR-cDC subset has been linked to cross-priming of cytotoxic T cells. We previously showed that under steady state conditions this LNR-cDC subset preferentially expressed BDCA3 and CLEC9a compared with its migratory cDC counterparts10 39 and both we and other groups have linked this BDCA3+ DC population (designated cDC1) to cross-priming abilities, vital to the elicitation of an effective antitumor CD8+ T cell-mediated immune response.39–41 More recent, as yet unpublished, studies from our lab employing multi-parameter FACS panels of up to 15 markers have shown the LNR-cDC from these SLN suspensions to consist mostly (>75%) of more cDC2-like DC with co-expression of both CD1c and BDCA3, but also of a minority of CD1c−CD141hi cDC1-like cells (<25%), see online supplemental figure S5; our current data suggest that both are equally activated by CpG±STAT3i. In light of this, our finding that combined CpG and STAT3i targeting can counteract (more effectively than CpG alone) BrC-induced suppression of all these LNR DC subsets would point to the likely induction of a more robust T cell response.
Supplemental material
To further investigate this, Ag-specific effector T cell frequencies against MAM-A, a BrC-associated Ag expressed in up to 80% and not restricted to BrC subtype,42 43 were quantified in BrC SLN by means of an IFNγ ELISPOT assay. We show that CpG can enhance MAM-A-specific T cell responses, only when administered in combination with STAT3i. In line with these findings both Th1/Th2 cytokine release and intracellular T cell cytokine analyses point to a significantly skewed Th1 response on CpG+STAT3i targeting. The observed increased Th1/Th2 ratios on combined CpG and STAT3i conditioning mainly resulted from preventing CpG-enhanced levels of Th2 cytokine expression (IL-4 and IL-5) and not from an increase in Th1 proinflammatory cytokines. Whereas IL-4 induces differentiation of naive CD4 T cells into Th2 cells, IL-5 promotes the induction of Tregs.44 Findings in this study show that compared with CpG treatment alone, combined CpG+STAT3i treatment results in significantly decreased frequencies of both IL-4 producing CD4+ T cells and IL-5 producing CD8+ T cells (figure 5) and constrains Treg rates (figure 6C). Both would thus strengthen a type 1 antitumor T cell response. Similarly to the observed IFNγ increase, CpG exposure (with or without STAT3i) in BrC SLN cell samples induced significantly higher levels of the typical Th1-associated chemokines CXC9 and CXC10 which mediate CD4+ Th1 and CD8+ T cell recruitment to the TME45 46 and of the chemokines CCL2 and CCL5 which have been described to mediate DC-T cell interactions in LNs47–49 and cDC1 recruitment,50 both vital processes for efficient CD8+ T cell priming and the elicitation of a Th1 antitumor response. Of note, when produced by tumor-suppressed immune cells or by tumor cells themselves, CCL2 and CCL5 can also promote recruitment of immune-suppressive cells to tumor sites, such as tumor-associated macrophages and myeloid-derived suppressive cells.45 As such, the protumor or antitumor roles of CCL2 and CCL5 appear to be highly context (ie, disease and anatomic localization) dependent.45 51 As in this study chemokines were assessed in SLN draining from patients with early-stage BrC and not in the context of the tumor itself, presumably here CCL2 and CCL5 would most prominently exert their T cell priming and antitumor functions, and conceivably even more so under proinflammatory conditions induced by CpG.
Combined, these cytokine and chemokine data illustrate that while CpG in fact controls the initiation of the (Th1) proinflammatory response, the effect of adding STAT3i to CpG activation was mainly limited to counterbalancing of the CpG-induced Th2 response, ultimately promoting type 1-mediated antitumor immunity and leading to the induction of a BrC-specific T cell response. This would also fit with the observed lack of changes in IL-12 content in 2-day supernatants between the medium control and CpG±STAT3i conditioned SLN cell cultures (online supplemental figure S3), which may be explained by the fact that CpG-B directly impacts pDC but not cDC and that cDC rather than pDC are a major source of IL-12.52 Of note, in a group of four SLN samples we observed increased IFNα release on culture with CpG, most likely secreted by pDC, which also remained unaffected by the addition of STAT3i (online supplemental figure S6).
Supplemental material
Seemingly in contrast to the observed increased IFNγ and proinflammatory chemokine levels, is the finding of decreased frequencies of IL-2 and TNFα producing CD4+ and CD8+ T cells in the CpG±STAT3i conditioned groups. However, it is known that both IL-2 and TNFα are important in the early stages of T cell activation, involving expansion, whereas more differentiated effector T cells typically produce less IL-2 and/or TNFα.53 Therefore, CD4+ and CD8+ T cells in both the CpG and CpG+STAT3i groups likely represent a more differentiated T cell population.
The finding that the combination of CpG/STAT3i did not result in lower IL-10 levels as compared with CpG was surprising, as it is known that CpG can induce IL-10 through direct TLR9-mediated STAT3 activation.54 A possible explanation as to why we did not observe lower IL-10 levels on combined targeting with CpG and STAT3i, is that the measured IL-10 levels in the supernatants were in fact cumulative. Whereas STAT3 activation by CpG occurs rapidly, inhibition of STAT3 activity by AG490 was delayed (see figure 1B and online supplemental figure S2) most likely because it occurs through an indirect mechanism (ie, by blocking JAK2-mediated pSTAT3), probably allowing early IL-10 release to occur. As a consequence, decreased real-time IL-10 release by immune cell subsets on indirect inhibition of the STAT3 pathway might be missed because of early CpG-induced and STAT3 activation-mediated IL-10 release dominating the cumulatively measured IL-10 levels. A similar explanation could also account for the lack of decreased IL-6 release in response to combined CpG and STAT3i treatment. The induction of a Th2 (and IL-10) response by CpG was further accompanied by increased Treg levels on CpG addition alone. Importantly, combining CpG administration with STAT3i did prevent this increase.
Kortylewski et al previously provided evidence for the therapeutic efficacy of CpG combined with STAT3 targeting.13 27 28 Similarly to our findings, they showed increased CpG-induced DC maturation, T cell activation and generation of tumor Ag-specific T cells by eliminating collateral STAT3‐mediated suppressive effects in a mouse-melanoma model. Importantly, they also provided evidence for a reciprocal mechanism underlying the therapeutic effects of combined CpG administration and STAT3 targeting, that is, that by inhibiting STAT3 signaling not only the brake had been lifted from CpG-mediated immune responses (by reducing the immune suppressive potential mediated by CpG), but also that the antitumor effect of STAT3i was enhanced by the induction of pro-inflammatory conditions by CpG.
To our knowledge we are the first to ascertain the therapeutic potential of combined CpG+STAT3i targeting in BrC. Furthermore, whereas BrC immunotherapy to date has mainly focused on TN and HER2+ BrC,3 4 here we show that also in HR positive BrC, immune-regulated pathways can be targeted to restore BrC-related immune suppression and induce a BrC-specific T cell response. This is highlighted by our finding that out of nine BrC SLNs, all corresponding to HR+ BrC subtypes, in four cases significantly increased MAM-A-specific T cell responses could be detected after ex vivo SLN immune modulation with CpG+STAT3i.
Due to increased presence of tumor-infiltrating lymphocytes (TIL) and their prognostic significance in TN and HER2+ BrC,55 56 these subtypes have been regarded as more immunogenic than non-T cell-inflamed HR+ BrC subtypes. Evidence is accumulating that in non-T cell-inflamed tumors, innate immune pathways required for recruitment/activation of DCs and T cell priming/homing into the tumor bed (and thus presence of TIL) might not be engaged, and that for all of these steps in the immune activation cycle to function properly, a IFN-I proinflammatory response is required.46 57 Although exact molecular mechanisms responsible for this immune exclusion are still being unraveled, activation of the STAT3 pathway has been implicated as a potential candidate.46 In our endeavor to target BrC-mediated immune suppression of LNR DC subsets in the SLN, we have shown that CpG targeting combined with STAT3i can not only efficiently reactivate these LNR DC subsets but can in fact also induce a proinflammatory response. Combined this might convert an immune-excluded BrC into an immune-inflamed tumor, independent of BrC subtype, and thus increase the efficacy of immune checkpoint blockade. Although in this study the population of BrC SLN which was tested for BrC-specific T cell responses was limited to the HR+ BrC subtype, CpG+STAT3i mediated induction of a BrC-specific T cell response will likely not be limited to HR+ BrC subtypes. Whereas JAK2/STAT3 signaling can occur in all BrC subtypes, it is most often associated with TN and HER2+ subtypes.21 58 Indeed, we previously showed that BrC-related immune suppression preferentially affected LNR DC subsets (ie, pDC and LNR-cDC) and that their suppressed state was more profound in HR− BrC subtypes.7 Moreover, we here show that the DC stimulatory effect of CpG+STAT3i was most profound in these LNR DC subsets and although sample sizes were too small for definitive subgroup analyses, when comparing HR− versus HR+ draining SLN similar increases in activation/maturation marker expression levels on CpG+STAT3i treatment (day 7) were observed (online supplemental figure S7).
Supplemental material
In conclusion, our findings provide a clear rationale for clinical exploration of BrC SLN immune potentiation through local CpG+STAT3i administration for all BrC subtypes. In view of increasing evidence that immune-regulated pathways influence the response to (neo)adjuvant chemotherapy, we anticipate clinical benefit not only of combining this immune stimulatory cocktail with immune checkpoint blockade, but also with (neoadjuvant) chemotherapy.
Acknowledgments
We thank Sinéad Lougheed and Tara Muijlwijk for excellent technical assistance.
References
Supplementary materials
Supplementary Data
This web only file has been produced by the BMJ Publishing Group from an electronic file supplied by the author(s) and has not been edited for content.
Footnotes
Twitter @DeRieneke
Contributors This study was conceived by KMvP and TDdG. Lab protocols and experiments were designed by KMvP, RvdV and TDdG. KMvP recruited patients, performed experiments and analyzed data. MTAdB performed experiments and analyzed data. RvdV and TDdG supervised lab work. MPvdT, RJCLMV and HBACS were clinical supervisors in the participating hospitals. KMvP and TDdG wrote the manuscript. All authors critically reviewed and approved the final manuscript.
Funding This work was supported by grants from A Sister’s Hope (HBACS and TDdG) and the Dutch Cancer Society (KWF VU2015-7864, RvdV, TDdG).
Competing interests None declared.
Patient consent for publication Not required.
Ethics approval This study was approved by the Institutional Review Board of the VU University medical center (IRB permit number 2012-421). SLN samples were collected and handled according to ethical and medical guidelines described in the Code of Conduct for Proper Use of Human Tissue of the Dutch Federation of Biomedical Scientific Societies with written informed consent from the patients prior to SLN sampling.
Provenance and peer review Not commissioned; externally peer reviewed.
Data availability statement Data are available upon reasonable request. Datasets used and analyzed during the current study are available from the corresponding author upon reasonable request.
Supplemental material This content has been supplied by the author(s). It has not been vetted by BMJ Publishing Group Limited (BMJ) and may not have been peer-reviewed. Any opinions or recommendations discussed are solely those of the author(s) and are not endorsed by BMJ. BMJ disclaims all liability and responsibility arising from any reliance placed on the content. Where the content includes any translated material, BMJ does not warrant the accuracy and reliability of the translations (including but not limited to local regulations, clinical guidelines, terminology, drug names and drug dosages), and is not responsible for any error and/or omissions arising from translation and adaptation or otherwise.